The “fog of war” is often used during times of conflict with news flow stifled and unclear.
This is especially true in the current climate with traders trying to view the latest headlines coming out of Ukraine. Asian stock markets, and European and US futures are trading lower on news that fighting has reached Europe’s biggest nuclear plant. The euro has tumbled again, on reports that Russian forces have captured Europe’s largest nuclear plant in the Ukraine, and is close to 1.10 in EUR/USD.
Europe, the ECB and conflict
Euro assets have been hit hard and remain vulnerable.
The Russian offensive and its impact on eurozone growth is currently estimated in the region of 0.5-1.5% and the ECB is already making noises about treading very carefully when it comes to future monetary policy. Indeed, it is highly likely to express solidarity with Ukraine and express a cautious stance at its meeting next week. This comes after the latest minutes of February’s ECB meeting confirmed increasing unease about ultra-loose policy and a growing willingness to start normalising.
But this was before the Ukrainian crisis blew up.
This means all-important ECB staff projections will be stale next week and not take into account the rampant commodity prices seen recently. Policymakers will be in a very tough spot with stagflation fears growing. This is a situation of slow growth and high inflation, which frankly, is only going one way in the current environment.
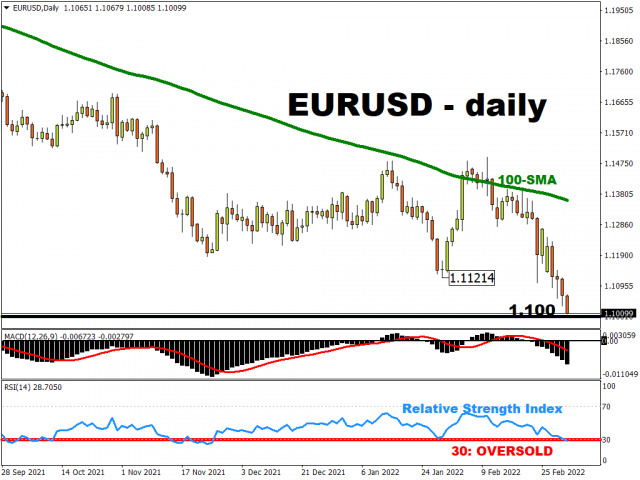
EUR/USD has made new lows again today and is rapidly closing in on 1.10.
This is a key psychological level, and many traders expect it to be defended with huge options and stops around here. But the single currency is unloved and showing limited signs of reversal of its decline since early February.
If we do get a bounce, resistance after the 1.11 zone sits in the mid-figure area.
NFP and a hawkish Fed
Money markets have priced back in some Fed tightening after Chair Powell’s testimony midweek removed some doubts about the bank’s tightening plans. The world’s most powerful central banker all but confirmed a 25bp rate hike at the Fed meeting in March and Fed Fund futures have around six hikes priced back in by the end of the year.
We get the release of the normally all-important monthly NFP data today with consensus expecting a 400k headline print.
There will be focus on wage growth which may have increased to 6% with a drop in unemployment expected. Investors may have more attention on next week’s US CPI figures.
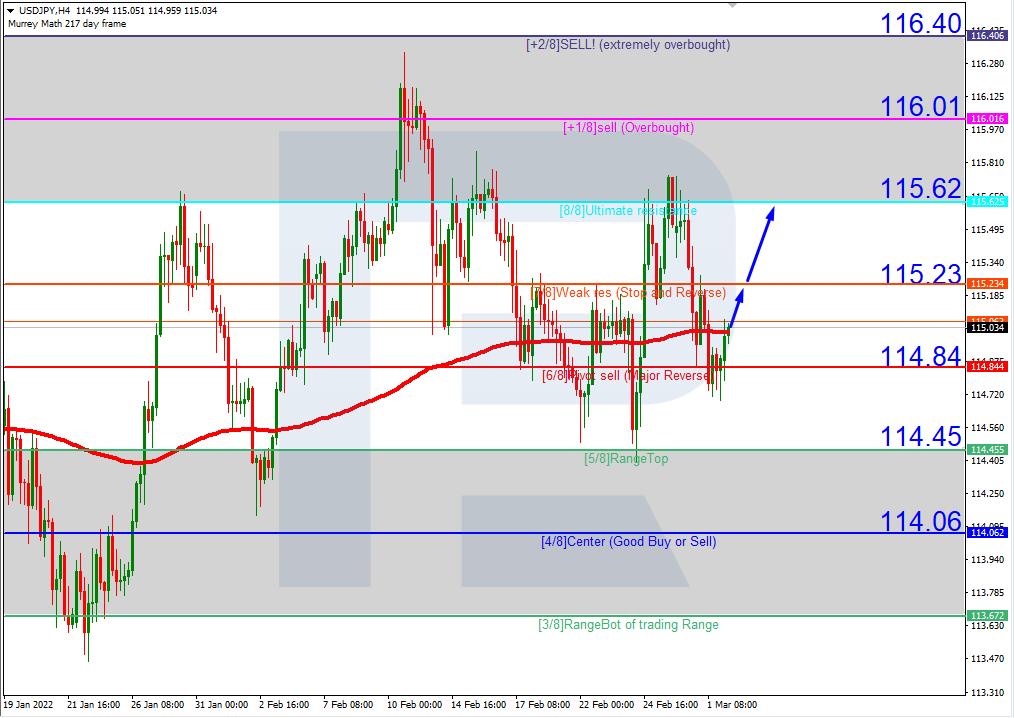
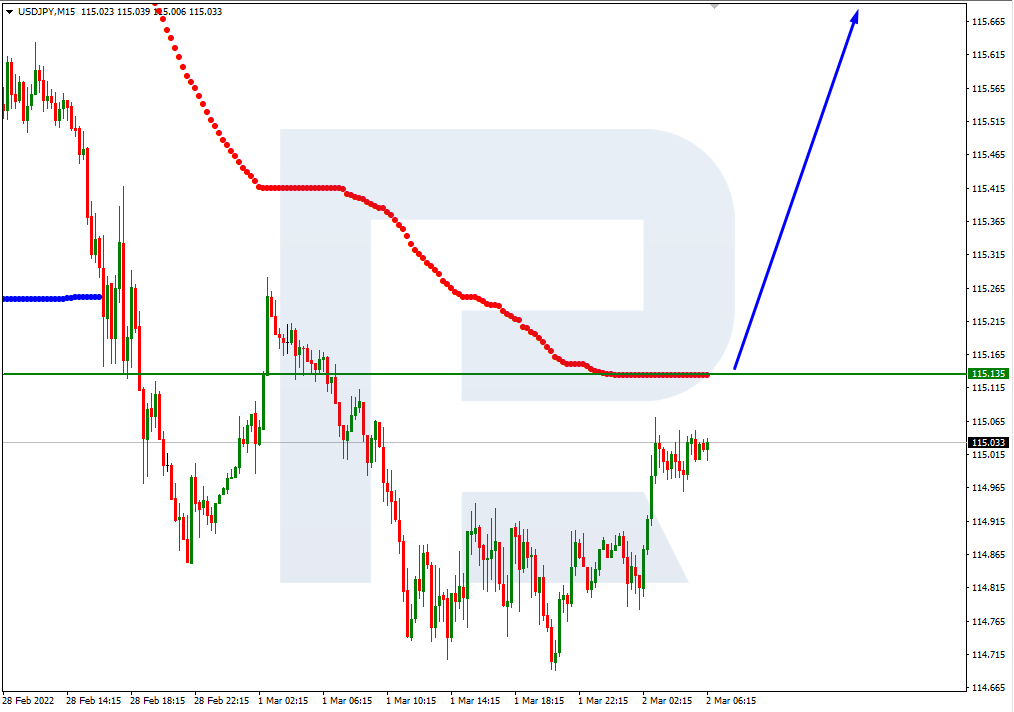
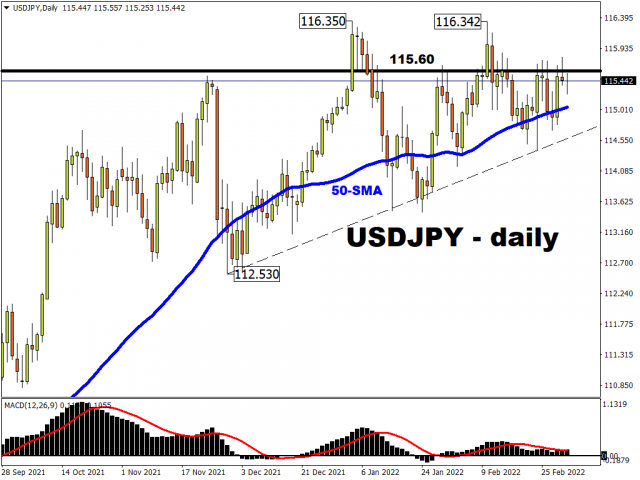
USD/JPY is usually the most volatile major on the release of the employment report, but the conflict in Ukraine has centred much focus on the collapse of euro assets. The yen is an obvious safe haven, but its attractiveness is being hampered by surging commodity and energy costs.
USD/JPY bulls need to close strongly above 115.60 to make gains towards 116.35 and above.
Disclaimer: The content in this article comprises personal opinions and should not be construed as containing personal and/or other investment advice and/or an offer of and/or solicitation for any transactions in financial instruments and/or a guarantee and/or prediction of future performance. ForexTime (FXTM), its affiliates, agents, directors, officers or employees do not guarantee the accuracy, validity, timeliness or completeness, of any information or data made available and assume no liability as to any loss arising from any investment based on the same.
![]() Article by ForexTime
Article by ForexTime
ForexTime Ltd (FXTM) is an award winning international online forex broker regulated by CySEC 185/12 www.forextime.com