
By Dmitriy Gurkovskiy, Chief Analyst at RoboForex
On Monday 28 February, the major currency pair is falling and trading at 1.1169. Market players are now interested in the “safe” USD as it often happens during global market fluctuations.
Investors are not so focused on statistics as before due to inflamed geopolitical tensions in the world. However, there will be some interesting reports that shouldn’t be overlooked.
For example, the US labour market data for February, which is usually published early in a month. The Unemployment Rate is expected to drop to 3.8-3.9% after being 4.0% the month before. The Non-Farm Payroll may increase due to the removal of anti-coronavirus restrictions. This is good news for the “greenback”.
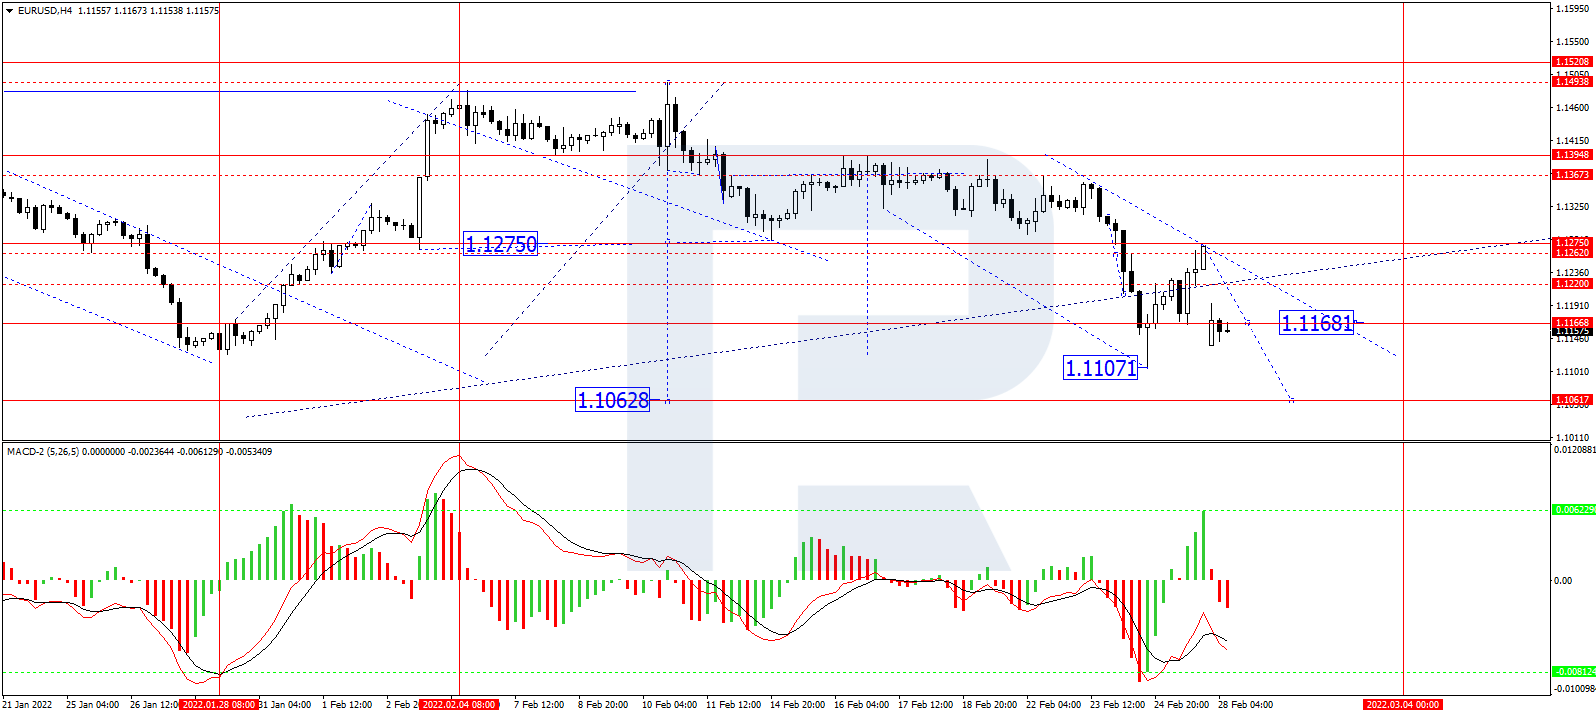
In the H4 chart, having finished another correctional wave at 1.1270 along with the descending structure towards 1.1168, EUR/USD is consolidating around the latter level. If later the price breaks this range to the downside, the market may resume falling with the target at 1.1060 and then grow to reach 1.1400; if to the upside – start another growth towards 1.1230 and then form a new descending structure to reach the above-mentioned target. From the technical point of view, this scenario is confirmed by MACD Oscillator: its signal line is falling towards new lows.
Free Reports:
 Get our Weekly Commitment of Traders Reports - See where the biggest traders (Hedge Funds and Commercial Hedgers) are positioned in the futures markets on a weekly basis.
 Download Our Metatrader 4 Indicators – Put Our Free MetaTrader 4 Custom Indicators on your charts when you join our Weekly Newsletter
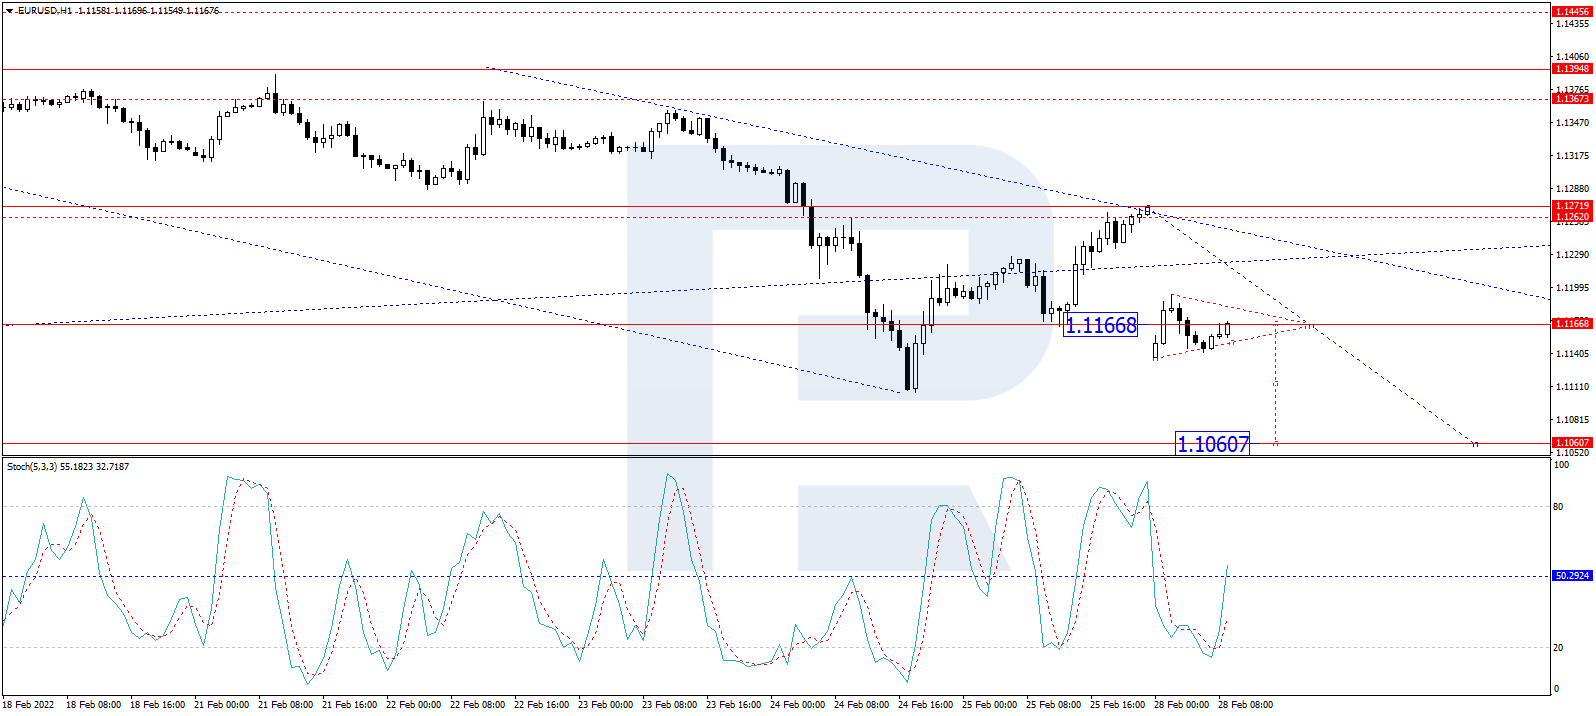
As we can see in the H1 chart, after rebounding from 1.1270, EUR/USD is forming a new descending impulse and has already reached 1.1160; right now, it is consolidating around the latter level. Possibly, the pair may correct towards 1.1200 and then start a new decline to reach 1.1070. Later, the market may grow to test 1.1170 from below and then resume trading downwards with the target at 1.1060. From the technical point of view, this idea is confirmed by the Stochastic Oscillator: its signal line is moving above 20 and may continue growing to reach 50. Later, the line may rebound from 20 and start a new decline to return to 20.
Disclaimer
Any predictions contained herein are based on the author’s particular opinion. This analysis shall not be treated as trading advice. RoboForex shall not be held liable for the results of the trades arising from relying upon trading recommendations and reviews contained herein.

- COT Metals Charts: Speculator Bets led by Gold, Copper & Platinum Aug 9, 2026
- COT Bonds Charts: Speculator Bets led by 2-Year Bonds & US Treasury Bonds Aug 9, 2026
- COT Energy Charts: Speculator Bets led by Heating Oil & Bloomberg Index Aug 9, 2026
- COT Soft Commodities Charts: Speculator Bets led by Sugar & Cotton Aug 9, 2026
- The Central Bank of Mexico kept its interest rate unchanged. Iran plans to introduce strict bans for US and Israeli vessels in the Strait of Hormuz Aug 7, 2026
- USD/JPY Holds Firm: Yen Loses Some Support Aug 7, 2026
- Australian trade balance returned to positive territory Aug 6, 2026
- Results in Line for Most Reporting Companies Aug 5, 2026
- Stock indices continue to break records. Oil is falling amid intensified diplomatic dialogue between the US and Iran Aug 5, 2026
- USD/JPY Holds Steady After Intervention: Outlook Remains Uncertain Aug 5, 2026
