by JustForex
The EUR/USD currency pair
- Prev Open: 1.0497
- Prev Close: 1.0541
- % chg. over the last day: +0.42%
A recent US consumer poll released by the University of Michigan on Friday showed that many Americans believe the Fed will have a hard time ensuring a soft landing of the economy due to the planned aggressive rate hikes. The Federal Reserve will almost certainly approve a rate increase of 50 basis points, or 0.5%, this week. Traders are also predicting a 75 basis point hike at the June meeting.
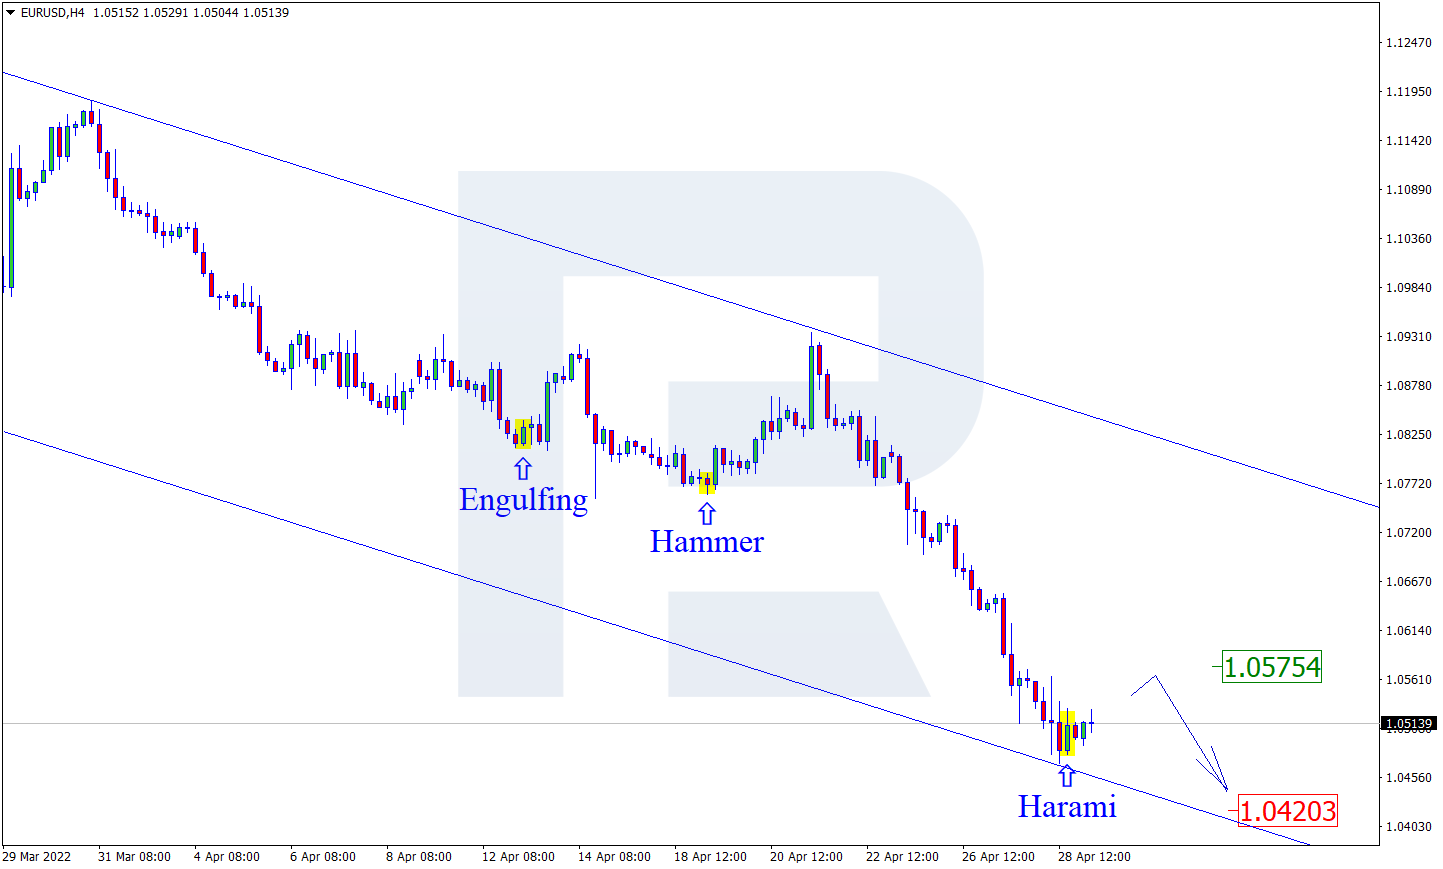
- Support levels: 1.0453
- Resistance levels: 1.0580, 1.0633, 1.0770, 1.0796, 1.0870, 1.0908, 1.0936
From the technical point of view, the trend on the EUR/USD currency pair on the hourly time frame is bearish. The price reached the support level and is trading flat now. The MACD indicator has become inactive. Under such market conditions, traders can look for sell deals from the resistance level of 1.0633, but only after the additional confirmation. Buy trades can be considered on intraday timeframes from the support level of 1.0453, but only with short targets and confirmation.
Alternative scenario: if the price breaks out through the 1.0770 resistance level and fixes above, the uptrend will likely resume.

- – German Retail Sales (m/m) at 09:00 (GMT+3);
- – Spanish Manufacturing PMI (m/m) at 10:15 (GMT+3);
- – Italian Manufacturing PMI (m/m) at 10:45 (GMT+3);
- – French Manufacturing PMI (m/m) at 10:50 (GMT+3);
- – German Manufacturing PMI (m/m) at 10:55 (GMT+3);
- – Eurozone Manufacturing PMI (m/m) at 11:00 (GMT+3);
- – US ISM Manufacturing PMI (m/m) at 17:00 (GMT+3).
The GBP/USD currency pair
- Prev Open: 1.2552
- Prev Close: 1.2571
- % chg. over the last day: +0.15%
Bank of England Governor Andrew Bailey said the central bank was on a “very narrow margin” between curbing inflation, which is 7%, three times higher than the target, and preventing a recession. A quarter-point rate hike to 1% would satisfy the precondition for the Bank of England to start actively selling its bonds. Active bond selling will tighten monetary conditions but could hurt the economy.
- Support levels: 1.2502, 1.2438
- Resistance levels: 1.2670, 1.2791, 1.2862, 1.2917, 1.2981, 1.3010, 1.3083, 1.3115
On the hourly time frame, the GBP/USD currency pair trend is still bearish. The price reached the support level and is trading flat now. The MACD indicator has become inactive. Under such market conditions, sell trades should be looked for from the resistance level of 1.2670, but with confirmation. For buy deals, traders may consider the level of 1.2502, but only with short targets.
Alternative scenario: if the price breaks down through the 1.2863 resistance level and fixes above, the mid-term uptrend will likely be resumed.

The USD/JPY currency pair
- Prev Open: 130.84
- Prev Close: 129.85
- % chg. over the last day: -0.76%
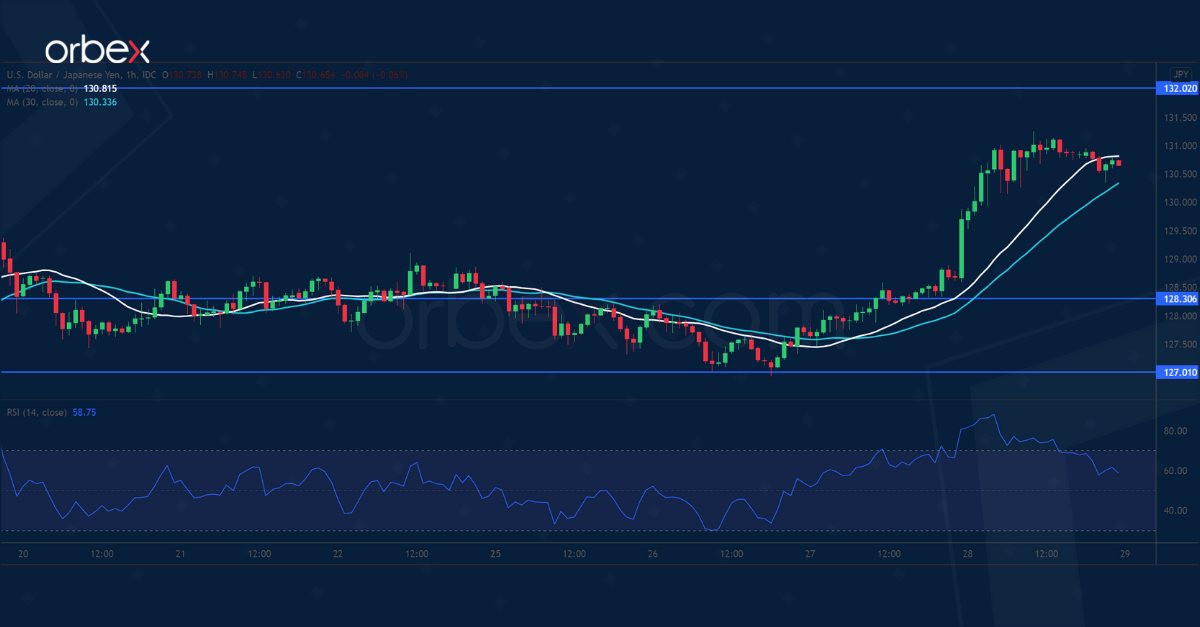
The fundamental picture of the USD/JPY currency pair remains unchanged. Central banks’ monetary policy in the US and Japan is the opposite. The central bank of Japan is still aiming for ultra-soft conditions, while the US Federal Reserve is aggressively tightening monetary policy. Bank of Japan Governor Haruhiko Kuroda still sees the yen’s weakness as a positive for Japan. However, policymakers fear the yen at a 20-year low will suffer from more expensive food and fuel. The survey found that half of the Japanese companies expect higher costs to affect their profits. There are no prerequisites for a medium-term trend reversal yet. But traders should keep in mind that markets are pricing in future scenarios, so any verbal information about monetary policy changes can lead to radical corrective action.
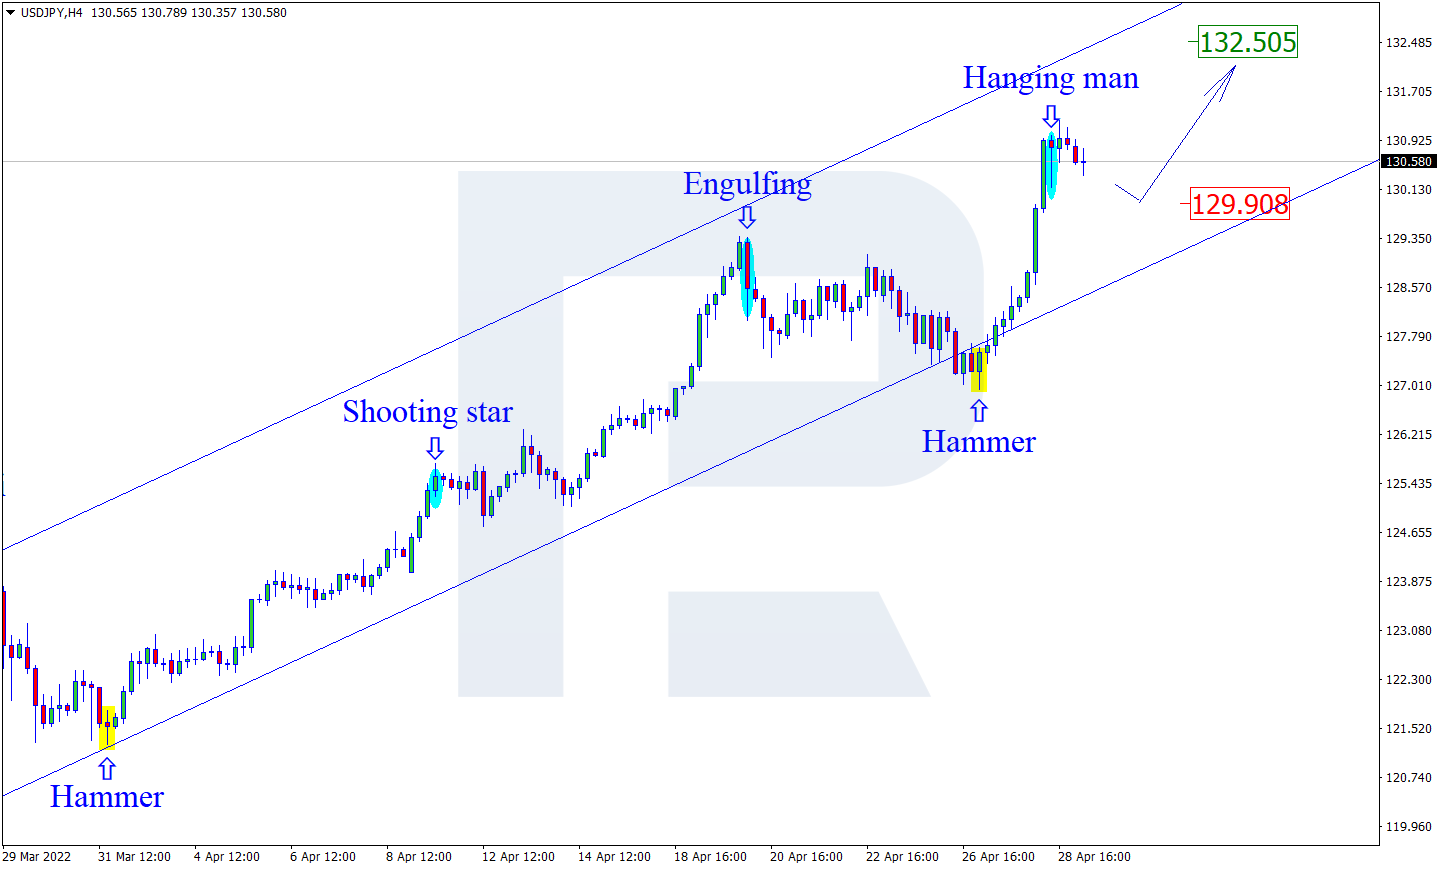
- Support levels: 129.10, 128.51, 127.24, 126.91, 125.48, 124.66, 122.97
- Resistance levels: 130.85
The medium-term trend on the USD/JPY currency pair is bullish. The MACD indicator has become inactive, and the buyers’ pressure has decreased. Under such market conditions, it is best to look for buy deals, expecting the continuation of the uptrend, but only after a pullback, as the price has strongly deviated from the average values. First of all, it is worth considering the support level of 129.10 or 128.51, but with additional confirmation. A resistance level of 130.85 may be considered for sell deals, but only with short targets.
Alternative scenario: If the price fixes below 126.91, the uptrend will likely be broken.

- – Japan Manufacturing PMI (m/m) at 03:30 (GMT+3).
The USD/CAD currency pair
- Prev Open: 1.2804
- Prev Close: 1.2858
- % chg. over the last day: +0.42%
Economic growth in Canada has reached its annual high. On Friday, Statistics Canada reported real gross domestic product increased by 1.1% last month, the largest monthly gain since March 2021. This is the ninth consecutive monthly gain. In early April, the central bank raised the key interest rate by 0.5% for the first time in more than 20 years and warned that more rate hikes are coming, but analysts believe the next hikes will be 0.25% each. But last week, Bank of England Governor Tiff Macklem told a House of Commons committee that the bank would consider taking another 50 basis point step.
- Support levels: 1.2751, 1.2684, 1.2644, 1.2607, 1.2521
- Resistance levels: 1.2852
In terms of technical analysis, the USD/CAD currency pair is bullish. The MACD indicator became positive, and the buyer’s pressure increased again. Trade is worth it only with short targets. Under such market conditions, it is better to look for buy trades on the lower timeframes from the support level of 1.2571, but it is better with additional confirmation. For sell deals, it is better to consider the resistance level of 1.2852, but it is also better with confirmation and short targets.
Alternative scenario: if the price breaks through and consolidates below 1.2644, the downtrend will likely be resumed.

- – Canada Manufacturing PMI (m/m) at 16:30 (GMT+3).
by JustForex
This article reflects a personal opinion and should not be interpreted as an investment advice, and/or offer, and/or a persistent request for carrying out financial transactions, and/or a guarantee, and/or a forecast of future events.