By InvestMacro | COT | Data Tables | COT Leaders | Downloads | COT Newsletter
Here are the latest charts and statistics for the Commitment of Traders (COT) data published by the Commodities Futures Trading Commission (CFTC).
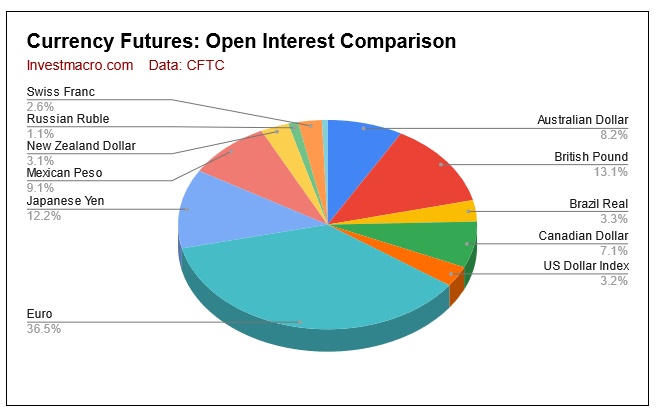
The latest COT data is updated through Tuesday May 24th and shows a quick view of how large traders (for-profit speculators and commercial entities) were positioned in the futures markets. All currency positions are in direct relation to the US dollar where, for example, a bet for the euro is a bet that the euro will rise versus the dollar while a bet against the euro will be a bet that the euro will decline versus the dollar.
Click to Enlarge
Highlighting the COT currency data is the bounce-back for the Euro currency futures contracts. Euro speculative positions jumped by over +18,000 contracts this week and rose for a third consecutive week. This week marked the second time in the past three weeks that speculator positions increased by more than +18,000 contracts (+22,907 contracts on May 10th) and now Euro bets have gained by a total of +45,308 contracts over the past three weeks. The speculator’s bullish position marks the highest standing of the past six weeks at +38,930 contracts.
Euro speculator positions had recently fallen into a bearish speculative level on May 3rd (-6,378 contracts) after dropping by a total of -45,438 contracts from April 19th to May 3rd. This was the first bearish position for the Euro since early January. The speculator sentiment has been weaker so far in 2022 compared to preceding years as Euro bets are averaging just +29,199 weekly contracts in 2022. This compares to the Euro bets average of +60,837 weekly contracts over 2021 and an average of +92,464 weekly contracts over 2020.
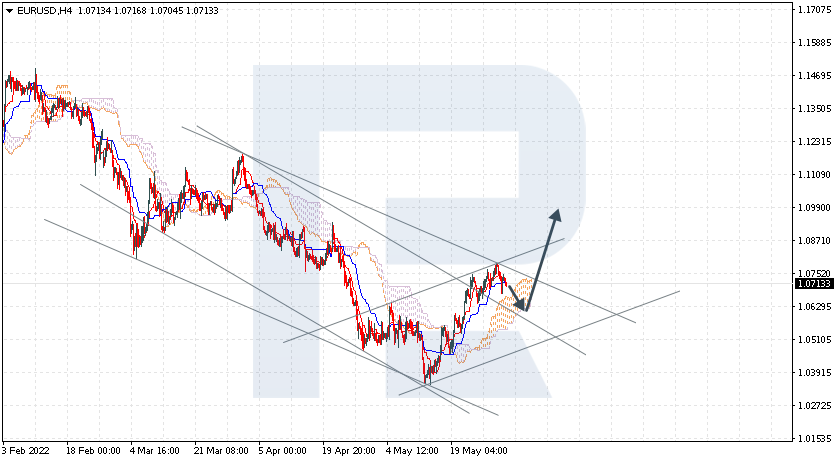
The recent improvement in Euro positions comes amid increasing expectations for the European Central Bank to start raising interest rates higher and end their negative interest rate regime in the third quarter. The Euro exchange rate recently hit its lowest level versus the US Dollar since January of 2017 with a drop to approximately 1.350 (EUR/USD) on May 13th. Since then, the Euro has rallied over the past couple of weeks and closed Friday at the 1.0733 exchange rate.
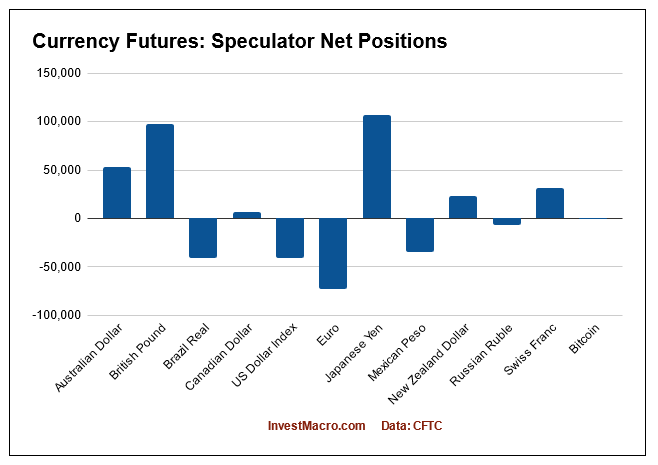
Overall, the currencies with higher speculator bets this week were the Euro (18,591 contracts), US Dollar Index (1,826 contracts), Japanese yen (2,865 contracts), Brazil real (619 contracts), Canadian dollar (1,809 contracts), Mexican peso (1,577 contracts) and Bitcoin (43 contracts).
The currencies with declining bets were the Australian dollar (-804 contracts), Swiss franc (-3,081 contracts), British pound sterling (-1,131 contracts) and the New Zealand dollar (-1,554 contracts).
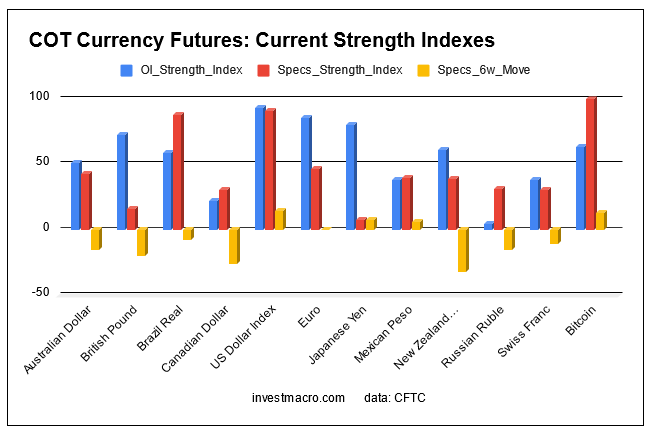
Speculator strength standings for each market where strength index is current net position compared to past three years, above 80 is bullish extreme, below 20 is bearish extreme
- OI Strength = Current Open Interest level compared to last 3 years range
- Spec Strength = Current Net Speculator level compared to last 3 years range
- Strength Move = Six week change of Spec Strength
| May-24-2022 | OI | OI-Index | Spec-Net | Spec-Index | Com-Net | COM-Index | Smalls-Net | Smalls-Index |
|---|
| USD Index | 61,857 | 93 | 38,039 | 91 | -40,877 | 7 | 2,838 | 48 |
| EUR | 708,938 | 86 | 38,930 | 47 | -72,600 | 55 | 33,670 | 30 |
| GBP | 253,864 | 73 | -80,372 | 16 | 97,042 | 87 | -16,670 | 21 |
| JPY | 237,256 | 80 | -99,444 | 8 | 106,699 | 88 | -7,255 | 39 |
| CHF | 49,918 | 38 | -19,673 | 31 | 31,694 | 76 | -12,021 | 17 |
| CAD | 138,508 | 22 | -12,687 | 30 | 6,933 | 71 | 5,754 | 41 |
| AUD | 158,615 | 51 | -45,446 | 43 | 53,269 | 59 | -7,823 | 33 |
| NZD | 59,279 | 61 | -19,321 | 39 | 22,703 | 65 | -3,382 | 13 |
| MXN | 177,125 | 39 | 29,792 | 40 | -34,352 | 58 | 4,560 | 62 |
| RUB | 20,930 | 4 | 7,543 | 31 | -7,150 | 69 | -393 | 24 |
| BRL | 63,976 | 59 | 38,714 | 88 | -40,501 | 12 | 1,787 | 86 |
| Bitcoin | 11,729 | 64 | 849 | 100 | -817 | 0 | -32 | 12 |
US Dollar Index Futures:
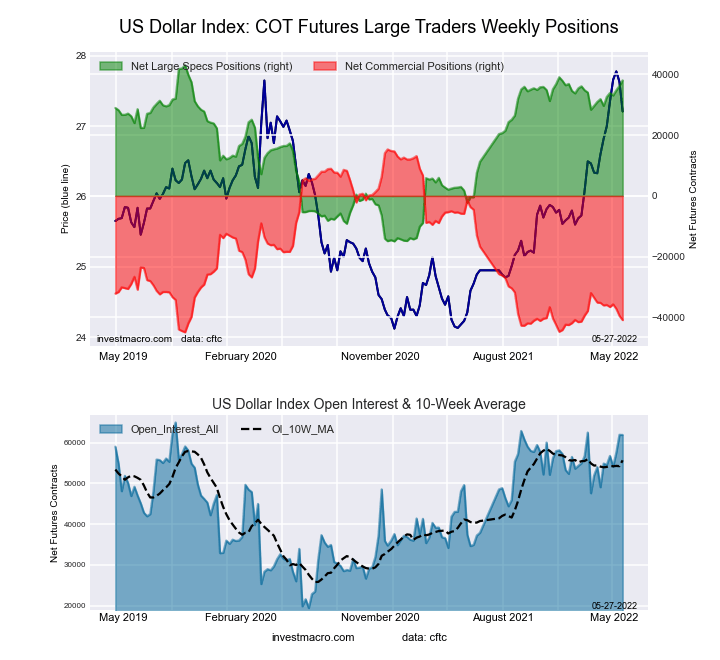 The US Dollar Index large speculator standing this week was a net position of 38,039 contracts in the data reported through Tuesday. This was a weekly gain of 1,826 contracts from the previous week which had a total of 36,213 net contracts.
This week’s current strength score (the trader positioning range over the past three years, measured from 0 to 100) shows the speculators are currently Bullish-Extreme with a score of 91.4 percent. The commercials are Bearish-Extreme with a score of 6.7 percent and the small traders (not shown in chart) are Bearish with a score of 47.6 percent.
| US DOLLAR INDEX Statistics | SPECULATORS | COMMERCIALS | SMALL TRADERS |
| – Percent of Open Interest Longs: | 86.8 | 3.5 | 8.2 |
| – Percent of Open Interest Shorts: | 25.3 | 69.6 | 3.6 |
| – Net Position: | 38,039 | -40,877 | 2,838 |
| – Gross Longs: | 53,675 | 2,157 | 5,076 |
| – Gross Shorts: | 15,636 | 43,034 | 2,238 |
| – Long to Short Ratio: | 3.4 to 1 | 0.1 to 1 | 2.3 to 1 |
| NET POSITION TREND: | | | |
| – Strength Index Score (3 Year Range Pct): | 91.4 | 6.7 | 47.6 |
| – Strength Index Reading (3 Year Range): | Bullish-Extreme | Bearish-Extreme | Bearish |
| NET POSITION MOVEMENT INDEX: | | | |
| – 6-Week Change in Strength Index: | 14.5 | -8.0 | -39.1 |
Euro Currency Futures:
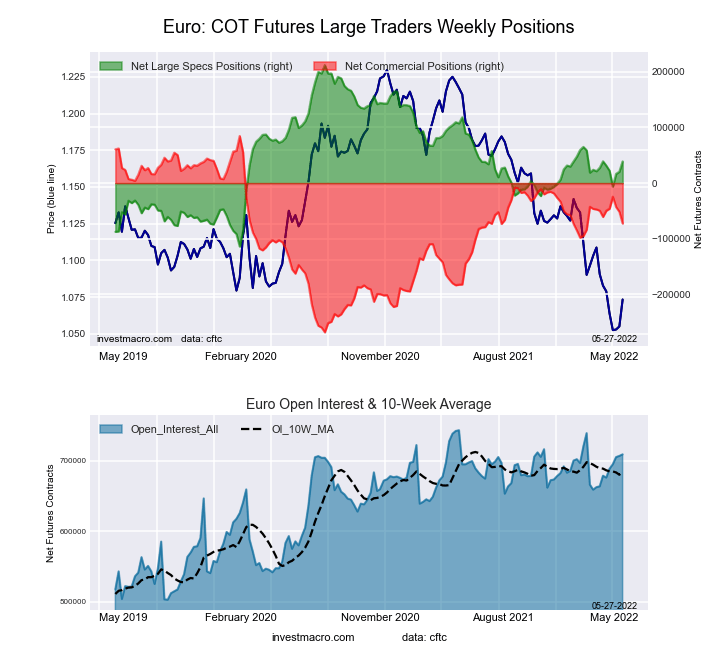 The Euro Currency large speculator standing this week was a net position of 38,930 contracts in the data reported through Tuesday. This was a weekly lift of 18,591 contracts from the previous week which had a total of 20,339 net contracts.
This week’s current strength score (the trader positioning range over the past three years, measured from 0 to 100) shows the speculators are currently Bearish with a score of 47.0 percent. The commercials are Bullish with a score of 55.4 percent and the small traders (not shown in chart) are Bearish with a score of 30.2 percent.
| EURO Currency Statistics | SPECULATORS | COMMERCIALS | SMALL TRADERS |
| – Percent of Open Interest Longs: | 33.4 | 51.7 | 12.4 |
| – Percent of Open Interest Shorts: | 27.9 | 61.9 | 7.6 |
| – Net Position: | 38,930 | -72,600 | 33,670 |
| – Gross Longs: | 237,072 | 366,345 | 87,892 |
| – Gross Shorts: | 198,142 | 438,945 | 54,222 |
| – Long to Short Ratio: | 1.2 to 1 | 0.8 to 1 | 1.6 to 1 |
| NET POSITION TREND: | | | |
| – Strength Index Score (3 Year Range Pct): | 47.0 | 55.4 | 30.2 |
| – Strength Index Reading (3 Year Range): | Bearish | Bullish | Bearish |
| NET POSITION MOVEMENT INDEX: | | | |
| – 6-Week Change in Strength Index: | -0.0 | -3.4 | 19.8 |
British Pound Sterling Futures:
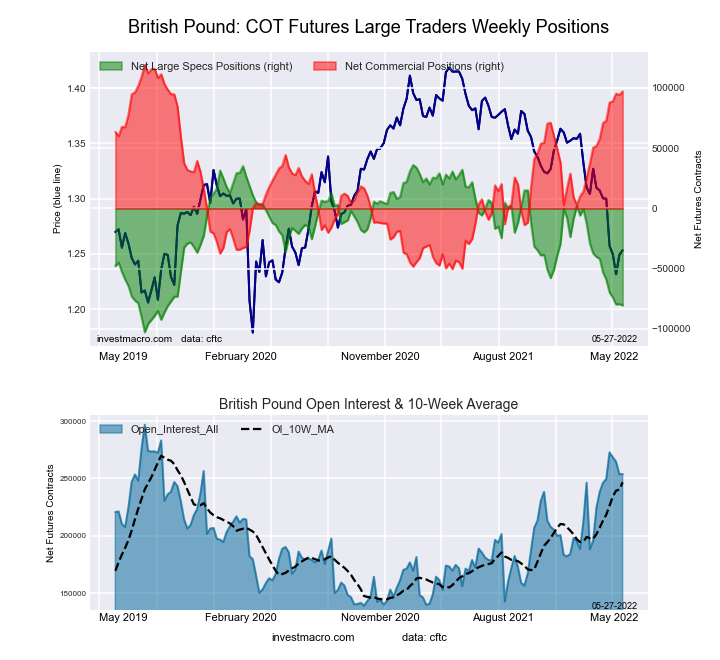 The British Pound Sterling large speculator standing this week was a net position of -80,372 contracts in the data reported through Tuesday. This was a weekly decline of -1,131 contracts from the previous week which had a total of -79,241 net contracts.
This week’s current strength score (the trader positioning range over the past three years, measured from 0 to 100) shows the speculators are currently Bearish-Extreme with a score of 16.1 percent. The commercials are Bullish-Extreme with a score of 87.1 percent and the small traders (not shown in chart) are Bearish with a score of 21.1 percent.
| BRITISH POUND Statistics | SPECULATORS | COMMERCIALS | SMALL TRADERS |
| – Percent of Open Interest Longs: | 10.2 | 80.3 | 7.5 |
| – Percent of Open Interest Shorts: | 41.9 | 42.1 | 14.1 |
| – Net Position: | -80,372 | 97,042 | -16,670 |
| – Gross Longs: | 25,936 | 203,802 | 19,107 |
| – Gross Shorts: | 106,308 | 106,760 | 35,777 |
| – Long to Short Ratio: | 0.2 to 1 | 1.9 to 1 | 0.5 to 1 |
| NET POSITION TREND: | | | |
| – Strength Index Score (3 Year Range Pct): | 16.1 | 87.1 | 21.1 |
| – Strength Index Reading (3 Year Range): | Bearish-Extreme | Bullish-Extreme | Bearish |
| NET POSITION MOVEMENT INDEX: | | | |
| – 6-Week Change in Strength Index: | -19.7 | 15.4 | 2.5 |
Japanese Yen Futures:
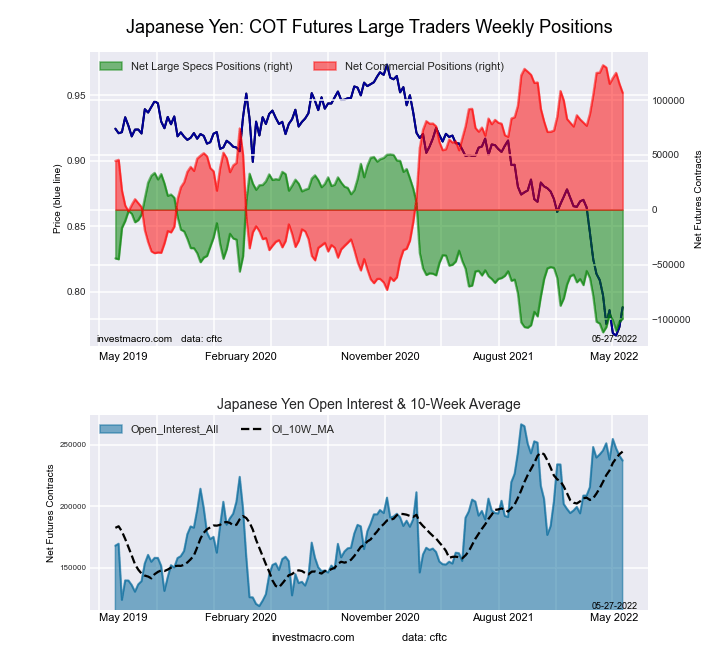 The Japanese Yen large speculator standing this week was a net position of -99,444 contracts in the data reported through Tuesday. This was a weekly lift of 2,865 contracts from the previous week which had a total of -102,309 net contracts.
This week’s current strength score (the trader positioning range over the past three years, measured from 0 to 100) shows the speculators are currently Bearish-Extreme with a score of 7.6 percent. The commercials are Bullish-Extreme with a score of 87.7 percent and the small traders (not shown in chart) are Bearish with a score of 38.7 percent.
| JAPANESE YEN Statistics | SPECULATORS | COMMERCIALS | SMALL TRADERS |
| – Percent of Open Interest Longs: | 7.0 | 81.0 | 10.5 |
| – Percent of Open Interest Shorts: | 48.9 | 36.0 | 13.5 |
| – Net Position: | -99,444 | 106,699 | -7,255 |
| – Gross Longs: | 16,567 | 192,215 | 24,858 |
| – Gross Shorts: | 116,011 | 85,516 | 32,113 |
| – Long to Short Ratio: | 0.1 to 1 | 2.2 to 1 | 0.8 to 1 |
| NET POSITION TREND: | | | |
| – Strength Index Score (3 Year Range Pct): | 7.6 | 87.7 | 38.7 |
| – Strength Index Reading (3 Year Range): | Bearish-Extreme | Bullish-Extreme | Bearish |
| NET POSITION MOVEMENT INDEX: | | | |
| – 6-Week Change in Strength Index: | 7.6 | -12.3 | 26.0 |
Swiss Franc Futures:
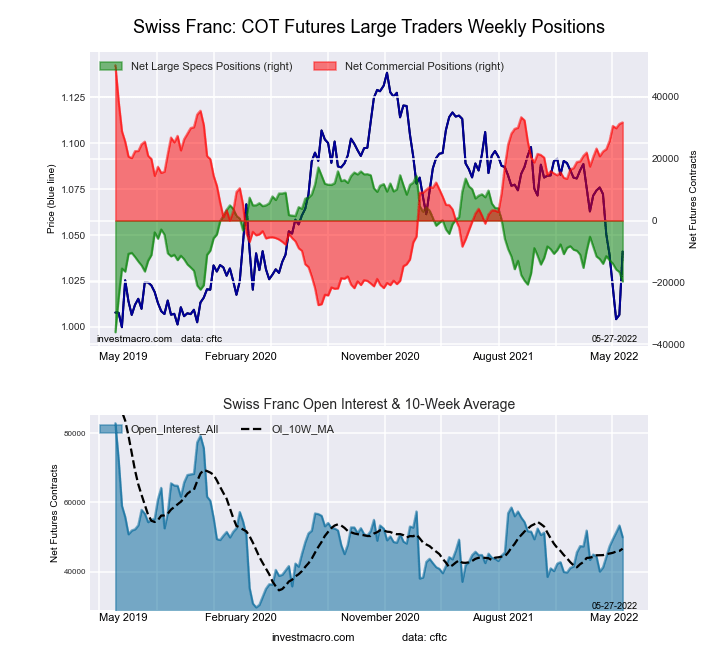 The Swiss Franc large speculator standing this week was a net position of -19,673 contracts in the data reported through Tuesday. This was a weekly fall of -3,081 contracts from the previous week which had a total of -16,592 net contracts.
This week’s current strength score (the trader positioning range over the past three years, measured from 0 to 100) shows the speculators are currently Bearish with a score of 30.8 percent. The commercials are Bullish with a score of 76.2 percent and the small traders (not shown in chart) are Bearish-Extreme with a score of 16.8 percent.
| SWISS FRANC Statistics | SPECULATORS | COMMERCIALS | SMALL TRADERS |
| – Percent of Open Interest Longs: | 2.7 | 80.0 | 16.6 |
| – Percent of Open Interest Shorts: | 42.1 | 16.5 | 40.7 |
| – Net Position: | -19,673 | 31,694 | -12,021 |
| – Gross Longs: | 1,355 | 39,913 | 8,308 |
| – Gross Shorts: | 21,028 | 8,219 | 20,329 |
| – Long to Short Ratio: | 0.1 to 1 | 4.9 to 1 | 0.4 to 1 |
| NET POSITION TREND: | | | |
| – Strength Index Score (3 Year Range Pct): | 30.8 | 76.2 | 16.8 |
| – Strength Index Reading (3 Year Range): | Bearish | Bullish | Bearish-Extreme |
| NET POSITION MOVEMENT INDEX: | | | |
| – 6-Week Change in Strength Index: | -10.8 | 12.1 | -12.4 |
Canadian Dollar Futures:
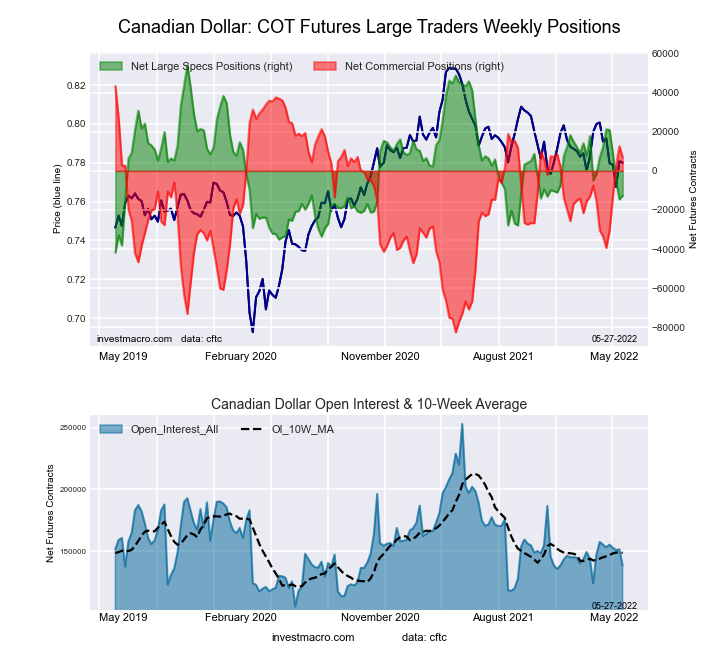 The Canadian Dollar large speculator standing this week was a net position of -12,687 contracts in the data reported through Tuesday. This was a weekly increase of 1,809 contracts from the previous week which had a total of -14,496 net contracts.
This week’s current strength score (the trader positioning range over the past three years, measured from 0 to 100) shows the speculators are currently Bearish with a score of 30.4 percent. The commercials are Bullish with a score of 71.1 percent and the small traders (not shown in chart) are Bearish with a score of 41.2 percent.
| CANADIAN DOLLAR Statistics | SPECULATORS | COMMERCIALS | SMALL TRADERS |
| – Percent of Open Interest Longs: | 20.9 | 54.1 | 23.1 |
| – Percent of Open Interest Shorts: | 30.1 | 49.1 | 19.0 |
| – Net Position: | -12,687 | 6,933 | 5,754 |
| – Gross Longs: | 28,999 | 74,953 | 32,048 |
| – Gross Shorts: | 41,686 | 68,020 | 26,294 |
| – Long to Short Ratio: | 0.7 to 1 | 1.1 to 1 | 1.2 to 1 |
| NET POSITION TREND: | | | |
| – Strength Index Score (3 Year Range Pct): | 30.4 | 71.1 | 41.2 |
| – Strength Index Reading (3 Year Range): | Bearish | Bullish | Bearish |
| NET POSITION MOVEMENT INDEX: | | | |
| – 6-Week Change in Strength Index: | -25.9 | 32.1 | -30.9 |
Australian Dollar Futures:
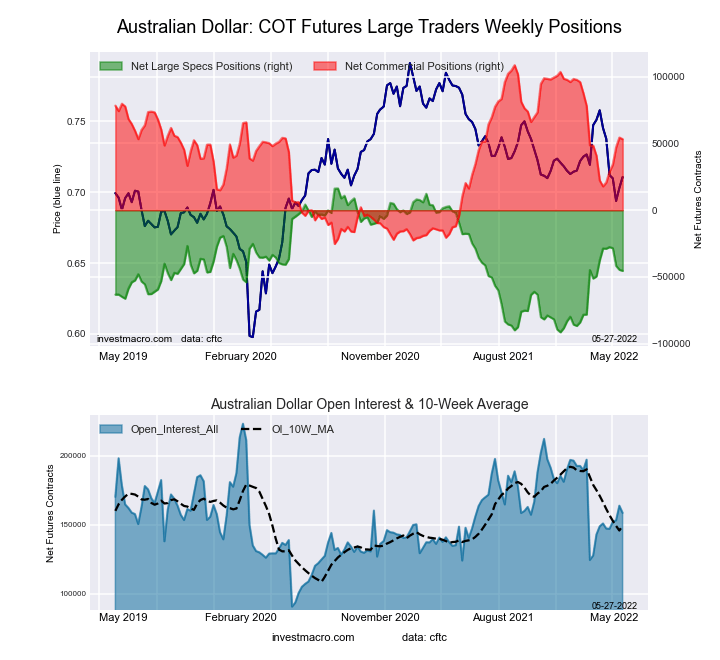 The Australian Dollar large speculator standing this week was a net position of -45,446 contracts in the data reported through Tuesday. This was a weekly fall of -804 contracts from the previous week which had a total of -44,642 net contracts.
This week’s current strength score (the trader positioning range over the past three years, measured from 0 to 100) shows the speculators are currently Bearish with a score of 42.7 percent. The commercials are Bullish with a score of 58.6 percent and the small traders (not shown in chart) are Bearish with a score of 33.4 percent.
| AUSTRALIAN DOLLAR Statistics | SPECULATORS | COMMERCIALS | SMALL TRADERS |
| – Percent of Open Interest Longs: | 23.1 | 62.7 | 11.7 |
| – Percent of Open Interest Shorts: | 51.7 | 29.1 | 16.7 |
| – Net Position: | -45,446 | 53,269 | -7,823 |
| – Gross Longs: | 36,579 | 99,401 | 18,615 |
| – Gross Shorts: | 82,025 | 46,132 | 26,438 |
| – Long to Short Ratio: | 0.4 to 1 | 2.2 to 1 | 0.7 to 1 |
| NET POSITION TREND: | | | |
| – Strength Index Score (3 Year Range Pct): | 42.7 | 58.6 | 33.4 |
| – Strength Index Reading (3 Year Range): | Bearish | Bullish | Bearish |
| NET POSITION MOVEMENT INDEX: | | | |
| – 6-Week Change in Strength Index: | -15.5 | 26.4 | -45.5 |
New Zealand Dollar Futures:
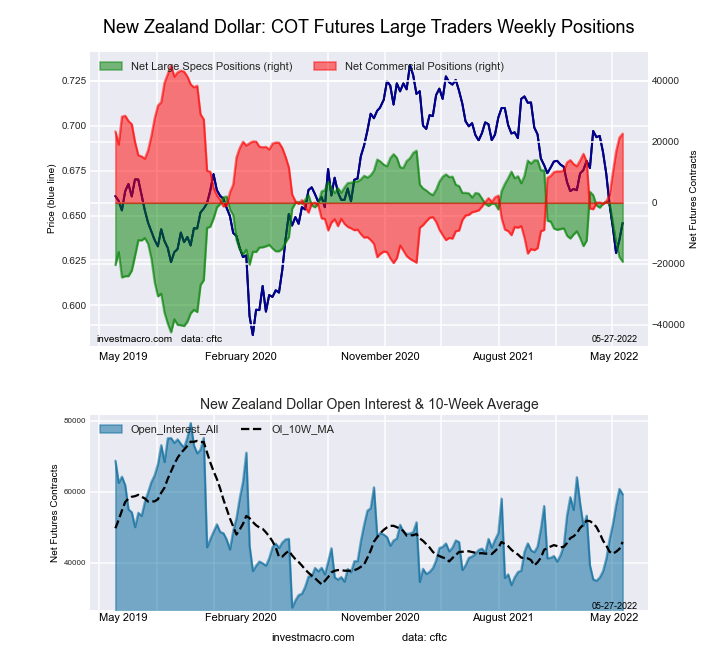 The New Zealand Dollar large speculator standing this week was a net position of -19,321 contracts in the data reported through Tuesday. This was a weekly fall of -1,554 contracts from the previous week which had a total of -17,767 net contracts.
This week’s current strength score (the trader positioning range over the past three years, measured from 0 to 100) shows the speculators are currently Bearish with a score of 38.8 percent. The commercials are Bullish with a score of 65.4 percent and the small traders (not shown in chart) are Bearish-Extreme with a score of 13.1 percent.
| NEW ZEALAND DOLLAR Statistics | SPECULATORS | COMMERCIALS | SMALL TRADERS |
| – Percent of Open Interest Longs: | 18.1 | 76.7 | 3.7 |
| – Percent of Open Interest Shorts: | 50.7 | 38.4 | 9.4 |
| – Net Position: | -19,321 | 22,703 | -3,382 |
| – Gross Longs: | 10,749 | 45,458 | 2,202 |
| – Gross Shorts: | 30,070 | 22,755 | 5,584 |
| – Long to Short Ratio: | 0.4 to 1 | 2.0 to 1 | 0.4 to 1 |
| NET POSITION TREND: | | | |
| – Strength Index Score (3 Year Range Pct): | 38.8 | 65.4 | 13.1 |
| – Strength Index Reading (3 Year Range): | Bearish | Bullish | Bearish-Extreme |
| NET POSITION MOVEMENT INDEX: | | | |
| – 6-Week Change in Strength Index: | -31.9 | 35.7 | -46.9 |
Mexican Peso Futures:
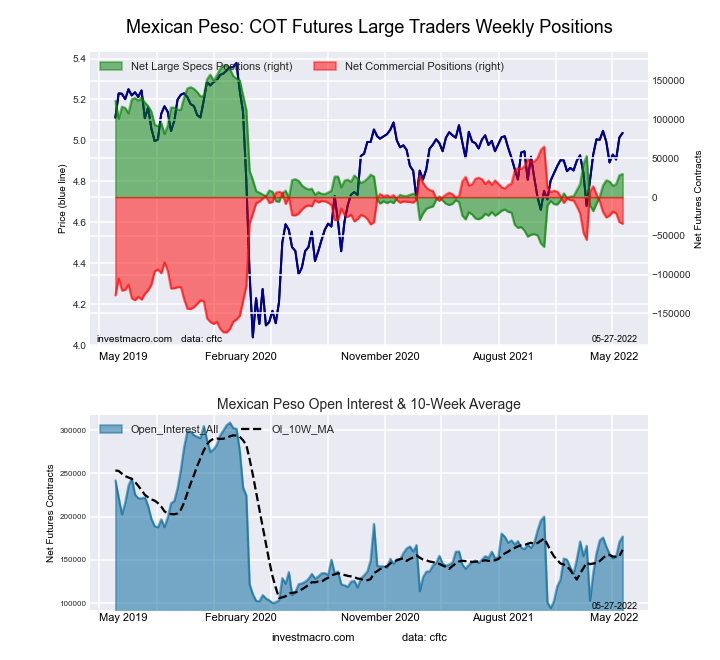 The Mexican Peso large speculator standing this week was a net position of 29,792 contracts in the data reported through Tuesday. This was a weekly advance of 1,577 contracts from the previous week which had a total of 28,215 net contracts.
This week’s current strength score (the trader positioning range over the past three years, measured from 0 to 100) shows the speculators are currently Bearish with a score of 40.1 percent. The commercials are Bullish with a score of 58.5 percent and the small traders (not shown in chart) are Bullish with a score of 62.4 percent.
| MEXICAN PESO Statistics | SPECULATORS | COMMERCIALS | SMALL TRADERS |
| – Percent of Open Interest Longs: | 46.9 | 47.7 | 4.3 |
| – Percent of Open Interest Shorts: | 30.1 | 67.1 | 1.7 |
| – Net Position: | 29,792 | -34,352 | 4,560 |
| – Gross Longs: | 83,031 | 84,474 | 7,605 |
| – Gross Shorts: | 53,239 | 118,826 | 3,045 |
| – Long to Short Ratio: | 1.6 to 1 | 0.7 to 1 | 2.5 to 1 |
| NET POSITION TREND: | | | |
| – Strength Index Score (3 Year Range Pct): | 40.1 | 58.5 | 62.4 |
| – Strength Index Reading (3 Year Range): | Bearish | Bullish | Bullish |
| NET POSITION MOVEMENT INDEX: | | | |
| – 6-Week Change in Strength Index: | 6.3 | -6.2 | -0.1 |
Brazilian Real Futures:
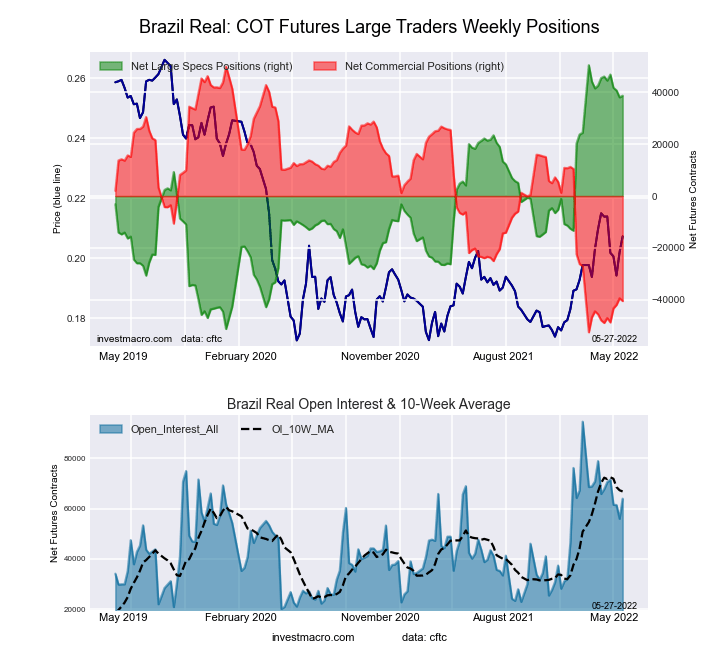 The Brazilian Real large speculator standing this week was a net position of 38,714 contracts in the data reported through Tuesday. This was a weekly advance of 619 contracts from the previous week which had a total of 38,095 net contracts.
This week’s current strength score (the trader positioning range over the past three years, measured from 0 to 100) shows the speculators are currently Bullish-Extreme with a score of 88.4 percent. The commercials are Bearish-Extreme with a score of 11.8 percent and the small traders (not shown in chart) are Bullish-Extreme with a score of 85.7 percent.
| BRAZIL REAL Statistics | SPECULATORS | COMMERCIALS | SMALL TRADERS |
| – Percent of Open Interest Longs: | 70.5 | 22.1 | 6.0 |
| – Percent of Open Interest Shorts: | 9.9 | 85.4 | 3.2 |
| – Net Position: | 38,714 | -40,501 | 1,787 |
| – Gross Longs: | 45,076 | 14,132 | 3,826 |
| – Gross Shorts: | 6,362 | 54,633 | 2,039 |
| – Long to Short Ratio: | 7.1 to 1 | 0.3 to 1 | 1.9 to 1 |
| NET POSITION TREND: | | | |
| – Strength Index Score (3 Year Range Pct): | 88.4 | 11.8 | 85.7 |
| – Strength Index Reading (3 Year Range): | Bullish-Extreme | Bearish-Extreme | Bullish-Extreme |
| NET POSITION MOVEMENT INDEX: | | | |
| – 6-Week Change in Strength Index: | -7.3 | 8.2 | -12.2 |
Bitcoin Futures:
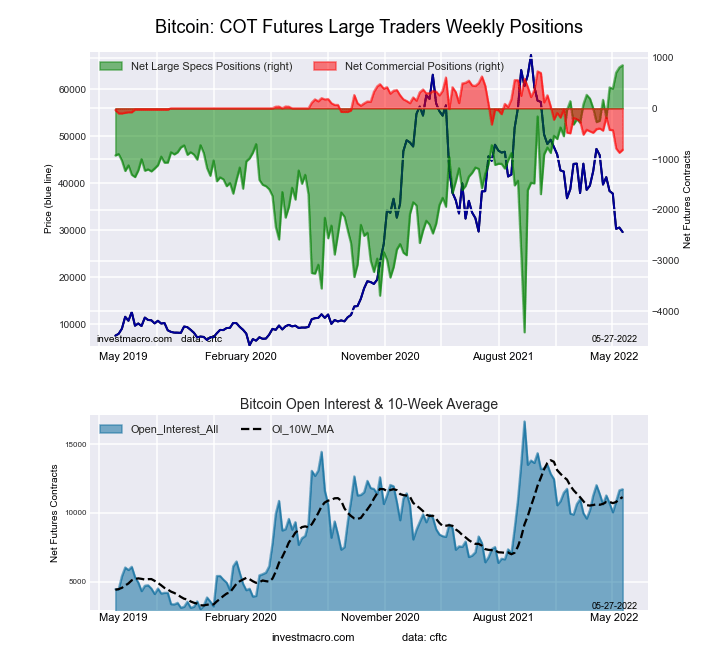 The Bitcoin large speculator standing this week was a net position of 849 contracts in the data reported through Tuesday. This was a weekly advance of 43 contracts from the previous week which had a total of 806 net contracts.
This week’s current strength score (the trader positioning range over the past three years, measured from 0 to 100) shows the speculators are currently Bullish-Extreme with a score of 100.0 percent. The commercials are Bearish-Extreme with a score of 3.6 percent and the small traders (not shown in chart) are Bearish-Extreme with a score of 12.2 percent.
| BITCOIN Statistics | SPECULATORS | COMMERCIALS | SMALL TRADERS |
| – Percent of Open Interest Longs: | 82.9 | 1.2 | 9.1 |
| – Percent of Open Interest Shorts: | 75.7 | 8.2 | 9.4 |
| – Net Position: | 849 | -817 | -32 |
| – Gross Longs: | 9,723 | 141 | 1,072 |
| – Gross Shorts: | 8,874 | 958 | 1,104 |
| – Long to Short Ratio: | 1.1 to 1 | 0.1 to 1 | 1.0 to 1 |
| NET POSITION TREND: | | | |
| – Strength Index Score (3 Year Range Pct): | 100.0 | 3.6 | 12.2 |
| – Strength Index Reading (3 Year Range): | Bullish-Extreme | Bearish-Extreme | Bearish-Extreme |
| NET POSITION MOVEMENT INDEX: | | | |
| – 6-Week Change in Strength Index: | 13.0 | -23.6 | -6.9 |
Article By InvestMacro – Receive our weekly COT Reports by Email
*COT Report: The COT data, released weekly to the public each Friday, is updated through the most recent Tuesday (data is 3 days old) and shows a quick view of how large speculators or non-commercials (for-profit traders) were positioned in the futures markets.
The CFTC categorizes trader positions according to commercial hedgers (traders who use futures contracts for hedging as part of the business), non-commercials (large traders who speculate to realize trading profits) and nonreportable traders (usually small traders/speculators) as well as their open interest (contracts open in the market at time of reporting).See CFTC criteria here.


