By InvestMacro | COT | Data Tables | COT Leaders | Downloads | COT Newsletter
Here are the latest charts and statistics for the Commitment of Traders (COT) data published by the Commodities Futures Trading Commission (CFTC).
The latest COT data is updated through Tuesday May 31st and shows a quick view of how large traders (for-profit speculators and commercial entities) were positioned in the futures markets. All currency positions are in direct relation to the US dollar where, for example, a bet for the euro is a bet that the euro will rise versus the dollar while a bet against the euro will be a bet that the euro will decline versus the dollar.
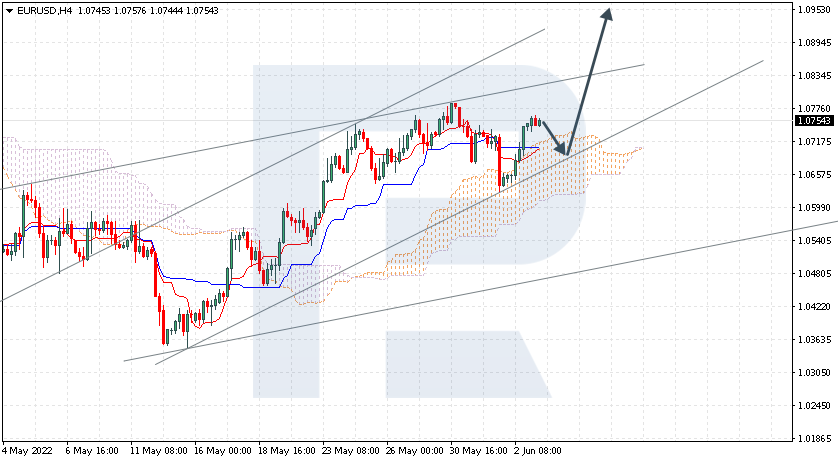
Highlighting the COT currency data was the further gains in bullish bets for the Euro currency futures contracts. Euro speculators boosted their bullish bets for a fourth straight week this week and for the sixth time in the past ten weeks. Over the past four-week time-frame, Euro bets have risen by a total of +58,650 contracts, going from -6,378 net positions on May 3rd to a total of +52,272 net positions this week. This week marks the highest Euro speculator standing in the past twelve weeks.
The recent improvement in Euro positions has taken place with a very strong change in sentiment as just four weeks ago the overall position had fallen into bearish territory. The Euro sentiment has been so bad that analysts have been making predictions for an inevitable decline of the Euro into parity versus the dollar. However, recently there has been rising expectations that the European Central Bank will be more hawkish towards interest rates in the near future (despite the weak outlook for EU GDP growth) and will end their negative interest rate policy.
Over the past few weeks, the EUR/USD exchange rate has rebounded after falling to a multi-year low of 1.0350 in early May. This week the EUR/USD hit a weekly high of 1.0787 before closing at the 1.0719 exchange rate.
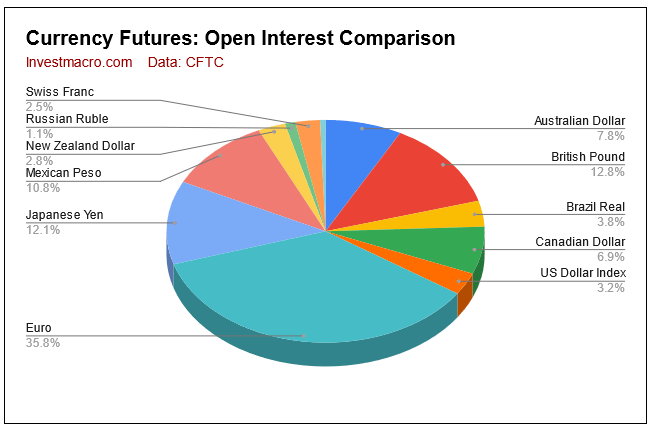
Overall, the currencies with higher speculator bets this week were the Euro (13,342 contracts), Brazil real (6,602 contracts), British pound sterling (6,267 contracts), Canadian dollar (5,680 contracts), Mexican peso (5,657 contracts), Japanese yen (5,005 contracts) and the New Zealand dollar (597 contracts).
The currencies with declining bets were the US Dollar Index (-501 contracts), Australian dollar (-3,236 contracts), Swiss franc (-785 contracts) and Bitcoin (-446 contracts).
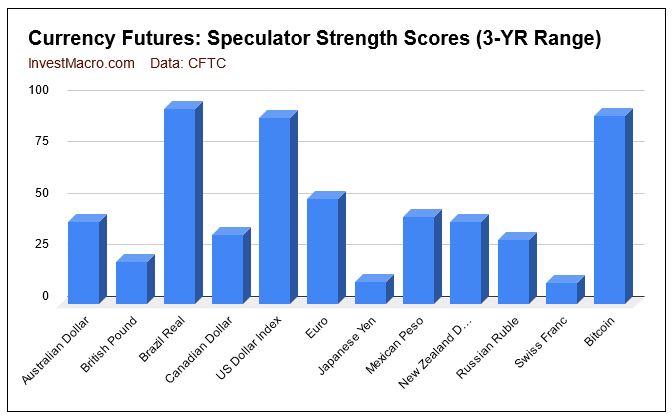 Strength scores (3-Year range of Speculator positions, from 0 to 100 where above 80 is extreme bullish and below 20 is extreme bearish) show that most of the currency markets are below their midpoint (50 percent) of the last 3 years. The Brazil Real, US Dollar Index and Bitcoin are currently in extreme bullish levels.
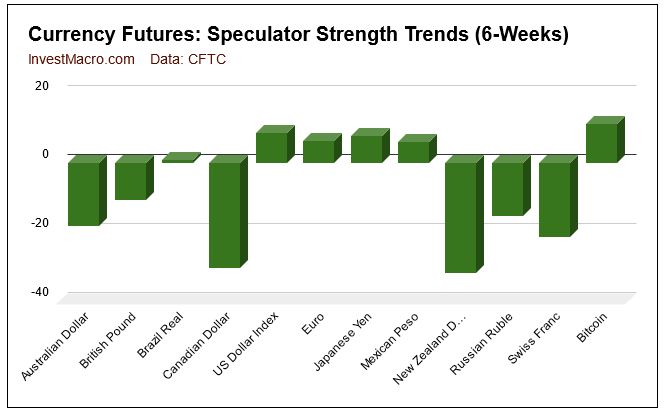 Strength score trends (or move index, that show 6-week changes in strength scores) shows the recent strong weakness in the commodity currencies (AUD, NZD and CAD) as well as the Swiss franc.
| May-31-2022 | OI | OI-Index | Spec-Net | Spec-Index | Com-Net | COM-Index | Smalls-Net | Smalls-Index |
|---|
| USD Index | 63,863 | 98 | 37,538 | 91 | -41,327 | 6 | 3,789 | 58 |
| EUR | 706,317 | 85 | 52,272 | 51 | -85,186 | 52 | 32,914 | 29 |
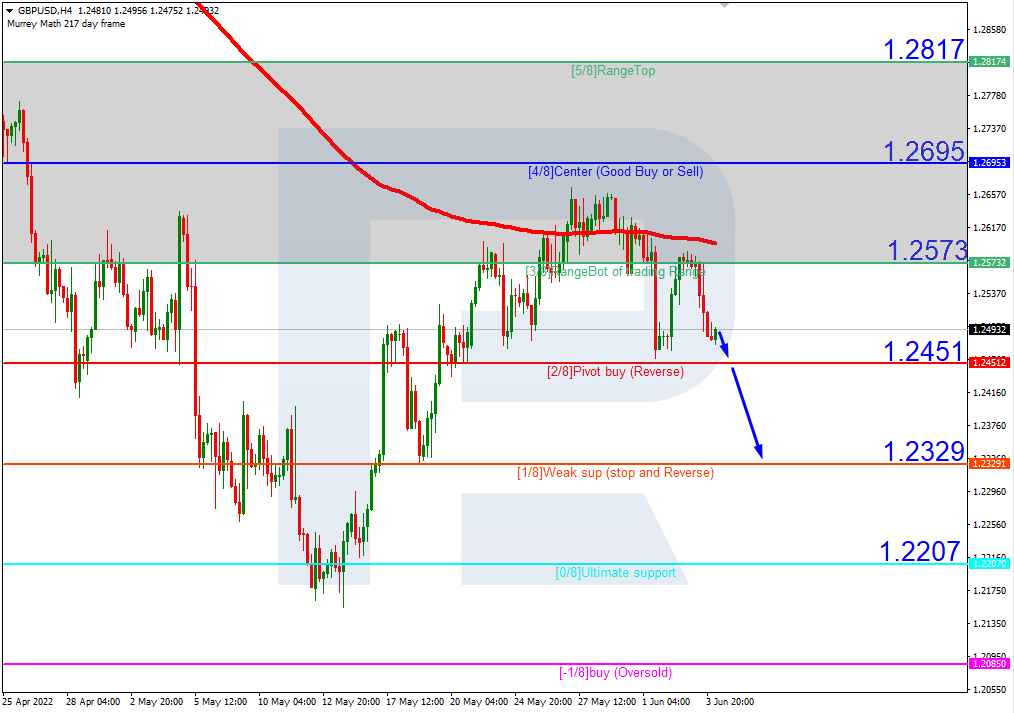
| GBP | 252,881 | 72 | -74,105 | 21 | 87,172 | 81 | -13,067 | 29 |
| JPY | 239,080 | 81 | -94,439 | 11 | 105,049 | 87 | -10,610 | 32 |
| CHF | 49,579 | 40 | -20,458 | 10 | 29,851 | 87 | -9,393 | 26 |
| CAD | 135,929 | 21 | -7,007 | 34 | -327 | 68 | 7,334 | 44 |
| AUD | 153,661 | 48 | -48,682 | 40 | 51,128 | 57 | -2,446 | 46 |
| NZD | 55,134 | 53 | -18,724 | 40 | 21,374 | 63 | -2,650 | 21 |
| MXN | 212,843 | 55 | 35,449 | 42 | -40,143 | 56 | 4,694 | 63 |
| RUB | 20,930 | 4 | 7,543 | 31 | -7,150 | 69 | -393 | 24 |
| BRL | 74,146 | 73 | 45,316 | 95 | -47,670 | 5 | 2,354 | 92 |
| Bitcoin | 10,900 | 58 | 403 | 92 | -503 | 0 | 100 | 15 |
US Dollar Index Futures:
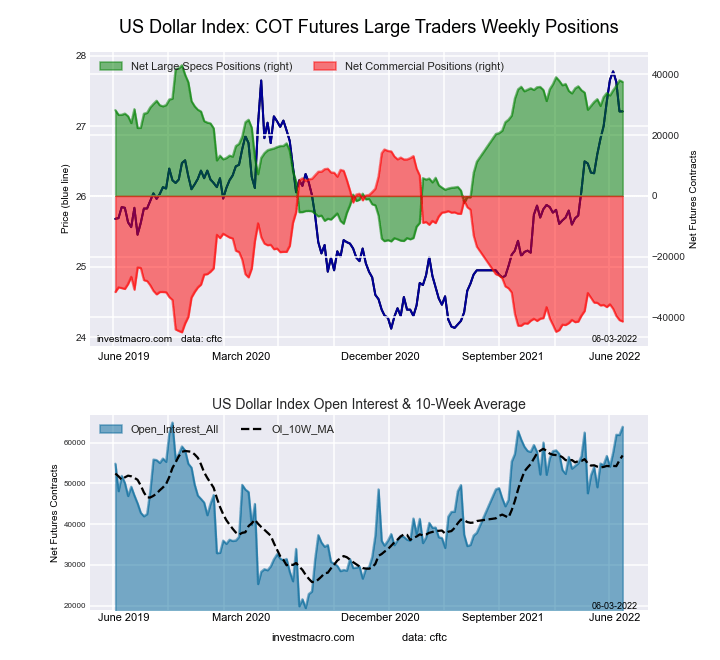 The US Dollar Index large speculator standing this week came in at a net position of 37,538 contracts in the data reported through Tuesday. This was a weekly decrease of -501 contracts from the previous week which had a total of 38,039 net contracts.
This week’s current strength score (the trader positioning range over the past three years, measured from 0 to 100) shows the speculators are currently Bullish-Extreme with a score of 90.5 percent. The commercials are Bearish-Extreme with a score of 5.9 percent and the small traders (not shown in chart) are Bullish with a score of 58.0 percent.
| US DOLLAR INDEX Statistics | SPECULATORS | COMMERCIALS | SMALL TRADERS |
| – Percent of Open Interest Longs: | 85.9 | 3.7 | 8.8 |
| – Percent of Open Interest Shorts: | 27.1 | 68.4 | 2.8 |
| – Net Position: | 37,538 | -41,327 | 3,789 |
| – Gross Longs: | 54,859 | 2,355 | 5,605 |
| – Gross Shorts: | 17,321 | 43,682 | 1,816 |
| – Long to Short Ratio: | 3.2 to 1 | 0.1 to 1 | 3.1 to 1 |
| NET POSITION TREND: | | | |
| – Strength Index Score (3 Year Range Pct): | 90.5 | 5.9 | 58.0 |
| – Strength Index Reading (3 Year Range): | Bullish-Extreme | Bearish-Extreme | Bullish |
| NET POSITION MOVEMENT INDEX: | | | |
| – 6-Week Change in Strength Index: | 8.6 | -9.0 | 5.2 |
Euro Currency Futures:
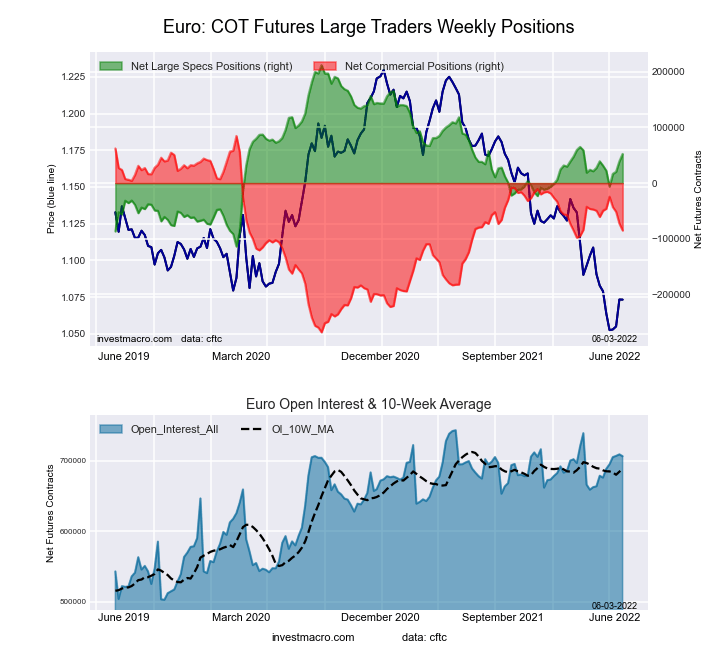 The Euro Currency large speculator standing this week came in at a net position of 52,272 contracts in the data reported through Tuesday. This was a weekly rise of 13,342 contracts from the previous week which had a total of 38,930 net contracts.
This week’s current strength score (the trader positioning range over the past three years, measured from 0 to 100) shows the speculators are currently Bullish with a score of 51.0 percent. The commercials are Bullish with a score of 51.9 percent and the small traders (not shown in chart) are Bearish with a score of 28.9 percent.
| EURO Currency Statistics | SPECULATORS | COMMERCIALS | SMALL TRADERS |
| – Percent of Open Interest Longs: | 33.5 | 51.7 | 12.3 |
| – Percent of Open Interest Shorts: | 26.1 | 63.8 | 7.7 |
| – Net Position: | 52,272 | -85,186 | 32,914 |
| – Gross Longs: | 236,553 | 365,434 | 87,138 |
| – Gross Shorts: | 184,281 | 450,620 | 54,224 |
| – Long to Short Ratio: | 1.3 to 1 | 0.8 to 1 | 1.6 to 1 |
| NET POSITION TREND: | | | |
| – Strength Index Score (3 Year Range Pct): | 51.0 | 51.9 | 28.9 |
| – Strength Index Reading (3 Year Range): | Bullish | Bullish | Bearish |
| NET POSITION MOVEMENT INDEX: | | | |
| – 6-Week Change in Strength Index: | 6.4 | -10.1 | 24.0 |
British Pound Sterling Futures:
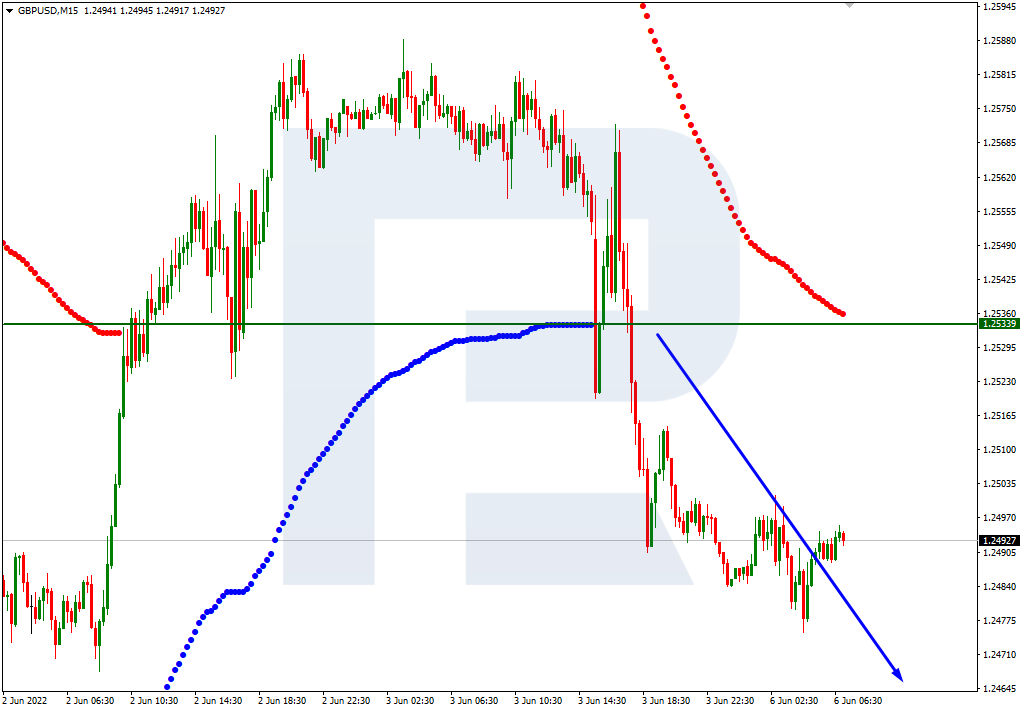
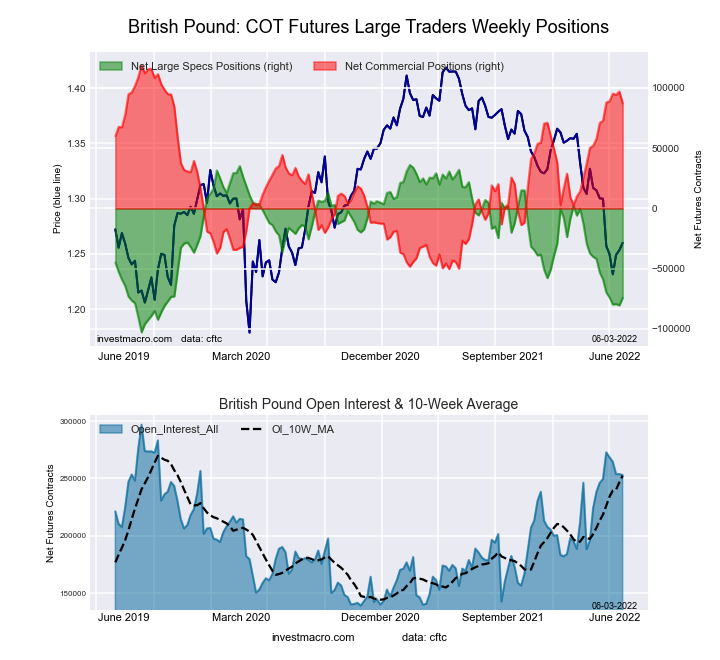 The British Pound Sterling large speculator standing this week came in at a net position of -74,105 contracts in the data reported through Tuesday. This was a weekly gain of 6,267 contracts from the previous week which had a total of -80,372 net contracts.
This week’s current strength score (the trader positioning range over the past three years, measured from 0 to 100) shows the speculators are currently Bearish with a score of 20.6 percent. The commercials are Bullish-Extreme with a score of 81.2 percent and the small traders (not shown in chart) are Bearish with a score of 28.6 percent.
| BRITISH POUND Statistics | SPECULATORS | COMMERCIALS | SMALL TRADERS |
| – Percent of Open Interest Longs: | 12.2 | 76.6 | 7.7 |
| – Percent of Open Interest Shorts: | 41.5 | 42.2 | 12.9 |
| – Net Position: | -74,105 | 87,172 | -13,067 |
| – Gross Longs: | 30,788 | 193,786 | 19,446 |
| – Gross Shorts: | 104,893 | 106,614 | 32,513 |
| – Long to Short Ratio: | 0.3 to 1 | 1.8 to 1 | 0.6 to 1 |
| NET POSITION TREND: | | | |
| – Strength Index Score (3 Year Range Pct): | 20.6 | 81.2 | 28.6 |
| – Strength Index Reading (3 Year Range): | Bearish | Bullish-Extreme | Bearish |
| NET POSITION MOVEMENT INDEX: | | | |
| – 6-Week Change in Strength Index: | -10.9 | 8.4 | 1.9 |
Japanese Yen Futures:
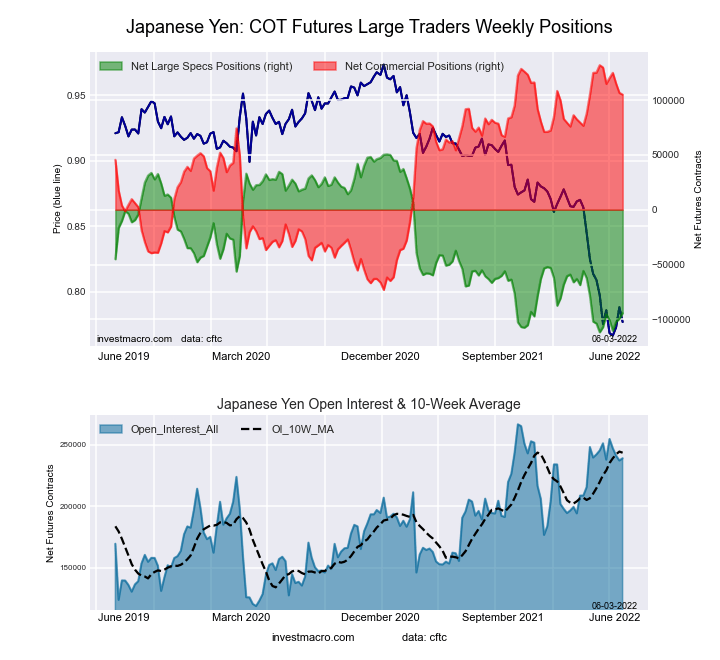 The Japanese Yen large speculator standing this week came in at a net position of -94,439 contracts in the data reported through Tuesday. This was a weekly increase of 5,005 contracts from the previous week which had a total of -99,444 net contracts.
This week’s current strength score (the trader positioning range over the past three years, measured from 0 to 100) shows the speculators are currently Bearish-Extreme with a score of 10.7 percent. The commercials are Bullish-Extreme with a score of 86.9 percent and the small traders (not shown in chart) are Bearish with a score of 31.9 percent.
| JAPANESE YEN Statistics | SPECULATORS | COMMERCIALS | SMALL TRADERS |
| – Percent of Open Interest Longs: | 6.4 | 82.2 | 9.5 |
| – Percent of Open Interest Shorts: | 45.9 | 38.3 | 13.9 |
| – Net Position: | -94,439 | 105,049 | -10,610 |
| – Gross Longs: | 15,201 | 196,584 | 22,605 |
| – Gross Shorts: | 109,640 | 91,535 | 33,215 |
| – Long to Short Ratio: | 0.1 to 1 | 2.1 to 1 | 0.7 to 1 |
| NET POSITION TREND: | | | |
| – Strength Index Score (3 Year Range Pct): | 10.7 | 86.9 | 31.9 |
| – Strength Index Reading (3 Year Range): | Bearish-Extreme | Bullish-Extreme | Bearish |
| NET POSITION MOVEMENT INDEX: | | | |
| – 6-Week Change in Strength Index: | 7.9 | -12.1 | 24.5 |
Swiss Franc Futures:
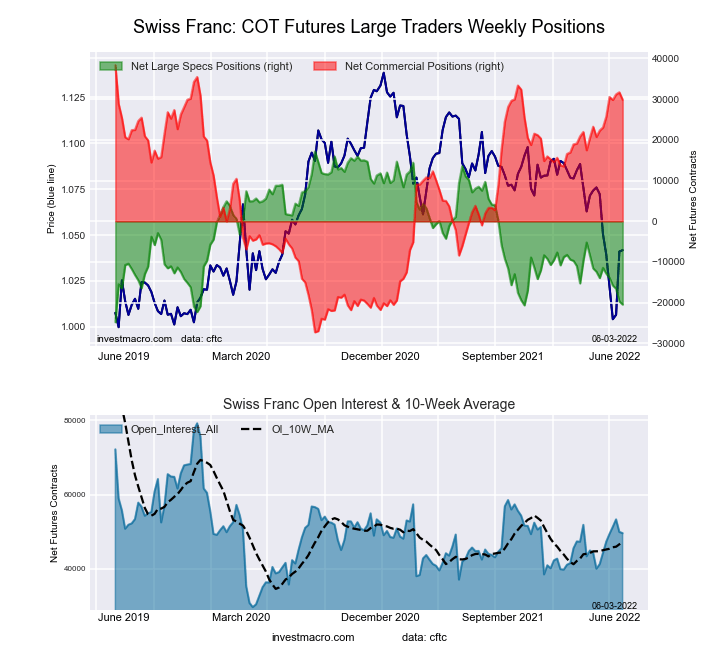 The Swiss Franc large speculator standing this week came in at a net position of -20,458 contracts in the data reported through Tuesday. This was a weekly lowering of -785 contracts from the previous week which had a total of -19,673 net contracts.
This week’s current strength score (the trader positioning range over the past three years, measured from 0 to 100) shows the speculators are currently Bearish-Extreme with a score of 10.3 percent. The commercials are Bullish-Extreme with a score of 87.0 percent and the small traders (not shown in chart) are Bearish with a score of 25.7 percent.
| SWISS FRANC Statistics | SPECULATORS | COMMERCIALS | SMALL TRADERS |
| – Percent of Open Interest Longs: | 5.3 | 75.6 | 17.3 |
| – Percent of Open Interest Shorts: | 46.6 | 15.4 | 36.3 |
| – Net Position: | -20,458 | 29,851 | -9,393 |
| – Gross Longs: | 2,641 | 37,473 | 8,596 |
| – Gross Shorts: | 23,099 | 7,622 | 17,989 |
| – Long to Short Ratio: | 0.1 to 1 | 4.9 to 1 | 0.5 to 1 |
| NET POSITION TREND: | | | |
| – Strength Index Score (3 Year Range Pct): | 10.3 | 87.0 | 25.7 |
| – Strength Index Reading (3 Year Range): | Bearish-Extreme | Bullish-Extreme | Bearish |
| NET POSITION MOVEMENT INDEX: | | | |
| – 6-Week Change in Strength Index: | -21.5 | 10.4 | 7.5 |
Canadian Dollar Futures:
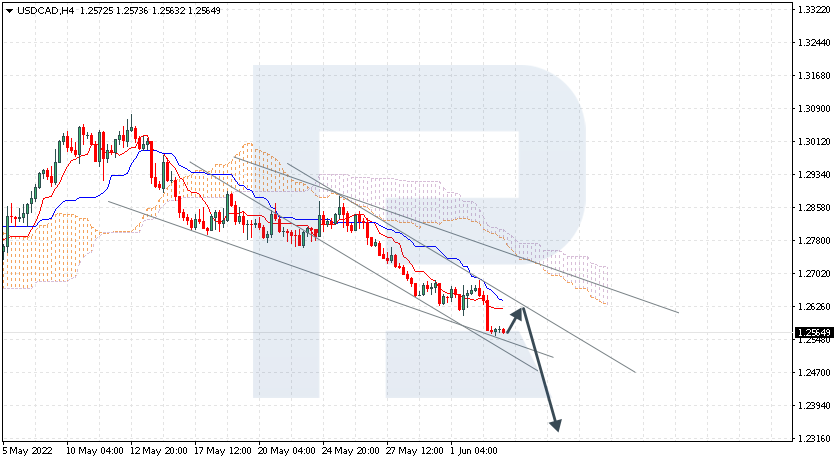
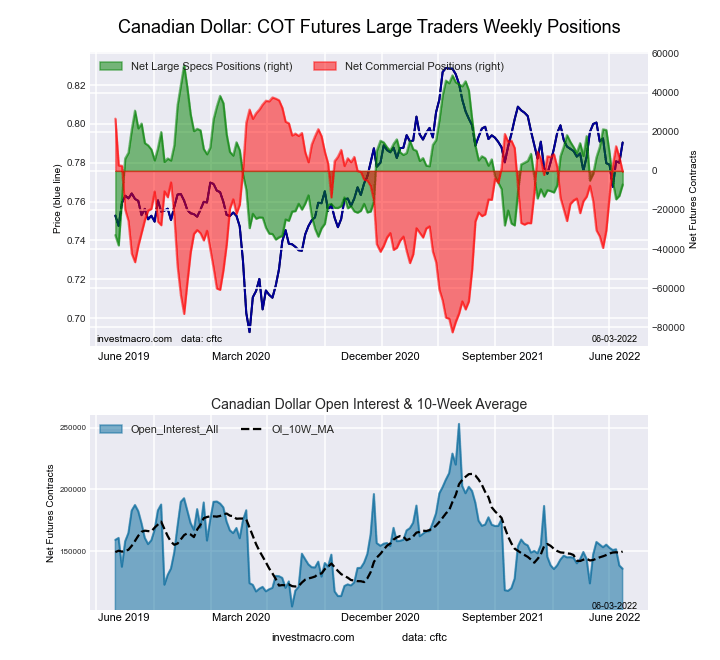 The Canadian Dollar large speculator standing this week came in at a net position of -7,007 contracts in the data reported through Tuesday. This was a weekly boost of 5,680 contracts from the previous week which had a total of -12,687 net contracts.
This week’s current strength score (the trader positioning range over the past three years, measured from 0 to 100) shows the speculators are currently Bearish with a score of 33.7 percent. The commercials are Bullish with a score of 68.5 percent and the small traders (not shown in chart) are Bearish with a score of 44.4 percent.
| CANADIAN DOLLAR Statistics | SPECULATORS | COMMERCIALS | SMALL TRADERS |
| – Percent of Open Interest Longs: | 22.5 | 51.5 | 24.0 |
| – Percent of Open Interest Shorts: | 27.6 | 51.7 | 18.6 |
| – Net Position: | -7,007 | -327 | 7,334 |
| – Gross Longs: | 30,520 | 70,006 | 32,660 |
| – Gross Shorts: | 37,527 | 70,333 | 25,326 |
| – Long to Short Ratio: | 0.8 to 1 | 1.0 to 1 | 1.3 to 1 |
| NET POSITION TREND: | | | |
| – Strength Index Score (3 Year Range Pct): | 33.7 | 68.5 | 44.4 |
| – Strength Index Reading (3 Year Range): | Bearish | Bullish | Bearish |
| NET POSITION MOVEMENT INDEX: | | | |
| – 6-Week Change in Strength Index: | -30.7 | 32.5 | -21.5 |
Australian Dollar Futures:
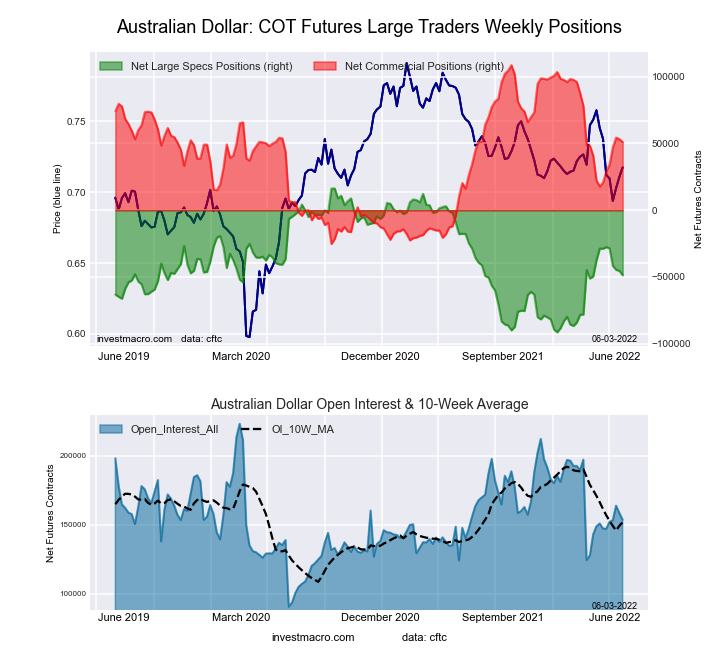 The Australian Dollar large speculator standing this week came in at a net position of -48,682 contracts in the data reported through Tuesday. This was a weekly decline of -3,236 contracts from the previous week which had a total of -45,446 net contracts.
This week’s current strength score (the trader positioning range over the past three years, measured from 0 to 100) shows the speculators are currently Bearish with a score of 39.7 percent. The commercials are Bullish with a score of 57.0 percent and the small traders (not shown in chart) are Bearish with a score of 46.5 percent.
| AUSTRALIAN DOLLAR Statistics | SPECULATORS | COMMERCIALS | SMALL TRADERS |
| – Percent of Open Interest Longs: | 21.4 | 63.1 | 12.8 |
| – Percent of Open Interest Shorts: | 53.1 | 29.9 | 14.4 |
| – Net Position: | -48,682 | 51,128 | -2,446 |
| – Gross Longs: | 32,897 | 97,031 | 19,659 |
| – Gross Shorts: | 81,579 | 45,903 | 22,105 |
| – Long to Short Ratio: | 0.4 to 1 | 2.1 to 1 | 0.9 to 1 |
| NET POSITION TREND: | | | |
| – Strength Index Score (3 Year Range Pct): | 39.7 | 57.0 | 46.5 |
| – Strength Index Reading (3 Year Range): | Bearish | Bullish | Bearish |
| NET POSITION MOVEMENT INDEX: | | | |
| – 6-Week Change in Strength Index: | -18.4 | 22.6 | -25.6 |
New Zealand Dollar Futures:
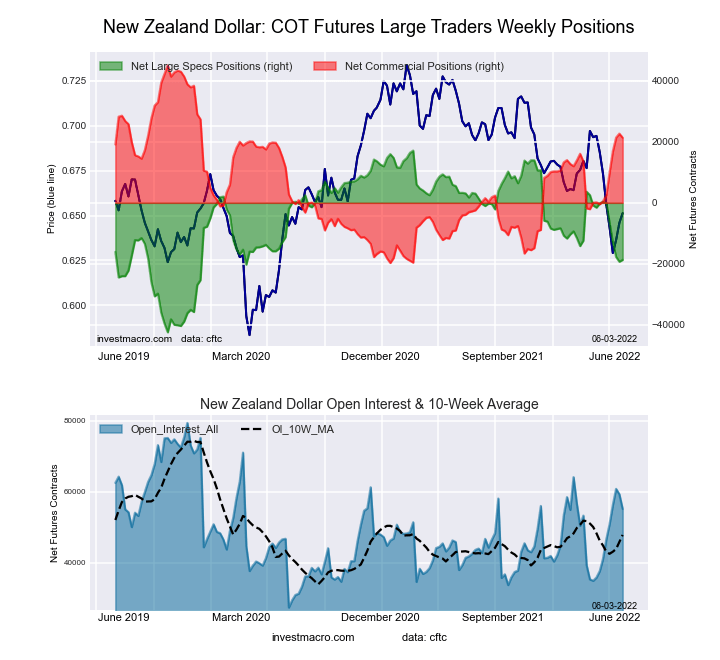 The New Zealand Dollar large speculator standing this week came in at a net position of -18,724 contracts in the data reported through Tuesday. This was a weekly boost of 597 contracts from the previous week which had a total of -19,321 net contracts.
This week’s current strength score (the trader positioning range over the past three years, measured from 0 to 100) shows the speculators are currently Bearish with a score of 39.8 percent. The commercials are Bullish with a score of 63.3 percent and the small traders (not shown in chart) are Bearish with a score of 21.5 percent.
| NEW ZEALAND DOLLAR Statistics | SPECULATORS | COMMERCIALS | SMALL TRADERS |
| – Percent of Open Interest Longs: | 16.6 | 76.2 | 5.0 |
| – Percent of Open Interest Shorts: | 50.6 | 37.4 | 9.8 |
| – Net Position: | -18,724 | 21,374 | -2,650 |
| – Gross Longs: | 9,179 | 42,010 | 2,762 |
| – Gross Shorts: | 27,903 | 20,636 | 5,412 |
| – Long to Short Ratio: | 0.3 to 1 | 2.0 to 1 | 0.5 to 1 |
| NET POSITION TREND: | | | |
| – Strength Index Score (3 Year Range Pct): | 39.8 | 63.3 | 21.5 |
| – Strength Index Reading (3 Year Range): | Bearish | Bullish | Bearish |
| NET POSITION MOVEMENT INDEX: | | | |
| – 6-Week Change in Strength Index: | -32.0 | 32.2 | -20.4 |
Mexican Peso Futures:
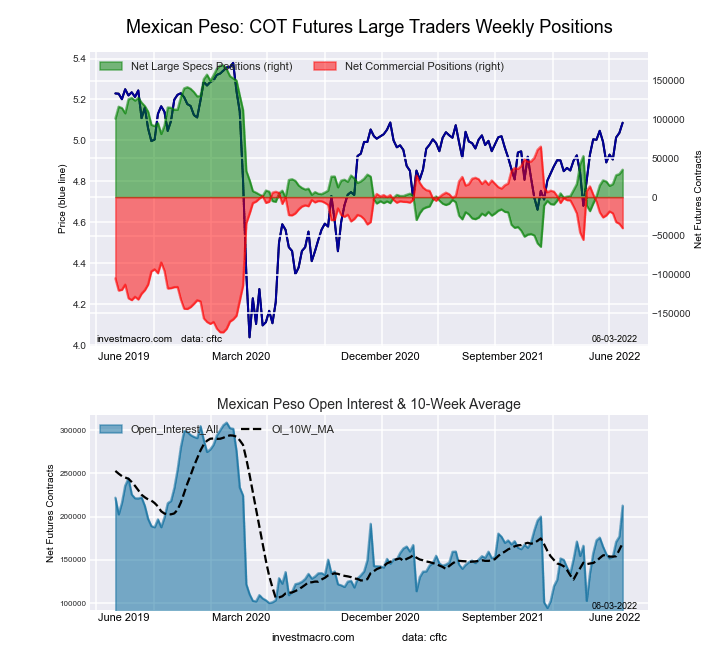 The Mexican Peso large speculator standing this week came in at a net position of 35,449 contracts in the data reported through Tuesday. This was a weekly rise of 5,657 contracts from the previous week which had a total of 29,792 net contracts.
This week’s current strength score (the trader positioning range over the past three years, measured from 0 to 100) shows the speculators are currently Bearish with a score of 42.5 percent. The commercials are Bullish with a score of 56.1 percent and the small traders (not shown in chart) are Bullish with a score of 62.9 percent.
| MEXICAN PESO Statistics | SPECULATORS | COMMERCIALS | SMALL TRADERS |
| – Percent of Open Interest Longs: | 53.8 | 41.8 | 3.5 |
| – Percent of Open Interest Shorts: | 37.1 | 60.6 | 1.3 |
| – Net Position: | 35,449 | -40,143 | 4,694 |
| – Gross Longs: | 114,480 | 88,894 | 7,396 |
| – Gross Shorts: | 79,031 | 129,037 | 2,702 |
| – Long to Short Ratio: | 1.4 to 1 | 0.7 to 1 | 2.7 to 1 |
| NET POSITION TREND: | | | |
| – Strength Index Score (3 Year Range Pct): | 42.5 | 56.1 | 62.9 |
| – Strength Index Reading (3 Year Range): | Bearish | Bullish | Bullish |
| NET POSITION MOVEMENT INDEX: | | | |
| – 6-Week Change in Strength Index: | 5.9 | -5.8 | 0.6 |
Brazilian Real Futures:
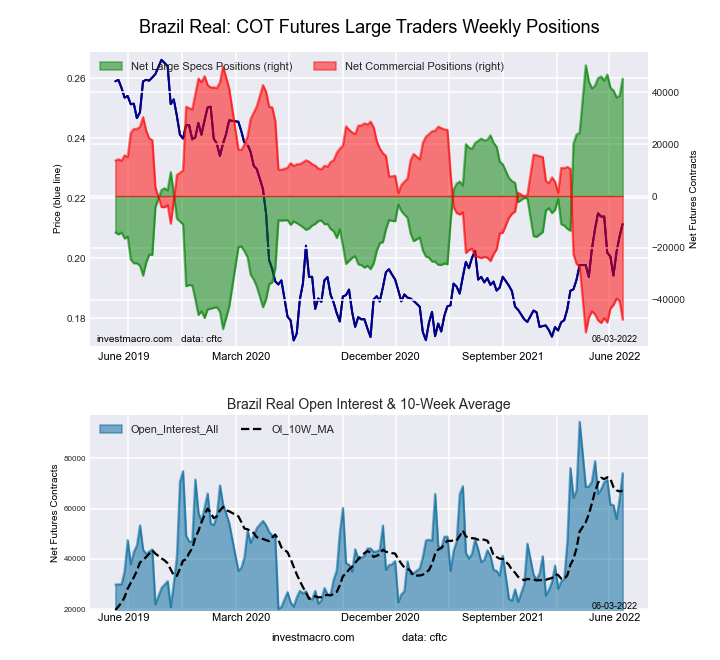 The Brazilian Real large speculator standing this week came in at a net position of 45,316 contracts in the data reported through Tuesday. This was a weekly gain of 6,602 contracts from the previous week which had a total of 38,714 net contracts.
This week’s current strength score (the trader positioning range over the past three years, measured from 0 to 100) shows the speculators are currently Bullish-Extreme with a score of 94.9 percent. The commercials are Bearish-Extreme with a score of 4.8 percent and the small traders (not shown in chart) are Bullish-Extreme with a score of 92.3 percent.
| BRAZIL REAL Statistics | SPECULATORS | COMMERCIALS | SMALL TRADERS |
| – Percent of Open Interest Longs: | 71.3 | 22.4 | 5.9 |
| – Percent of Open Interest Shorts: | 10.2 | 86.7 | 2.7 |
| – Net Position: | 45,316 | -47,670 | 2,354 |
| – Gross Longs: | 52,896 | 16,595 | 4,372 |
| – Gross Shorts: | 7,580 | 64,265 | 2,018 |
| – Long to Short Ratio: | 7.0 to 1 | 0.3 to 1 | 2.2 to 1 |
| NET POSITION TREND: | | | |
| – Strength Index Score (3 Year Range Pct): | 94.9 | 4.8 | 92.3 |
| – Strength Index Reading (3 Year Range): | Bullish-Extreme | Bearish-Extreme | Bullish-Extreme |
| NET POSITION MOVEMENT INDEX: | | | |
| – 6-Week Change in Strength Index: | 0.7 | -0.6 | -1.6 |
Bitcoin Futures:
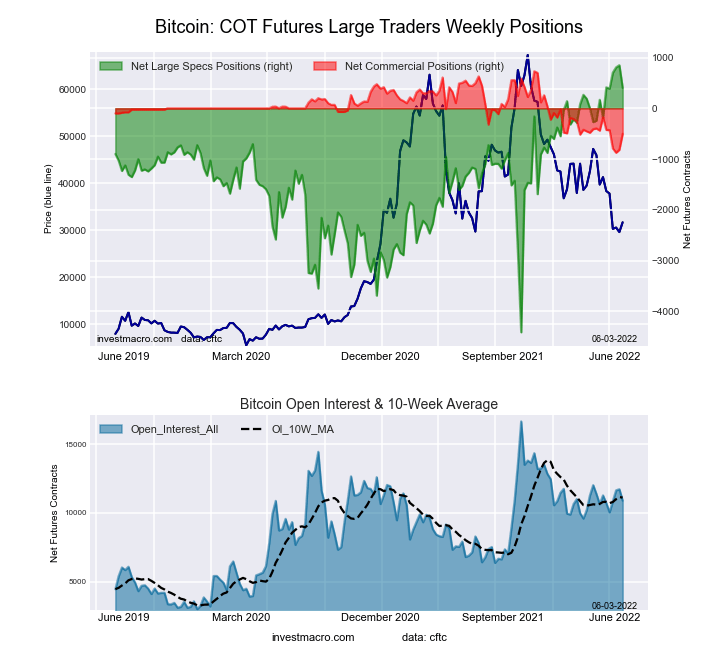 The Bitcoin large speculator standing this week came in at a net position of 403 contracts in the data reported through Tuesday. This was a weekly decline of -446 contracts from the previous week which had a total of 849 net contracts.
This week’s current strength score (the trader positioning range over the past three years, measured from 0 to 100) shows the speculators are currently Bullish-Extreme with a score of 91.5 percent. The commercials are Bearish with a score of 23.2 percent and the small traders (not shown in chart) are Bearish-Extreme with a score of 15.2 percent.
| BITCOIN Statistics | SPECULATORS | COMMERCIALS | SMALL TRADERS |
| – Percent of Open Interest Longs: | 79.6 | 1.5 | 9.5 |
| – Percent of Open Interest Shorts: | 75.9 | 6.1 | 8.6 |
| – Net Position: | 403 | -503 | 100 |
| – Gross Longs: | 8,680 | 159 | 1,033 |
| – Gross Shorts: | 8,277 | 662 | 933 |
| – Long to Short Ratio: | 1.0 to 1 | 0.2 to 1 | 1.1 to 1 |
| NET POSITION TREND: | | | |
| – Strength Index Score (3 Year Range Pct): | 91.5 | 23.2 | 15.2 |
| – Strength Index Reading (3 Year Range): | Bullish-Extreme | Bearish | Bearish-Extreme |
| NET POSITION MOVEMENT INDEX: | | | |
| – 6-Week Change in Strength Index: | 11.3 | -20.4 | -6.1 |
Article By InvestMacro – Receive our weekly COT Reports by Email
*COT Report: The COT data, released weekly to the public each Friday, is updated through the most recent Tuesday (data is 3 days old) and shows a quick view of how large speculators or non-commercials (for-profit traders) were positioned in the futures markets.
The CFTC categorizes trader positions according to commercial hedgers (traders who use futures contracts for hedging as part of the business), non-commercials (large traders who speculate to realize trading profits) and nonreportable traders (usually small traders/speculators) as well as their open interest (contracts open in the market at time of reporting).See CFTC criteria here.


