Archive for Forex and Currency News – Page 126

The Analytical Overview of the Main Currency Pairs on 2022.06.29

By JustForex

The EUR/USD currency pair

Technical indicators of the currency pair:
  • Prev Open: 1.0582
  • Prev Close: 1.0520
  • % chg. over the last day: -0.59%

ECB head Christine Lagarde said nothing new in her speech at the Central Banks Forum. The net asset purchases will be completed on July 1. The ECB intends to raise interest rates in July for the first time in 11 years. The ECB will continue on the path of normalization and go as far as necessary to ensure inflation stabilizes at 2% in the medium term. Inflation in the Eurozone is projected to remain high for some time.

Trading recommendations
  • Support levels: 1.0498, 1.0573, 1.0408, 1.0379
  • Resistance levels: 1.0564, 1.0611, 1.0680, 1.0723

From the technical point of view, the trend on the EUR/USD currency pair on the hourly time frame is bearish. The price still forms a wide corridor, the MACD indicator has become negative, and new sellers’ initiative has appeared. Under such market conditions, sell deals can be considered from the resistance level of 1.0564, but only after the additional confirmation. Buy trades are best to look for on intraday time frames from the support level of 1.0498 or the lower border of the flat, but only with confirmation and short targets.

Alternative scenario: if the price breaks out through the 1.0611 resistance level and fixes above, the uptrend will likely resume.

EUR/USD
News feed for 2022.06.29:
  • – Eurozone Spanish Consumer Price Index (m/m) at 10:00 (GMT+3);
  • – US FOMC Member Mester Speaks (m/m) at 13:30 (GMT+3);
  • – Eurozone German Consumer Price Index (m/m) at 15:00 (GMT+3);
  • – US GDP (q/q) at 15:30 (GMT+3);
  • – US Fed Chair Powell Speaks (m/m) at 16:00 (GMT+3);
  • – Eurozone ECB President Lagarde Speaks (m/m) at 16:00 (GMT+3);
  • – US FOMC Bullard Speaks (m/m) at 20:05 (GMT+3).

The GBP/USD currency pair

Technical indicators of the currency pair:
  • Prev Open: 1.2264
  • Prev Close: 1.2183
  • % chg. over the last day: -0.66%

The Bank of England predicts that the UK economy will be negative in 2023, and KPMG predicts that the UK could fall into recession next year due to lower inflation. The Office for National Statistics reports that the average annual growth rate for the UK economy from 1998 to 2007 was 2.7%. From 2010 to 2019, it was 2%. The growth rate is projected to average up to 1.8% from 2023 to 2026. After the UK voted to leave the EU, there was a huge drop in investment, significantly affecting the pandemic recovery factor.

Trading recommendations
  • Support levels: 1.2171, 1.2093, 1.1974
  • Resistance levels: 1.2238, 1.2324, 1.2422, 1.2470, 1.2523, 1.2629

From the technical point of view, the trend on the GBP/USD currency pair on the hourly time frame is bearish. The situation is very similar to the euro. The price forms a wide corridor, while the MACD indicator does not show any activity, and there is a slight sellers’ pressure. Under such market conditions, sell deals can be considered from the resistance level of 1.2238 or the upper border of the flat at 1.2324, but only after the additional confirmation. Buy trades are best to look for on intraday time frames from the support level of 1.2171, but only with confirmation and short targets.

Alternative scenario: if the price breaks out through the 1.2422 resistance level and fixes above, the uptrend will likely resume.

GBP/USD
News feed for 2022.06.29:
  • – UK BoE Gov Bailey Speaks (m/m) at 16:00 (GMT+3).

The USD/JPY currency pair

Technical indicators of the currency pair:
  • Prev Open: 135.43
  • Prev Close: 136.16
  • % chg. over the last day: +0.54%

The fundamental picture of the currency pair USD/JPY remains the same. The divergent policies of the central banks have already caused the yen to fall to 20-year highs against the dollar. And since no changes are expected soon, analysts expect the growth of USD/JPY quotes to continue. The only thing that can reverse the uptrend is a currency intervention by the Bank of Japan. There are already talks about it.

Trading recommendations
  • Support levels: 135.41, 134.84, 133.35, 131.67, 131.00, 130.12, 129.48, 128.76
  • Resistance levels: 136.66

The medium-term trend on the USD/JPY currency pair is bullish. There is a new initiative from the buyers. The MACD indicator has become positive. Under such market conditions, buy trades can be considered from the support level of 135.41, but with confirmation. A resistance level of 136.66 is good for sell deals, but only with additional confirmation and short targets.

Alternative scenario: if the price fixes below 133.35, the downtrend will likely resume.

USD/JPY
News feed for 2022.06.29:
  • – Japan Retail Sales (m/m) at 02:50 (GMT+3).

The USD/CAD currency pair

Technical indicators of the currency pair:
  • Prev Open: 1.2873
  • Prev Close: 1.2876
  • % chg. over the last day: +0.02%

The Canadian dollar is a commodity currency, so it depends not only on the USD Index dynamics but also on the oil quotes. Both the dollar index and oil quotes increased yesterday. As a result, the price of USD/CAD started to form a corridor. It should be noted that both the Bank of Canada and the US Fed are on the way to raising the interest rates while oil prices remain high. All this suggests that no medium-term trends should be expected on the USD/CAD currency pair, as market conditions favor the strengthening of both the dollar index and the Canadian dollar.

Trading recommendations
  • Support levels: 1.2818, 1.2709, 1.2618, 1.2578, 1.2510
  • Resistance levels: 1.2887, 1.2956, 1.3068

In terms of technical analysis, the trend on the USD/CAD currency pair is bullish. But the MACD indicator became negative, and the price is trading below the moving averages. Yesterday the price reached the priority change level, but the buyers could protect their positions. Under such market conditions, it is better to look for buy deals in the lower time frames from the support level of 1.2818, but with confirmation. For sell deals, it is better to consider the resistance level of 1.2956, but it is also better with confirmation and short targets.

Alternative scenario: if the price breaks through and consolidates below the 1.2818 support level, the downtrend will likely resume.

USD/CAD
There is no news feed for today.

By JustForex


This article reflects a personal opinion and should not be interpreted as an investment advice, and/or offer, and/or a persistent request for carrying out financial transactions, and/or a guarantee, and/or a forecast of future events.

Murrey Math Lines 28.06.2022 (AUDUSD, NZDUSD)

Article By RoboForex.com

AUDUSD, “Australian Dollar vs US Dollar”

As we can see in the H4 chart, AUDUSD is trading below the 200-day Moving Average to indicate a descending tendency. In this case, the price is expected to test 1/8, break it, and then continue falling to reach the support at 0/8. However, this scenario may no longer be valid if the price breaks the resistance at 2/8 to the upside. After that, the instrument may reverse and resume growing towards 3/8.

AUDUSDH4
Risk Warning: the result of previous trading operations do not guarantee the same results in the future

In the M15 chart, the pair may break the downside line of the VoltyChannel indicator and, as a result, continue moving downwards.

AUDUSD_M15
Risk Warning: the result of previous trading operations do not guarantee the same results in the future

NZDUSD, “New Zealand Dollar vs US Dollar”

As we can see in the H4 chart, NZDUSD is also trading below the 200-day Moving Average, thus indicating a possible descending tendency. In this case, the price is expected to break 3/8 and then continue moving downwards to reach the support at 1/8. However, this scenario may no longer be valid if the price breaks the resistance at 4/8 to the upside. After that, the instrument may reverse and grow towards 5/8.

NZDUSD_H4
Risk Warning: the result of previous trading operations do not guarantee the same results in the future

In the M15 chart, the pair may break the downside line of the VoltyChannel indicator and, as a result, continue its decline.

NZDUSD_M15

Article By RoboForex.com

Attention!
Forecasts presented in this section only reflect the author’s private opinion and should not be considered as guidance for trading. RoboForex LP bears no responsibility for trading results based on trading recommendations described in these analytical reviews.

Forex Technical Analysis & Forecast 28.06.2022

Article By RoboForex.com

EURUSD, “Euro vs US Dollar”

After completing the ascending wave at 1.0614, EURUSD is correcting down to 1.0555. Later, the market may trade upwards to reach 1.0629 and then resume falling with the target at 1.0440.

EURUSD
Risk Warning: the result of previous trading operations do not guarantee the same results in the future

GBPUSD, “Great Britain Pound vs US Dollar”

GBPUSD has finished the ascending wave at 1.2330 along with the correction down to 1.2240; right now, it is forming a new consolidation range above the latter level. Today, the pair may grow towards 1.2400 and then trade downwards to return to 1.2250. After that, the instrument may start another growth with the target at 1.2420.

GBPUSD
Risk Warning: the result of previous trading operations do not guarantee the same results in the future

USDJPY, “US Dollar vs Japanese Yen”

USDJPY has completed the correctional wave at 135.55 and may later start another decline towards 134.90, thus forming a new consolidation range between these two levels. If the price breaks this range to the upside, the market may form one more ascending structure to reach 136.70; if to the downside – resume falling with the target at 134.18.

USDJPY
Risk Warning: the result of previous trading operations do not guarantee the same results in the future

USDCHF, “US Dollar vs Swiss Franc”

Having finished the ascending wave at 0.9619, USDCHF is expected to correct down to 0.9545 and may later resume growing to reach 0.9633. After that, the instrument may form a new descending structure towards 0.9577 and then start another growth with the target at 0.9700.

USDCHF
Risk Warning: the result of previous trading operations do not guarantee the same results in the future

AUDUSD, “Australian Dollar vs US Dollar”

AUDUSD is still consolidating around 0.6915. Possibly, the pair may grow to reach 0.6962 and then resume trading downwards with the target at 0.6863.

AUDUSD
Risk Warning: the result of previous trading operations do not guarantee the same results in the future

BRENT

Having broken 113.00 to the upside, Brent continues growing towards 115.60 and may later correct to return to 113.00. After that, the instrument may form one more ascending wave with the target at 117.20 or even extend this structure up to 122.50.

BRENT
Risk Warning: the result of previous trading operations do not guarantee the same results in the future

XAUUSD, “Gold vs US Dollar”

Gold is still consolidating around 1831.00; right now, it is forming a new descending structure towards 1815.00. Later, the market may start a new growth with the target at 1831.00 and then resume trading downwards to reach 1791.00.

GOLD
Risk Warning: the result of previous trading operations do not guarantee the same results in the future

S&P 500

After breaking 3830.0 to the upside, the S&P index continues growing towards 3950.0. Later, the market may reach 4014.0 and then resume trading downwards with the short-term target 3617.0.

S&P 500

Article By RoboForex.com

Attention!
Forecasts presented in this section only reflect the author’s private opinion and should not be considered as guidance for trading. RoboForex LP bears no responsibility for trading results based on trading recommendations described in these analytical reviews.

The Analytical Overview of the Main Currency Pairs on 2022.06.28

By JustForex

The EUR/USD currency pair

Technical indicators of the currency pair:
  • Prev Open: 1.0546
  • Prev Close: 1.0581
  • % chg. over the last day: +0.33%

Durable Goods Orders in the US unexpectedly rose by 0.7% in May, while analysts had expected no change. At the same time, the US pending home sales overcame a six-month slump and showed a slight gain. As softening inflation expectations prompted a reassessment of the prospects for aggressive interest rate hikes, the dollar index declined, allowing the euro to rise slightly. Futures pricing indicates that traders now expect the US Federal Reserve’s benchmark interest rate to stabilize at around 3.5% (the previous forecast was 4% in 2023).

Trading recommendations
  • Support levels: 1.0573, 1.0408, 1.0379
  • Resistance levels: 1.0611, 1.0680, 1.0723

From the technical point of view, the trend on the EUR/USD currency pair on the hourly time frame is bearish. The price still forms a wide corridor, and the MACD indicator has become inactive, but there is divergence towards sales. Under such market conditions, sell deals can be considered from the resistance level of 1.0611, but only after the additional confirmation. A price move above 1.0611 will change the priority. Buy trades are best to look for on intraday time frames from the support level of 1.0573 or the lower border of the flat, but only with confirmation and short targets.

Alternative scenario: if the price breaks out through the 1.0611 resistance level and fixes above, the uptrend will likely resume.

EUR/USD
News feed for 2022.06.28:
  • – US FOMC Member Williams Speaks (m/m) at 01:30 (GMT+3);
  • – ECB President Lagarde Speaks at 11:00 (GMT+3);
  • – US CB Consumer Confidence (m/m) at 17:00 (GMT+3).

The GBP/USD currency pair

Technical indicators of the currency pair:
  • Prev Open: 1.2263
  • Prev Close: 1.2266
  • % chg. over the last day: +0.02%

UK household inflation expectations decreased to their lowest level since January, which is good news for Bank of England officials who fear increased price pressures. Despite that, inflation expectations are still elevated. Financial markets show a roughly 73% chance that the Bank of England will raise the bank rate to 1.75% from 1.25% at the next policy meeting on August 4.

Trading recommendations
  • Support levels: 1.2238, 1.2093, 1.1974
  • Resistance levels: 1.2324, 1.2422, 1.2470, 1.2523, 1.2629

From the technical point of view, the trend on the GBP/USD currency pair on the hourly time frame is bearish. The situation is very similar to the euro. The price forms a wide corridor, while the MACD indicator shows no activity, but there is a slight divergence. Under such market conditions, sell deals can be considered from the resistance level of 1.2422 or the upper border of the flat, but only after the additional confirmation. Buy trades are best to look for on intraday time frames from the support level of 1.2238 or the lower border of the flat, but only with confirmation and short targets.

Alternative scenario: if the price breaks out through the 1.2422 resistance level and fixes above, the uptrend will likely resume.

GBP/USD
There is no news feed for today.

The USD/JPY currency pair

Technical indicators of the currency pair:
  • Prev Open: 135.11
  • Prev Close: 135.47
  • % chg. over the last day: +0.27%

The yield differential between Japanese Government Bonds and US Treasuries still keeps the JPY low. However, the Bank of Japan holds its monetary policy soft as policymakers attribute rising inflation to rising energy and commodity prices. More and more analysts are starting to believe that at some point, the Bank of Japan will make currency intervention, as the yen’s weakness is taking a heavy toll on the Japanese economy. Both BOJ Governor Kuroda and Prime Ministerof Japan Kishida acknowledge this point.

Trading recommendations
  • Support levels: 134.84, 133.35, 131.67, 131.00, 130.12, 129.48, 128.76
  • Resistance levels: 135.88, 136.66

The medium-term trend on the USD/JPY currency pair is bullish. The price trades near the moving average lines and forms a wide price balance. The MACD indicator has become inactive. Under such market conditions, buy trades can be considered from the support level of 134.84 or 133.35, but with confirmation. A resistance level of 135.88 is good for sell deals, but only with additional confirmation and short targets.

Alternative scenario: If the price fixes below 133.35, the downtrend will likely resume.

USD/JPY
There is no news feed for today.

The USD/CAD currency pair

Technical indicators of the currency pair:
  • Prev Open: 1.2889
  • Prev Close: 1.2873
  • % chg. over the last day: -0.12%

The Canadian dollar is a commodity currency, so it depends not only on the US Dollar Index but also on oil prices. The dollar index declined yesterday, while oil prices grew during the last three trading sessions. As a result, the Canadian dollar has strengthened. It should be noted that the Bank of Canada is on its way to raising interest rates and the latest inflation data showed that inflation in Canada has not stopped rising. Therefore, on expectations of an aggressive rate hike at the next meeting, the Canadian dollar may continue its upward momentum in the coming days.

Trading recommendations
  • Support levels: 1.2815, 1.2709, 1.2618, 1.2578, 1.2510
  • Resistance levels: 1.2887, 1.2956, 1.3068

In terms of technical analysis, the trend on the USD/CAD currency pair is bullish. But the MACD indicator became negative, and the price is trading below the moving averages. Buyers are losing the initiative. A price move below 1.2815 will change the priority. Under such market conditions, it is better to look for buy deals in the lower time frames from the support level of 1.2815. For sell deals, it is better to consider the resistance level of 1.2956, but it is also better with confirmation and short targets.

Alternative scenario: if the price breaks through and consolidates below the 1.2815 support level, the downtrend will likely resume.

USD/CAD
There is no news feed for today.

By JustForex


This article reflects a personal opinion and should not be interpreted as an investment advice, and/or offer, and/or a persistent request for carrying out financial transactions, and/or a guarantee, and/or a forecast of future events.

Japanese Candlesticks Analysis 27.06.2022 (EURUSD, USDJPY, EURGBP)

Article By RoboForex.com

EURUSD, “Euro vs US Dollar”

As we can see in the H4 chart, the asset has formed an Inverted Hammer reversal pattern close to the support area during the correction. At the moment, EURUSD may reverse in the form of a new ascending impulse. In this case, the upside target may be at 1.0595. However, an alternative scenario implies that the price may fall to reach 1.0490 and continue the downtrend without testing 1.0595.

EURUSD
Risk Warning: the result of previous trading operations do not guarantee the same results in the future

USDJPY, “US Dollar vs Japanese Yen”

As we can see in the H4 chart, USDJPY has formed several reversal patterns not far from the support area, such as Hammer. At the moment, the asset is reversing in the form of a new rising impulse. In this case, the upside target may be at 137.50. At the same time, an opposite scenario implies that the price may correct to reach 134.15 and resume the uptrend after a pullback.

USDJPY
Risk Warning: the result of previous trading operations do not guarantee the same results in the future

EURGBP, “Euro vs Great Britain Pound”

As we can see in the H4 chart, after forming aт Engulfing pattern near the support area, EURGBP is reversing in the form of a new rising impulse. In this case, the upside target may be the resistance level at 0.8655. Later, the market may test this level, break it, and continue moving upwards. Still, there might be an alternative scenario, according to which the asset may correct to reach 0.8570 before resuming the ascending tendency.

EURGBP

Article By RoboForex.com

Attention!
Forecasts presented in this section only reflect the author’s private opinion and should not be considered as guidance for trading. RoboForex LP bears no responsibility for trading results based on trading recommendations described in these analytical reviews.

Trade Of The Week: Will Central Bank Heavyweights Spark EURUSD Breakout?

By ForexTime 

– Watch this space because the EURUSD could turn volatile over the next few days!

Investors will be served a tantalizing combination of key economic reports and speeches from policymakers this week. However, the main course and potential market shaker could be the ECB’s three-day forum in Portugal’s Sintra which kicks off today. The forum will be focusing on “the challenges for monetary policy in a rapidly changing world” with Wednesday’s panel discussion featuring central bank heavyweights in sharp focus.

Before we sink our teeth into what to expect from the major events and EURUSD in the week ahead, it is worth keeping in mind that the euro has appreciated against most G10 currencies quarter-to-date. But against the mighty dollar, the currency is down roughly 4.7% due to the ECB lagging behind the Fed, which has moved aggressively to tame inflation.

Taking a quick look at the technical picture, the EURUSD is balancing above significant support at 1.0400 on the monthly timeframe. The last time prices secured a monthly close below this level was in December 2002.

The trend is heavily bearish on the weekly timeframe as there have been consistently lower lows and lower highs.

Now, this is where things get interesting.

On the technical charts, the EURUSD remains in a downtrend with the widening policy divergence between the ECB and Fed supporting bears in the past. However, the ECB has recently joined the hawkish camp and signalled to markets it plans to raise interest rates by 25 basis points in July. In fact, the central bank could also move ahead with a 50bps hike in September as it battles the inflation beast! Such a development is likely to favour euro bulls – limiting downside losses on the EURUSD.

The week ahead: data, policymakers, and more…

Grab your popcorn and find a comfortable seat because the show is about to begin.

On Tuesday, San Francisco Fed President Mary Daly will be under the spotlight. Last Friday she stated that another 75 basis point interest rate hike in July is her “starting point” but if the economy slows more than expected a 50 basis point could be reasonable. Investors will also be presented with the US consumer confidence data for June which is expected to deteriorate further.

Several Fed officials will be making an appearance on Wednesday.

However, the main risk event will be the ECB panel featuring ECB President Christine Lagarde, Fed Chair Jerome Powell, and BOE Governor Andrew Bailey.

Investors will be closely watching the panel discussion for fresh insights on how the central bank heads plan to fight inflation while trying to engineer a soft landing for the global economy. Given how markets remain highly sensitive to rate hike expectations, any fresh clues about future rate hikes could trigger fresh volatility in the FX space. On the data front, Eurozone economic confidence, German inflation figures for June, and third print US Q1 GDP figures will also be published.

On Thursday, it’s all about the Eurozone unemployment figures for May which are expected to remain unchanged at a record low of 6.8%. In the United States, the weekly initial jobless claims, personal income/spending, and PCE deflator for May will most likely hijack the spotlight in the afternoon.

Given how the core Personal Consumption Expenditure (PCE) Index is the Fed’s favoured measure of inflation, this will be closely scrutinised by market players.

According to a survey on Bloomberg, the PCE Core Deflator YoY is expected to have cooled to 4.8% in May compared to the 4.9% witnessed in the previous month. If expectations match reality, this could fuel speculation around inflation peaking – cooling rate hike bets and weakening the dollar.

To conclude the week, the flash Eurozone CPI figures and manufacturing PMI for June will be published. Eurozone inflation is estimated to have hit 8.5% in June, higher than the record-high of 8.1% seen in May. If the reports meet expectations, this could boost speculation over the ECB adopting an aggressive approach towards higher interest rates to fight inflation. Such a development could boost the euro. We also have the US ISM manufacturing and Global manufacturing PMI figure for June on Friday afternoon which may show how the US economy is coping amid the Fed’s aggressive rate hiking cycle.

With so much going on this week, the EURUSD has the potential to throw investors on a roller coaster ride!

EURUSD poised to breakout from range?

Over the past few weeks, the EURUSD has been trapped within a wide range with support at 1.0350 and resistance at 1.0780. Although the overall trend remains bearish, there seems to be a struggle between bulls and bears and this continues to be reflected in price action.

There are a couple of scenarios that could play out on the EURUSD in the week ahead.

  1. A solid breakout and daily close above 1.0630 may trigger an incline towards 1.0780 and 1.0920.

  1. Prices fail to conquer the 1.0630 resistance which results in a decline back towards 1.0480, 1.0350, and 1.0200.

  1. Prices remain trapped within the 1.0480 support and 1.0630 resistance level with a possibility of sinking back towards 1.0350.


Forex-Time-LogoArticle by ForexTime

ForexTime Ltd (FXTM) is an award winning international online forex broker regulated by CySEC 185/12 www.forextime.com

The Analytical Overview of the Main Currency Pairs on 2022.06.27

By JustForex

The EUR/USD currency pair

Technical indicators of the currency pair:
  • Prev Open: 1.0518
  • Prev Close: 1.0551
  • % chg. over the last day: +0.31%

German Business Climate Index data showed a decline over the past month. The ifo Business Climate Index fell to 92.3 in June from 93.0 in May. The most significant decline was in the manufacturing sector. But the business climate -improved in the services sector. This was due to a considerable decrease in skepticism from service providers. The business climate also continues to improve in the construction sector. Many European countries will release inflation data this week, and then the overall figure for the Eurozone will be published on Friday. Analysts believe that inflation will continue to accelerate.

Trading recommendations
  • Support levels: 1.0408, 1.0379
  • Resistance levels: 1.0555, 1.0611, 1.0680, 1.0723

From the technical point of view, the trend on the EUR/USD currency pair on the hourly time frame is bearish. The price forms a wide corridor, and the MACD indicator has become inactive. Under such market conditions, sell deals can be considered from the resistance level of 1.0555 or from the upper border of the flat, but only after the additional confirmation. A price move above 1.0611 will change the priority. Buy trades are best to look for on intraday time frames from the support level of 1.0408 or from the lower border of the flat, but only with confirmation and short targets.

Alternative scenario: if the price breaks out through the 1.0611 resistance level and fixes above, the uptrend will likely resume.

EUR/USD
News feed for 2022.06.27:
  • – German Retail Sales (m/m) at 09:00 (GMT+3);
  • – US Durable Goods Orders (m/m) at 15:30 (GMT+3);
  • – US Pending Home Sales (m/m) at 17:00 (GMT+3);
  • – Eurozone ECB President Lagarde Speaks at 20:30 (GMT+3).

The GBP/USD currency pair

Technical indicators of the currency pair:
  • Prev Open: 1.2249
  • Prev Close: 1.2275
  • % chg. over the last day: +0.21%

A three-day forum with the main theme “Challenges for monetary policy in a rapidly changing world” will start on Monday in Sintra, Portugal. The forum will end with speeches by the heads of the Fed, the ECB, and the Bank of England on Wednesday, so investors should keep a close eye on this event.

Trading recommendations
  • Support levels: .2238, 1.2093, 1.1974
  • Resistance levels: 1.2422, 1.2470, 1.2523, 1.2629

From the technical point of view, the trend on the GBP/USD currency pair on the hourly time frame is bearish. The situation is very similar to the euro. The price forms a wide corridor, while the MACD indicator shows no activity. Under such market conditions, sell deals can be considered from the resistance level of 1.2422 or from the upper border of the flat, but only after the additional confirmation. Buy trades are best to look for on intraday time frames from the support level of 1.2238 or from the lower border of the flat, but only with confirmation and short targets.

Alternative scenario: if the price breaks out through the 1.2422 resistance level and fixes above, the uptrend will likely resume.

GBP/USD
There is no news feed for today.

The USD/JPY currency pair

Technical indicators of the currency pair:
  • Prev Open: 134.92
  • Prev Close: 135.15
  • % chg. over the last day: +0.17%

The Japanese yen has strengthened these days slightly, but it should be noted that this strengthening was due to a decrease in the dollar index. There is no fundamental reason for the yen to strengthen at the moment, as the Bank of Japan is still keeping its soft monetary policy, while the US Federal Reserve, as well as the central banks of England and Canada, are tightening policy. Such divergence has- caused the Japanese yen to make new price lows against major currencies.

Trading recommendations
  • Support levels: 134.10, 133.35, 131.67, 131.00, 130.12, 129.48, 128.76
  • Resistance levels: 135.23, 135.77, 136.66

The medium-term trend on the USD/JPY currency pair is bullish. The price is trading near the moving average lines and forming a wide price balance. The MACD indicator has become inactive. Under such market conditions, buy trades can be considered from the support level of 134.10 or 133.35, but with confirmation. A resistance level of 135.23 is good for sell deals, but only with additional confirmation and short targets.

Alternative scenario: If the price fixes below 133.35, the downtrend will likely resume.

USD/JPY
There is no news feed for today.

The USD/CAD currency pair

Technical indicators of the currency pair:
  • Prev Open: 1.2995
  • Prev Close: 1.2892
  • % chg. over the last day: -0.80%

The Canadian dollar is a commodity currency, so it depends on the US Dollar Index and oil prices. The dollar index declined on Friday, while oil prices jumped during the last two trading sessions. As a result, the Canadian dollar has strengthened. It should be noted that the Bank of Canada is on its way to raising interest rates and the latest inflation data from Canada showed that inflation has not stopped rising. Therefore, on expectations of an aggressive rate hike at the next meeting, the Canadian dollar may continue its upward momentum in the near term.

Trading recommendations
  • Support levels: 1.2815, 1.2709, 1.2618, 1.2578, 1.2510
  • Resistance levels: 1.2893, 1.2956, 1.3068

In terms of technical analysis, the trend on the USD/CAD currency pair is bullish. But the MACD indicator became negative, and the price is trading below the moving averages. Buyers are losing the initiative. A price move below 1.2815 will change the priority. Under such market conditions, it is better to look for buy deals in the lower time frames from the support level of 1.2815. For sell deals, it is better to consider the resistance level of 1.2956, but it is also better with confirmation and short targets.

Alternative scenario: if the price breaks through and consolidates below the 1.2815 support level, the downtrend will likely resume.

USD/CAD
There is no news feed for today.

By JustForex


This article reflects a personal opinion and should not be interpreted as an investment advice, and/or offer, and/or a persistent request for carrying out financial transactions, and/or a guarantee, and/or a forecast of future events.

Currency Speculators boost Japanese Yen bets to 15-week high while Canadian dollar bets drop sharply

By InvestMacro | COT | Data Tables | COT Leaders | Downloads | COT Newsletter

currency futures open interest comparison

Here are the latest charts and statistics for the Commitment of Traders (COT) data published by the Commodities Futures Trading Commission (CFTC).

The latest COT data is updated through Tuesday June 21st and shows a quick view of how large traders (for-profit speculators and commercial entities) were positioned in the futures markets. All currency positions are in direct relation to the US dollar where, for example, a bet for the euro is a bet that the euro will rise versus the dollar while a bet against the euro will be a bet that the euro will decline versus the dollar.

Currency market speculator bets overall were mixed this week as five out of the eleven currency markets we cover (Note: Russian Ruble positions have not been updated by CFTC since March) had higher positioning this week while six markets had lower contracts for the week.

Leading the gains for currency markets was the Japanese yen (11,301 contracts) and the British pound sterling (2,349 contracts) with the Australian dollar (2,648 contracts), New Zealand dollar (1,415 contracts) and the US Dollar Index (534 contracts) also showing positive changes on the week.

Meanwhile, leading the declines in speculator bets this week were the Canadian dollar (-19,097 contracts) and the Euro (-9,587 contracts) with the Brazil real (-2,868 contracts), Mexican peso (-489 contracts), Swiss franc (-349 contracts) and Bitcoin (-15 contracts) also showing lower speculator positions through June 21st.

Currency Position Notables:

Japanese Yen large speculator bets rose for the 6th straight week this week and this improvement has brought the overall speculator standing to the least bearish level of the past 15 weeks at -58,454 contracts. Speculators have trimmed a total of 52,000 contracts off of the total bearish position in these past six weeks after the standing hit -110,454 contracts on May 10th. Yen bets have been in bearish territory since March 13th of 2021 (67 weeks running) with the highest bearish level of the cycle occurring on April 12th at a total of -111,827 contracts.

Canadian dollar bets dropped sharply by -19,097 contracts this week and fell for the first time in the last five weeks. CAD speculator bets had risen over the previous four weeks by a total of +37,698 contracts. The decline this week brings the CAD speculator position into a virtual neutral level at an overall bullish position of just +4,105 contracts as the speculator position has yet to find a sustainable trend and has been alternating between bearish and bullish net positions over the past few months.

The US Dollar Index rose for a 3rd straight week this week and hit a new 5-year high level at +45,010 contracts. This is the first time the overall position has topped +45,000 contracts since March 21st of 2017 and the continued bullish sentiment for the DXY has pushed the US Dollar Index strength score (3-year range) to the very top of its range (100 percent – extreme bullish).

Euro positions fell for the third straight week and dropped to its most bearish level of the past 29 weeks. The strength score for the Euro has dropped to just a 30.2 percent and it seems the speculator positioning is catching up to the bearishness of the EURUSD exchange rate. The speculator net position had been at a twelve-week high on May 31st at a total of +52,272 contracts before dropping over the past three weeks to settle at -15,605 contracts this week.


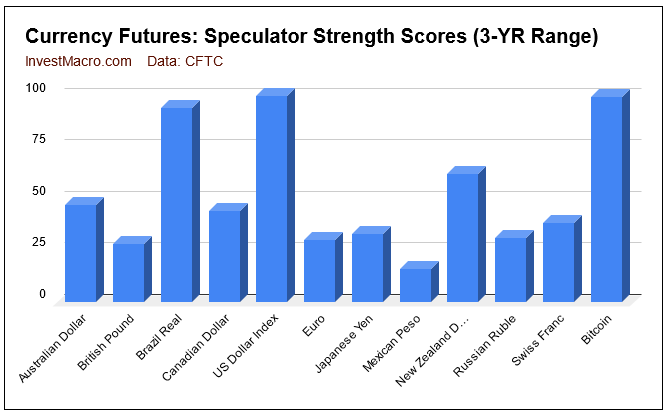
Strength scores (3-Year range of Speculator positions, ranging from 0 to 100 where above 80 percent is extreme bullish, below 20 percent is extreme bearish and 100 percent is the top of the range) show that the US Dollar Index (100 percent), Bitcoin (99.7 percent) and the Brazilian Real (94 percent) are all in extreme bullish positions. On the bearish side, the Mexican Peso is the only currency currently in an extreme bearish position with a score of 15.9 percent.

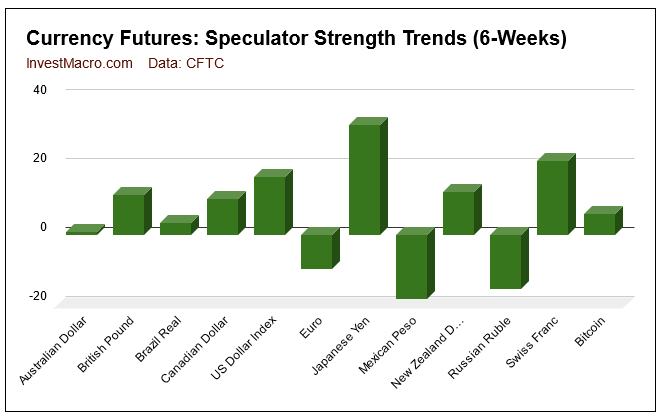
Strength score trends (or move index, that calculate 6-week changes in strength scores) shows that the Japanese Yen (32.0 percent) and the Swiss Franc (21.8 percent) are leading the strength trends over the past six weeks. Both of these markets have overall bearish net positions but have seen the bearish sentiment cooling off strongly. The Mexican Peso leads the downside trends for another week with a -18.6 percent score.


Data Snapshot of Forex Market Traders | Columns Legend
Jun-21-2022OIOI-IndexSpec-NetSpec-IndexCom-NetCOM-IndexSmalls-NetSmalls-Index
USD Index58,5438645,010100-46,74621,73636
EUR671,71870-15,60530-18,1827133,78730
GBP228,26657-63,2472877,90276-14,65525
JPY218,07667-58,4543374,34972-15,89521
CHF37,66916-7,1573814,95867-7,80131
CAD140,047234,10544-6,578632,47335
AUD137,01735-40,6064744,60852-4,00243
NZD42,88930-5,423628,75644-3,33313
MXN191,26545-26,8701622,977823,89360
RUB20,93047,54331-7,15069-39324
BRL68,8586544,34594-45,99661,65184
Bitcoin13,537771,046100-9950-5112


US Dollar Index Futures:

US Dollar Index Forex Futures COT Chart
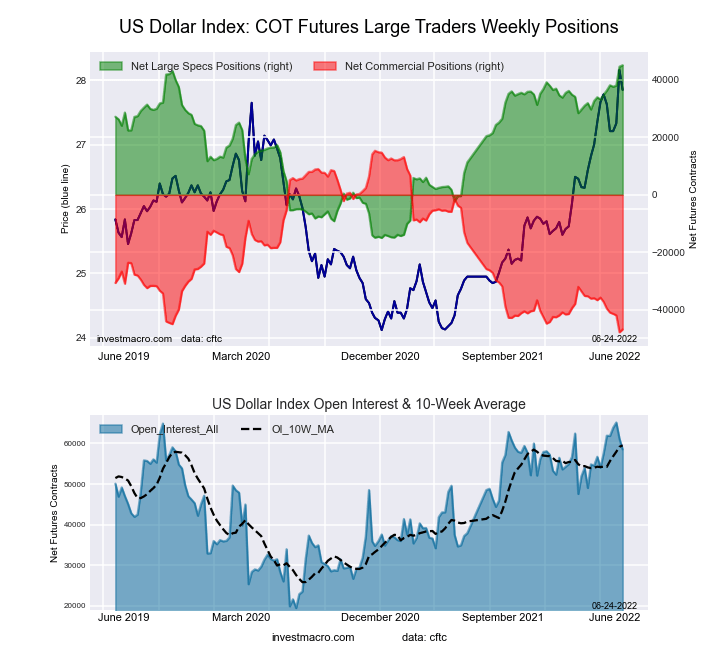
The US Dollar Index large speculator standing this week recorded a net position of 45,010 contracts in the data reported through Tuesday. This was a weekly boost of 534 contracts from the previous week which had a total of 44,476 net contracts.

This week’s current strength score (the trader positioning range over the past three years, measured from 0 to 100) shows the speculators are currently Bullish-Extreme with a score of 100.0 percent. The commercials are Bearish-Extreme with a score of 1.6 percent and the small traders (not shown in chart) are Bearish with a score of 35.5 percent.

US DOLLAR INDEX StatisticsSPECULATORSCOMMERCIALSSMALL TRADERS
– Percent of Open Interest Longs:88.22.97.7
– Percent of Open Interest Shorts:11.382.74.8
– Net Position:45,010-46,7461,736
– Gross Longs:51,6061,6764,522
– Gross Shorts:6,59648,4222,786
– Long to Short Ratio:7.8 to 10.0 to 11.6 to 1
NET POSITION TREND:
– Strength Index Score (3 Year Range Pct):100.01.635.5
– Strength Index Reading (3 Year Range):Bullish-ExtremeBearish-ExtremeBearish
NET POSITION MOVEMENT INDEX:
– 6-Week Change in Strength Index:17.1-15.2-7.2


Euro Currency Futures:

Euro Currency Futures COT Chart
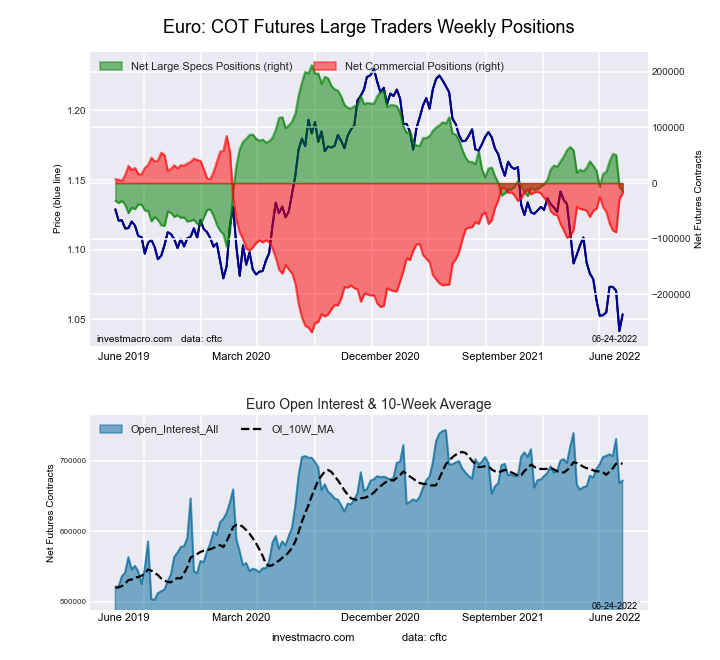
The Euro Currency large speculator standing this week recorded a net position of -15,605 contracts in the data reported through Tuesday. This was a weekly decrease of -9,587 contracts from the previous week which had a total of -6,018 net contracts.

This week’s current strength score (the trader positioning range over the past three years, measured from 0 to 100) shows the speculators are currently Bearish with a score of 30.2 percent. The commercials are Bullish with a score of 70.9 percent and the small traders (not shown in chart) are Bearish with a score of 30.4 percent.

EURO Currency StatisticsSPECULATORSCOMMERCIALSSMALL TRADERS
– Percent of Open Interest Longs:29.155.612.7
– Percent of Open Interest Shorts:31.458.37.7
– Net Position:-15,605-18,18233,787
– Gross Longs:195,554373,69585,208
– Gross Shorts:211,159391,87751,421
– Long to Short Ratio:0.9 to 11.0 to 11.7 to 1
NET POSITION TREND:
– Strength Index Score (3 Year Range Pct):30.270.930.4
– Strength Index Reading (3 Year Range):BearishBullishBearish
NET POSITION MOVEMENT INDEX:
– 6-Week Change in Strength Index:-9.97.012.1


British Pound Sterling Futures:

British Pound Sterling Futures COT Chart
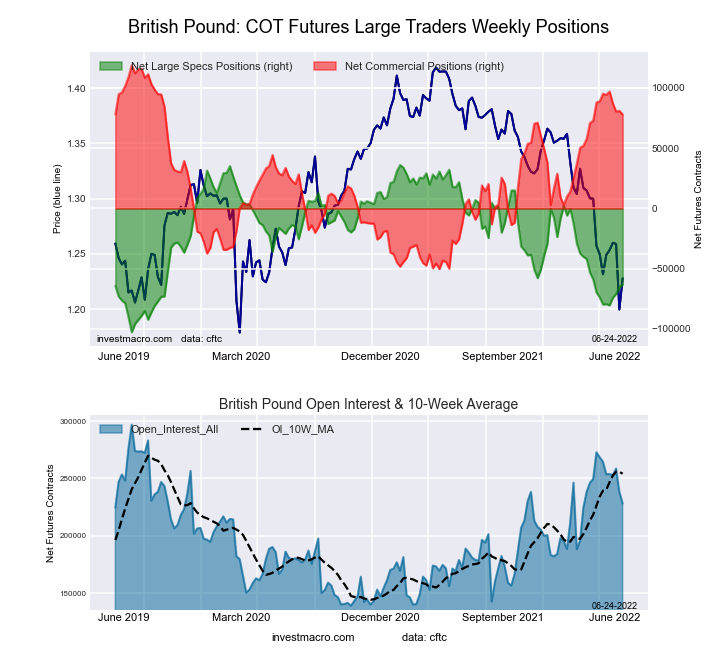
The British Pound Sterling large speculator standing this week recorded a net position of -63,247 contracts in the data reported through Tuesday. This was a weekly boost of 2,349 contracts from the previous week which had a total of -65,596 net contracts.

This week’s current strength score (the trader positioning range over the past three years, measured from 0 to 100) shows the speculators are currently Bearish with a score of 28.4 percent. The commercials are Bullish with a score of 75.8 percent and the small traders (not shown in chart) are Bearish with a score of 25.3 percent.

BRITISH POUND StatisticsSPECULATORSCOMMERCIALSSMALL TRADERS
– Percent of Open Interest Longs:12.577.67.8
– Percent of Open Interest Shorts:40.243.514.2
– Net Position:-63,24777,902-14,655
– Gross Longs:28,470177,17017,735
– Gross Shorts:91,71799,26832,390
– Long to Short Ratio:0.3 to 11.8 to 10.5 to 1
NET POSITION TREND:
– Strength Index Score (3 Year Range Pct):28.475.825.3
– Strength Index Reading (3 Year Range):BearishBullishBearish
NET POSITION MOVEMENT INDEX:
– 6-Week Change in Strength Index:11.8-10.32.1


Japanese Yen Futures:

Japanese Yen Forex Futures COT Chart
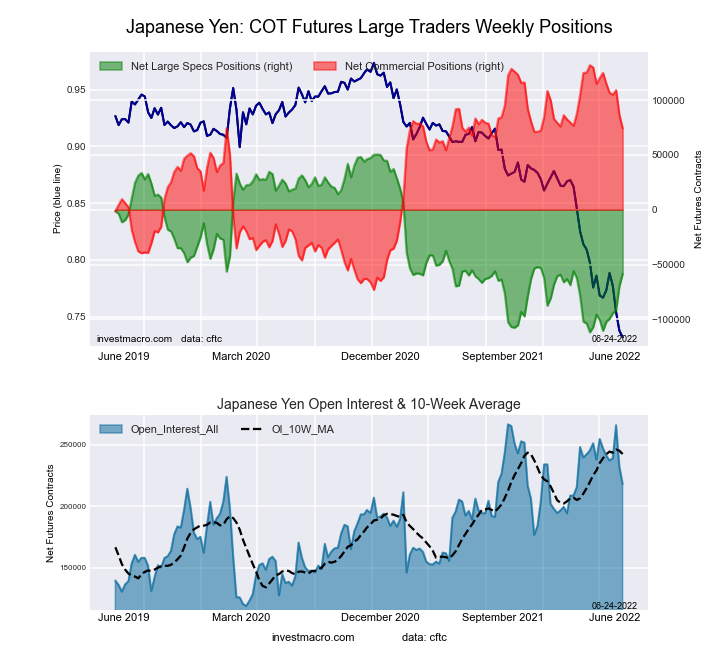
The Japanese Yen large speculator standing this week recorded a net position of -58,454 contracts in the data reported through Tuesday. This was a weekly advance of 11,301 contracts from the previous week which had a total of -69,755 net contracts.

This week’s current strength score (the trader positioning range over the past three years, measured from 0 to 100) shows the speculators are currently Bearish with a score of 32.9 percent. The commercials are Bullish with a score of 71.9 percent and the small traders (not shown in chart) are Bearish with a score of 21.1 percent.

JAPANESE YEN StatisticsSPECULATORSCOMMERCIALSSMALL TRADERS
– Percent of Open Interest Longs:16.471.610.6
– Percent of Open Interest Shorts:43.337.617.9
– Net Position:-58,45474,349-15,895
– Gross Longs:35,864156,24823,099
– Gross Shorts:94,31881,89938,994
– Long to Short Ratio:0.4 to 11.9 to 10.6 to 1
NET POSITION TREND:
– Strength Index Score (3 Year Range Pct):32.971.921.1
– Strength Index Reading (3 Year Range):BearishBullishBearish
NET POSITION MOVEMENT INDEX:
– 6-Week Change in Strength Index:32.0-24.7-2.9


Swiss Franc Futures:

Swiss Franc Forex Futures COT Chart
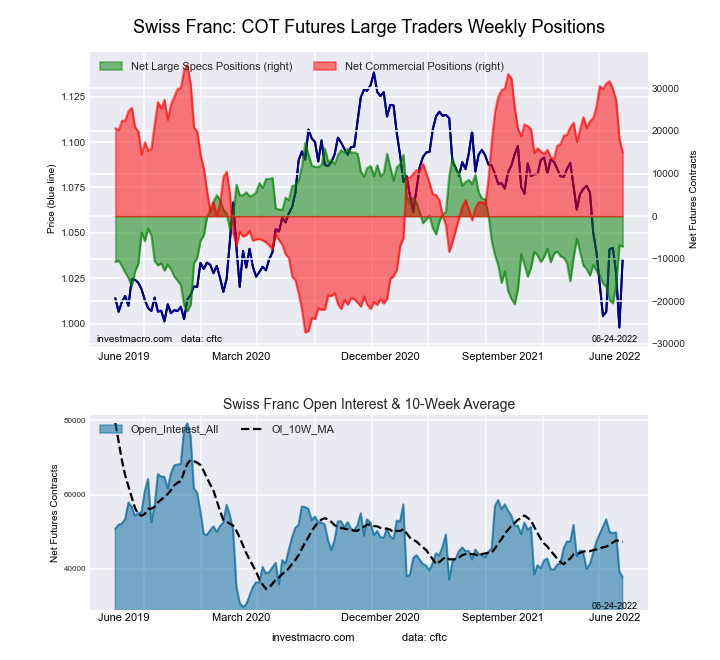
The Swiss Franc large speculator standing this week recorded a net position of -7,157 contracts in the data reported through Tuesday. This was a weekly decline of -349 contracts from the previous week which had a total of -6,808 net contracts.

This week’s current strength score (the trader positioning range over the past three years, measured from 0 to 100) shows the speculators are currently Bearish with a score of 38.4 percent. The commercials are Bullish with a score of 67.3 percent and the small traders (not shown in chart) are Bearish with a score of 31.1 percent.

SWISS FRANC StatisticsSPECULATORSCOMMERCIALSSMALL TRADERS
– Percent of Open Interest Longs:8.166.225.7
– Percent of Open Interest Shorts:27.126.546.4
– Net Position:-7,15714,958-7,801
– Gross Longs:3,06824,9279,673
– Gross Shorts:10,2259,96917,474
– Long to Short Ratio:0.3 to 12.5 to 10.6 to 1
NET POSITION TREND:
– Strength Index Score (3 Year Range Pct):38.467.331.1
– Strength Index Reading (3 Year Range):BearishBullishBearish
NET POSITION MOVEMENT INDEX:
– 6-Week Change in Strength Index:21.8-23.721.2


Canadian Dollar Futures:

Canadian Dollar Forex Futures COT Chart
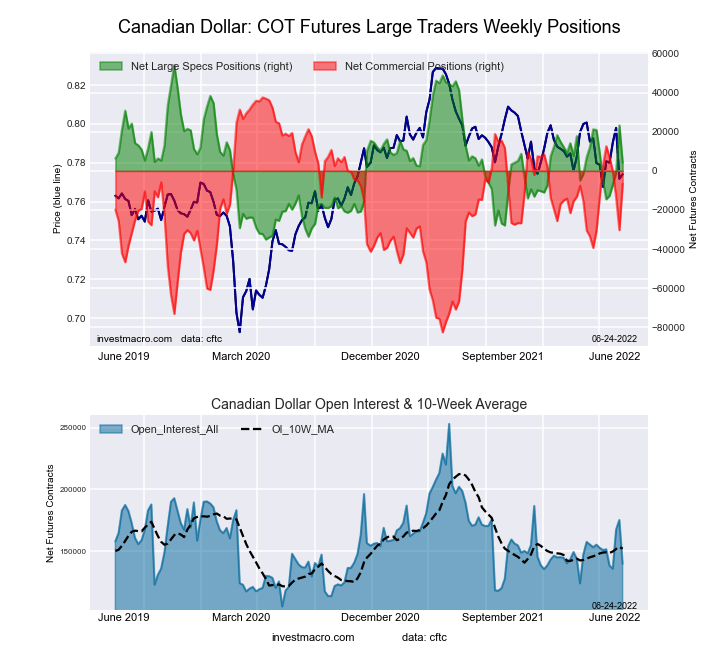
The Canadian Dollar large speculator standing this week recorded a net position of 4,105 contracts in the data reported through Tuesday. This was a weekly reduction of -19,097 contracts from the previous week which had a total of 23,202 net contracts.

This week’s current strength score (the trader positioning range over the past three years, measured from 0 to 100) shows the speculators are currently Bearish with a score of 44.0 percent. The commercials are Bullish with a score of 63.2 percent and the small traders (not shown in chart) are Bearish with a score of 35.1 percent.

CANADIAN DOLLAR StatisticsSPECULATORSCOMMERCIALSSMALL TRADERS
– Percent of Open Interest Longs:30.247.920.7
– Percent of Open Interest Shorts:27.252.618.9
– Net Position:4,105-6,5782,473
– Gross Longs:42,26067,08429,011
– Gross Shorts:38,15573,66226,538
– Long to Short Ratio:1.1 to 10.9 to 11.1 to 1
NET POSITION TREND:
– Strength Index Score (3 Year Range Pct):44.063.235.1
– Strength Index Reading (3 Year Range):BearishBullishBearish
NET POSITION MOVEMENT INDEX:
– 6-Week Change in Strength Index:10.7-7.90.0


Australian Dollar Futures:

Australian Dollar Forex Futures COT ChartThe Australian Dollar large speculator standing this week recorded a net position of -40,606 contracts in the data reported through Tuesday. This was a weekly gain of 2,648 contracts from the previous week which had a total of -43,254 net contracts.

This week’s current strength score (the trader positioning range over the past three years, measured from 0 to 100) shows the speculators are currently Bearish with a score of 47.2 percent. The commercials are Bullish with a score of 52.2 percent and the small traders (not shown in chart) are Bearish with a score of 42.7 percent.

AUSTRALIAN DOLLAR StatisticsSPECULATORSCOMMERCIALSSMALL TRADERS
– Percent of Open Interest Longs:23.260.213.7
– Percent of Open Interest Shorts:52.827.716.6
– Net Position:-40,60644,608-4,002
– Gross Longs:31,74582,51418,756
– Gross Shorts:72,35137,90622,758
– Long to Short Ratio:0.4 to 12.2 to 10.8 to 1
NET POSITION TREND:
– Strength Index Score (3 Year Range Pct):47.252.242.7
– Strength Index Reading (3 Year Range):BearishBullishBearish
NET POSITION MOVEMENT INDEX:
– 6-Week Change in Strength Index:1.0-1.93.4


New Zealand Dollar Futures:

New Zealand Dollar Forex Futures COT Chart
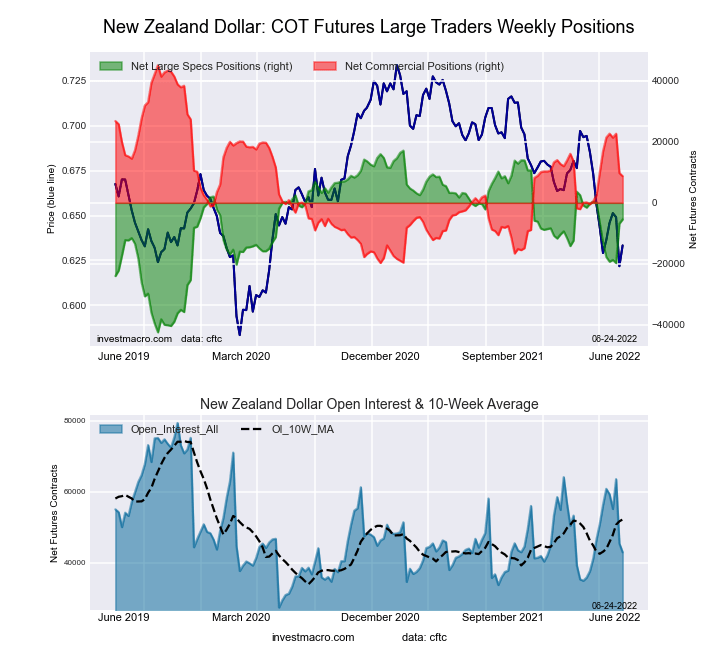
The New Zealand Dollar large speculator standing this week recorded a net position of -5,423 contracts in the data reported through Tuesday. This was a weekly lift of 1,415 contracts from the previous week which had a total of -6,838 net contracts.

This week’s current strength score (the trader positioning range over the past three years, measured from 0 to 100) shows the speculators are currently Bullish with a score of 62.2 percent. The commercials are Bearish with a score of 43.9 percent and the small traders (not shown in chart) are Bearish-Extreme with a score of 13.3 percent.

NEW ZEALAND DOLLAR StatisticsSPECULATORSCOMMERCIALSSMALL TRADERS
– Percent of Open Interest Longs:34.260.85.0
– Percent of Open Interest Shorts:46.840.312.8
– Net Position:-5,4238,756-3,333
– Gross Longs:14,65226,0562,145
– Gross Shorts:20,07517,3005,478
– Long to Short Ratio:0.7 to 11.5 to 10.4 to 1
NET POSITION TREND:
– Strength Index Score (3 Year Range Pct):62.243.913.3
– Strength Index Reading (3 Year Range):BullishBearishBearish-Extreme
NET POSITION MOVEMENT INDEX:
– 6-Week Change in Strength Index:12.7-12.56.3


Mexican Peso Futures:

Mexican Peso Futures COT Chart
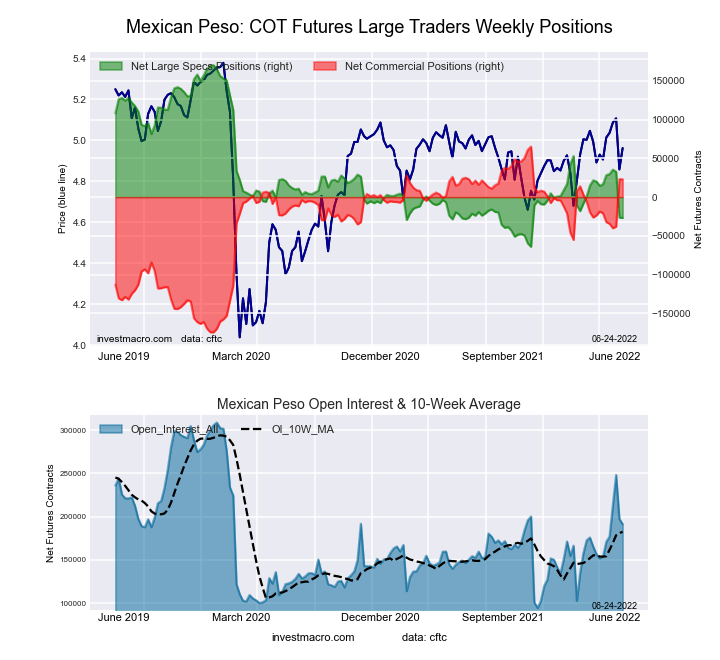
The Mexican Peso large speculator standing this week recorded a net position of -26,870 contracts in the data reported through Tuesday. This was a weekly fall of -489 contracts from the previous week which had a total of -26,381 net contracts.

This week’s current strength score (the trader positioning range over the past three years, measured from 0 to 100) shows the speculators are currently Bearish-Extreme with a score of 15.9 percent. The commercials are Bullish-Extreme with a score of 82.4 percent and the small traders (not shown in chart) are Bullish with a score of 59.5 percent.

MEXICAN PESO StatisticsSPECULATORSCOMMERCIALSSMALL TRADERS
– Percent of Open Interest Longs:50.345.83.3
– Percent of Open Interest Shorts:64.333.81.3
– Net Position:-26,87022,9773,893
– Gross Longs:96,14787,6096,317
– Gross Shorts:123,01764,6322,424
– Long to Short Ratio:0.8 to 11.4 to 12.6 to 1
NET POSITION TREND:
– Strength Index Score (3 Year Range Pct):15.982.459.5
– Strength Index Reading (3 Year Range):Bearish-ExtremeBullish-ExtremeBullish
NET POSITION MOVEMENT INDEX:
– 6-Week Change in Strength Index:-18.618.3-1.1


Brazilian Real Futures:

Brazil Real Futures COT Chart
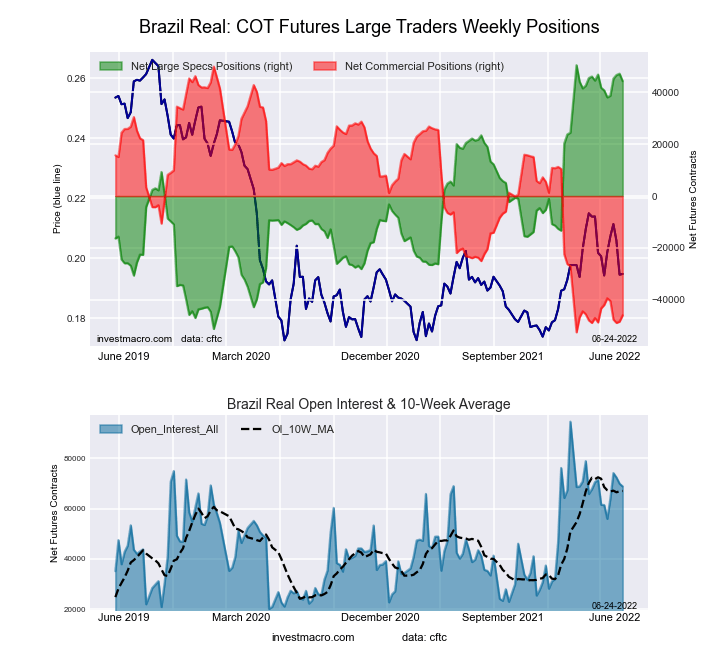
The Brazilian Real large speculator standing this week recorded a net position of 44,345 contracts in the data reported through Tuesday. This was a weekly fall of -2,868 contracts from the previous week which had a total of 47,213 net contracts.

This week’s current strength score (the trader positioning range over the past three years, measured from 0 to 100) shows the speculators are currently Bullish-Extreme with a score of 94.0 percent. The commercials are Bearish-Extreme with a score of 6.4 percent and the small traders (not shown in chart) are Bullish-Extreme with a score of 84.1 percent.

BRAZIL REAL StatisticsSPECULATORSCOMMERCIALSSMALL TRADERS
– Percent of Open Interest Longs:80.714.64.7
– Percent of Open Interest Shorts:16.381.32.3
– Net Position:44,345-45,9961,651
– Gross Longs:55,59910,0203,238
– Gross Shorts:11,25456,0161,587
– Long to Short Ratio:4.9 to 10.2 to 12.0 to 1
NET POSITION TREND:
– Strength Index Score (3 Year Range Pct):94.06.484.1
– Strength Index Reading (3 Year Range):Bullish-ExtremeBearish-ExtremeBullish-Extreme
NET POSITION MOVEMENT INDEX:
– 6-Week Change in Strength Index:3.5-3.94.7


Bitcoin Futures:

Bitcoin Crypto Futures COT Chart
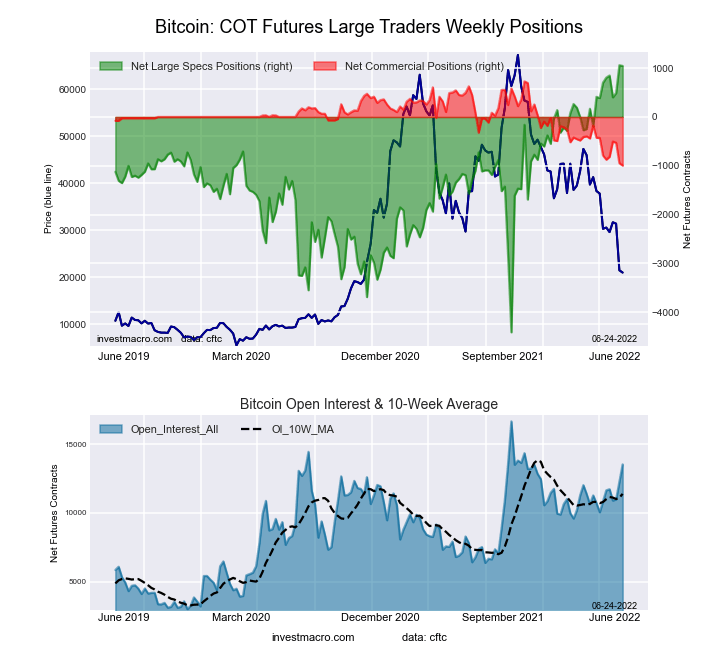
The Bitcoin large speculator standing this week recorded a net position of 1,046 contracts in the data reported through Tuesday. This was a weekly decline of -15 contracts from the previous week which had a total of 1,061 net contracts.

This week’s current strength score (the trader positioning range over the past three years, measured from 0 to 100) shows the speculators are currently Bullish-Extreme with a score of 99.7 percent. The commercials are Bearish-Extreme with a score of 0.0 percent and the small traders (not shown in chart) are Bearish-Extreme with a score of 11.8 percent.

BITCOIN StatisticsSPECULATORSCOMMERCIALSSMALL TRADERS
– Percent of Open Interest Longs:77.50.67.7
– Percent of Open Interest Shorts:69.87.98.1
– Net Position:1,046-995-51
– Gross Longs:10,495781,048
– Gross Shorts:9,4491,0731,099
– Long to Short Ratio:1.1 to 10.1 to 11.0 to 1
NET POSITION TREND:
– Strength Index Score (3 Year Range Pct):99.70.011.8
– Strength Index Reading (3 Year Range):Bullish-ExtremeBearish-ExtremeBearish-Extreme
NET POSITION MOVEMENT INDEX:
– 6-Week Change in Strength Index:6.3-11.9-3.1


Article By InvestMacroReceive our weekly COT Reports by Email

*COT Report: The COT data, released weekly to the public each Friday, is updated through the most recent Tuesday (data is 3 days old) and shows a quick view of how large speculators or non-commercials (for-profit traders) were positioned in the futures markets.

The CFTC categorizes trader positions according to commercial hedgers (traders who use futures contracts for hedging as part of the business), non-commercials (large traders who speculate to realize trading profits) and nonreportable traders (usually small traders/speculators) as well as their open interest (contracts open in the market at time of reporting).See CFTC criteria here.

Japanese Candlesticks Analysis 24.06.2022 (USDCAD, AUDUSD, USDCHF)

Article By RoboForex.com

USDCAD, “US Dollar vs Canadian Dollar”

As we can see in the H4 chart, after forming a Harami reversal pattern close to the support level, USDCAD may reverse in the form of another ascending impulse. In this case, the upside target may be the resistance area at 1.3095. Later, the market may break this level and continue growing. However, an alternative scenario implies that the asset may correct to reach 1.2920 first and then resume trading upwards.

USDCAD
Risk Warning: the result of previous trading operations do not guarantee the same results in the future

AUDUSD, “Australian Dollar vs US Dollar”

As we can see in the H4 chart, AUDUSD has formed a Hammer reversal pattern near the support level. At the moment, the asset is reversing and forming a new rising impulse. In this case, the upside target may be the resistance level at 0.6970. After testing the level, the price may rebound from it and resume the descending tendency. At the same time, the opposite scenario implies that the price may fall to reach 0.6815 and continue the downtrend without any corrections.

AUDUSD
Risk Warning: the result of previous trading operations do not guarantee the same results in the future

USDCHF, “US Dollar vs Swiss Franc”

As we can see in the H4 chart, after testing the support area, the pair has formed several reversal patterns, for example, Hammer. At the moment, USDCHF may reverse in the form of a new ascending impulse. In this case, the upside target may be at 0.9735. After testing the resistance level, the price may break it and continue trading upwards. Still, there might be an alternative scenario, according to which the asset may fall to reach 0.9540 and continue the ascending tendency only after the correction.

USDCHF

Article By RoboForex.com

Attention!
Forecasts presented in this section only reflect the author’s private opinion and should not be considered as guidance for trading. RoboForex LP bears no responsibility for trading results based on trading recommendations described in these analytical reviews.

Week Ahead: Euro to climb on more aggressive ECB rate hike bets?

By ForexTime 

Last week, we cited the possibility of the US dollar falling as recession fears mount.

At the time of writing, the benchmark dollar index (DXY) is set for a weekly decline, ending a run of three consecutive weekly gains. The softer greenback has in turn allowed EURUSD to resurface back above 1.05.

The bloc’s currency will be in focus going into the second half of 2022, amid these scheduled data releases and events in the coming week:

Monday, June 27

  • CNH: China May industrial profits
  • US crude: EIA weekly US crude inventories (delayed from last Thursday)

Tuesday, June 28

  • GBP: BOE Deputy Governor Jonathan Cunliffe speech
  • USD: San Francisco Fed President Mary Daly speech; US June consumer confidence

Wednesday, June 29

  • JPY: Japan May retail sales, June consumer confidence
  • AUD: Australia May retail sales
  • ECB panel featuring ECB President Christine Lagarde, Fed Chair Jerome Powell, and BOE Governor Andrew Bailey
  • EUR: Eurozone economic confidence; Germany June inflation
  • USD: US 1Q GDP (third print); speeches by Cleveland Fed President Loretta Mester and St. Louis Fed President James Bullard
  • US crude: EIA weekly US crude inventories

Thursday, June 30

  • JPY: Japan May industrial production
  • NZD: New Zealand June business confidence
  • CNH: China June PMIs
  • GBP: UK 1Q GDP (final print)
  • EUR: Eurozone May unemployment
  • Brent: OPEC+ meeting
  • USD: US weekly initial jobless claims, May personal income/spending, May PCE deflator

Friday, July 1

  • NZD: New Zealand June consumer confidence
  • AUD: Australia June manufacturing PMI
  • JPY: Japan June Tokyo CPI, May jobless rate
  • CNH: China June Caixin manufacturing PMI
  • EUR: Eurozone June CPI and manufacturing PMI
  • USD: US June ISM manufacturing, June S&P Global manufacturing PMI

The Eurozone’s incoming unemployment and inflation data are set to be interpreted within the context of the European Central Bank’s plans to raise interest rates.

As things stand, the ECB has already well-telegraphed to the markets its intentions for a 25-basis point rate hike in July. The ECB could then trigger a larger 50bps hike at its following meeting in September.

Those two hikes alone should bring the curtains down on the ECB’s negative interest rates regime, with markets expecting 200 basis points in hikes between now and March 2023.

However, the ECB may be forced to front-load its rate hikes, just like the Fed is doing, if the Eurozone’s inflation print comes in much hotter than expected.

The median estimate for the June CPI print is 8.3%, which would be a fresh record high for the Eurozone, and also higher than May’s 8.1% year-on-year print.

And if its unemployment rate continues to show resilience, with markets expecting the May print to be 10 basis points lower than April’s 6.8% print, that could even pave the way for ECB officials to become even more aggressive in its battle against record-high inflation!

EURUSD eyes 50-day SMA resistance and 1.035 support

If this narrative holds and markets ramp up their bets for a more aggressive ECB, that could help EURUSD retest its 50-day moving average as the immediate resistance level, currently hovering around the 1.06 mark.

Otherwise, a lower EURUSD could bring the 1.035 support region back into focus, having offered the world’s most popular currency pair two chances to rebound since May.


Overall, EURUSD is expected to continue being guided lower by its 50-day SMA, as has been the case over the past 12 months.

The euro’s upside remains capped by two major themes:

  • Recession risks are still clouding the Eurozone’s economic outlook, noting that the Russia-Ukraine war is still raging off the bloc’s eastern borders.
  • Fragmentation risks also weigh heavily on the euro, and the ECB’s new anti-crisis policy tool must be able to convince the markets of its effectiveness. Otherwise, the yields disparity could run out of control and trigger unruly declines in EURUSD.


Of course, the US dollar will have a major say on EURUSD’s performance. If the prospects of a US recession loom larger, that could translate into more moderation for the buck and more relief for the euro.

And with ECB President Christine Lagarde potentially offering more policy signals side-by-side with Fed Chair Jerome Powell mid-week, that could offer fresh catalysts for the EURUSD as we head into July.

Still, the ECB has to deliver on the market’s hawkish rate hike bets while keeping the region’s fragmentation risks at bay, in order to sustain hopes of a recovery for the euro.


Forex-Time-LogoArticle by ForexTime

ForexTime Ltd (FXTM) is an award winning international online forex broker regulated by CySEC 185/12 www.forextime.com