By JustForex
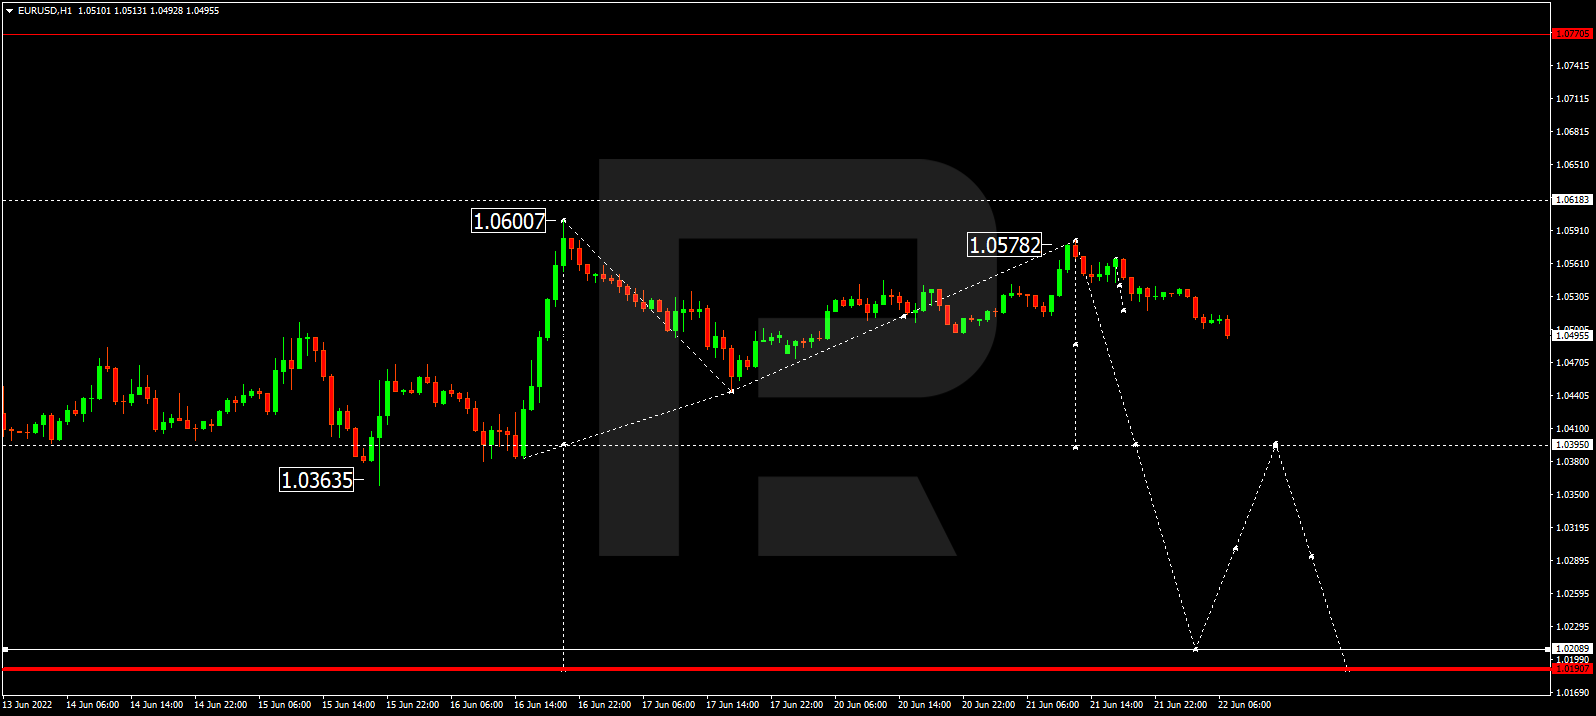
The EUR/USD currency pair
- Prev Open: 1.0564
- Prev Close: 1.0520
- % chg. over the last day: -0.42%
German and French PMI data showed that the Eurozone economy is starting to show signs of a slowdown. In Germany, the manufacturing PMI decreased from 54.8 to 52 while the services PMI dropped from 55 to 52.4. In France, the manufacturing PMI decreased from 58.3 to 54.4, and the services PMI declined from 54.6 to 51. Typically, a PMI falling below 50 is a sign of recession in which the central bank raises interest rates. At that time, Fed spokesman Kazimir said yesterday that some Eurozone countries might face a short-term recession.
- Support levels: 1.0408, 1.0379
- Resistance levels: 1.0555, 1.0611, 1.0680, 1.0723
From the technical point of view, the trend on the EUR/USD currency pair on the hourly time frame is bearish. The price forms a wide corridor, and the MACD indicator has become inactive. Under such market conditions, sell deals can be considered from the resistance level of 1.0555 or the upper border of the flat, but only after the additional confirmation. A price move above 1.0611 will change the priority. Buy trades are best to look for on intraday time frames from the support level of 1.0408 or the lower border of the flat, but only with confirmation and short targets.
Alternative scenario: if the price breaks out through the 1.0611 resistance level and fixes above, the uptrend will likely resume.

- – Eurozone German Ifo Business Climate Index (m/m) at 11:00 (GMT+3);
- – Eurozone EU Leaders Summit at 13:00 (GMT+3);
- – US FOMC Bullard Speaks at 14:30 (GMT+3);
- – US New Home Sales (m/m) at 17:00 (GMT+3).
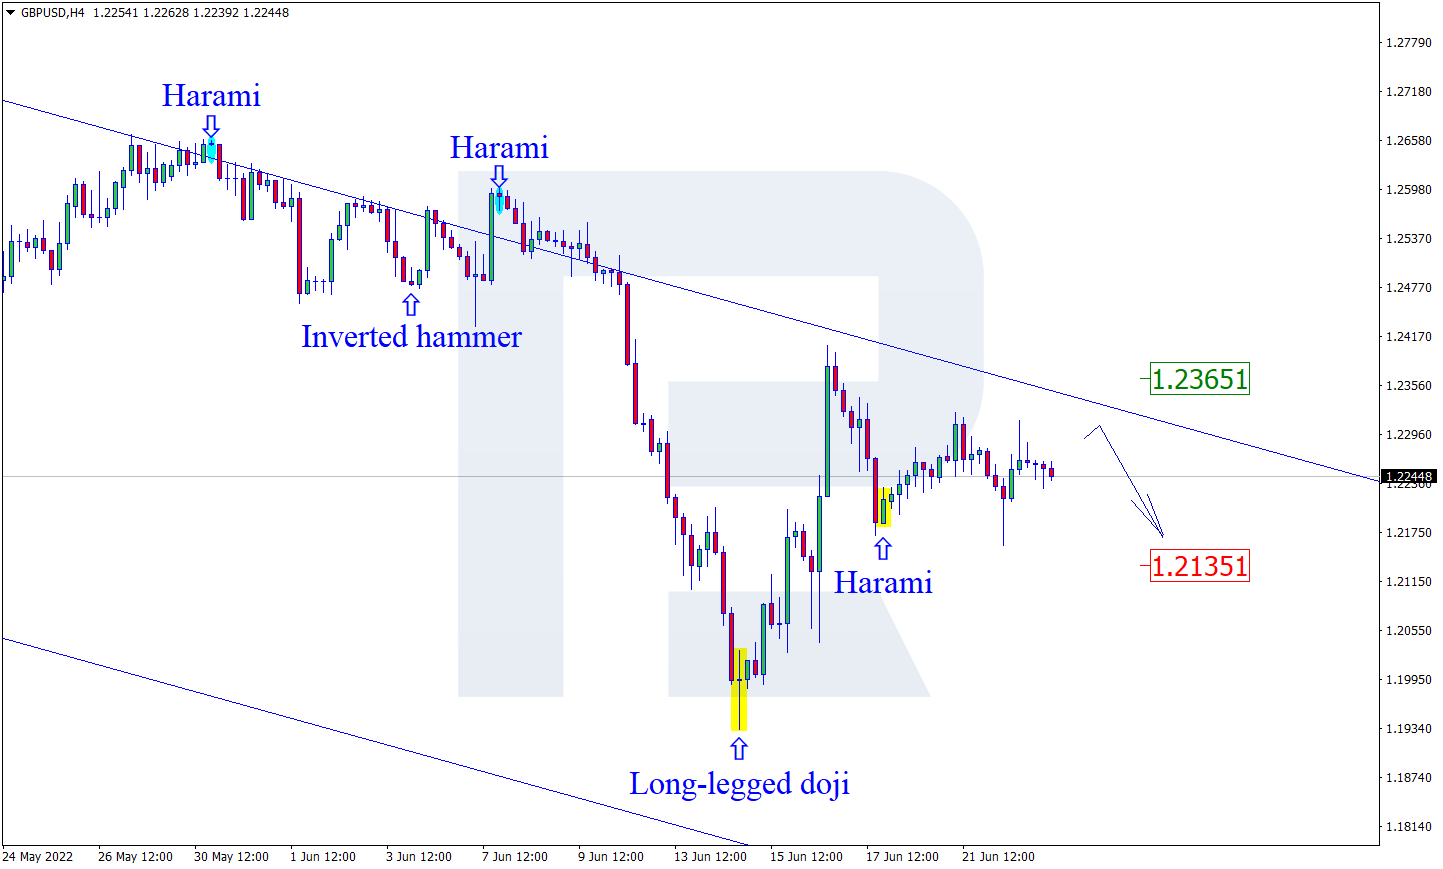
The GBP/USD currency pair
- Prev Open: 1.2263
- Prev Close: 1.2260
- % chg. over the last day: -0.02%
The UK Manufacturing PMI declined last month from 54.6 to 53.4, while the service sector remained at 53.4. Despite all the media talk about the dire state of the UK economy, the PMI shows that business activity in the UK is higher than in the Eurozone.
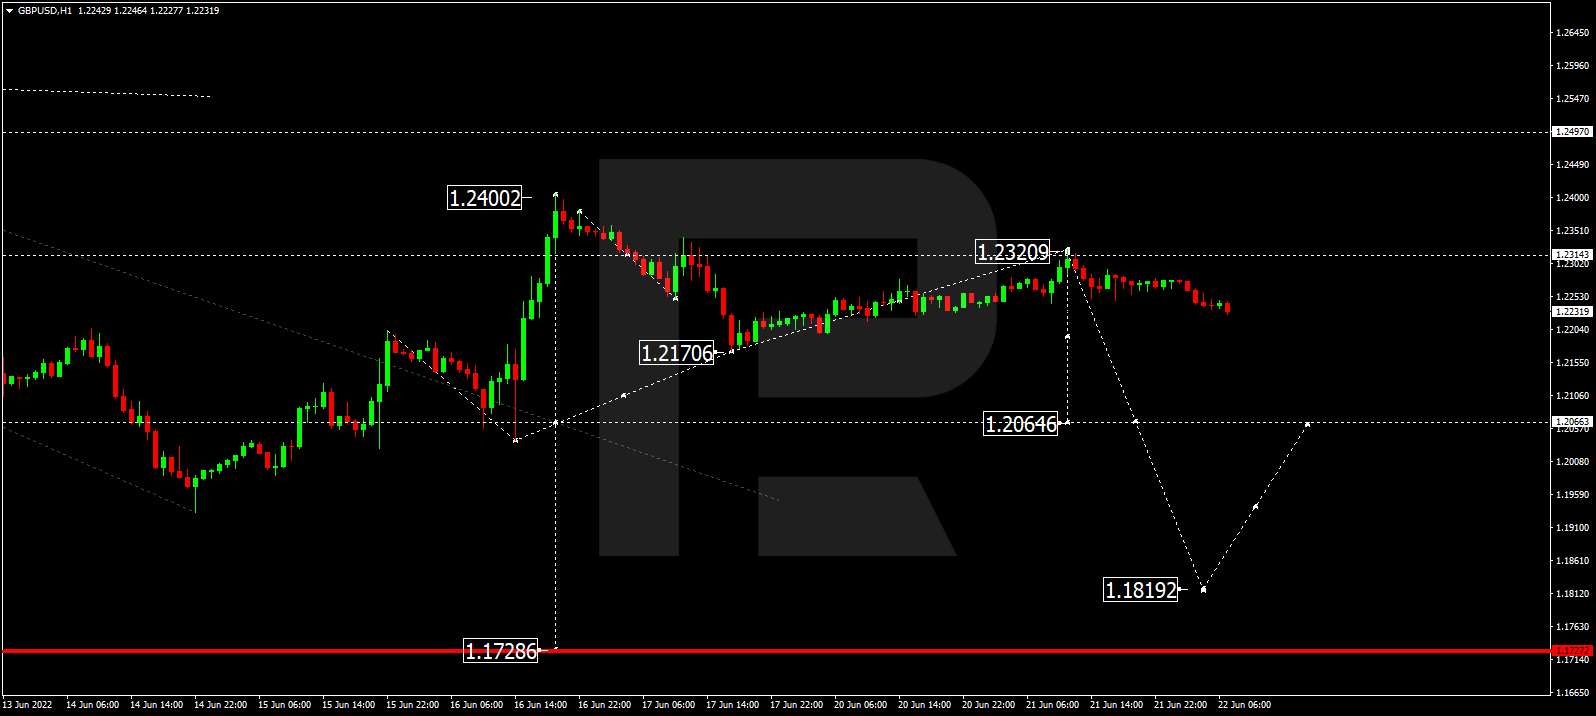
- Support levels: 1.2238, 1.2093, 1.1974
- Resistance levels: 1.2422, 1.2470, 1.2523, 1.2629
From the technical point of view, the trend on the GBP/USD currency pair on the hourly time frame is bearish. The situation is very similar to the euro. The price forms a wide corridor, while the MACD indicator shows no activity. Under such market conditions, sell deals can be considered from the resistance level of 1.2422 or the upper border of the flat, but only after the additional confirmation. Buy trades are best to look for on intraday time frames from the support level of 1.2238 or the lower border of the flat, but only with confirmation and short targets.
Alternative scenario: if the price breaks out through the 1.2422 resistance level and fixes above, the uptrend will likely resume.

- – UK Retail Sales (m/m) at 09:00 (GMT+3).
The USD/JPY currency pair
- Prev Open: 136.21
- Prev Close: 134.96
- % chg. over the last day: -0.93%
The nationwide core Consumer Price Index was 2.1% for the second month in a row and again exceeded the Bank of Japan’s target level. This data challenges the Bank of Japan’s view that the recent price increase is temporary and does not require a withdrawal of monetary stimulus. Such sentiment provided a brief boost to the Japanese yen. But with wage growth slowing, many analysts expect the Bank of Japan to remain on a soft monetary policy rather than fighting inflation by raising interest rates.
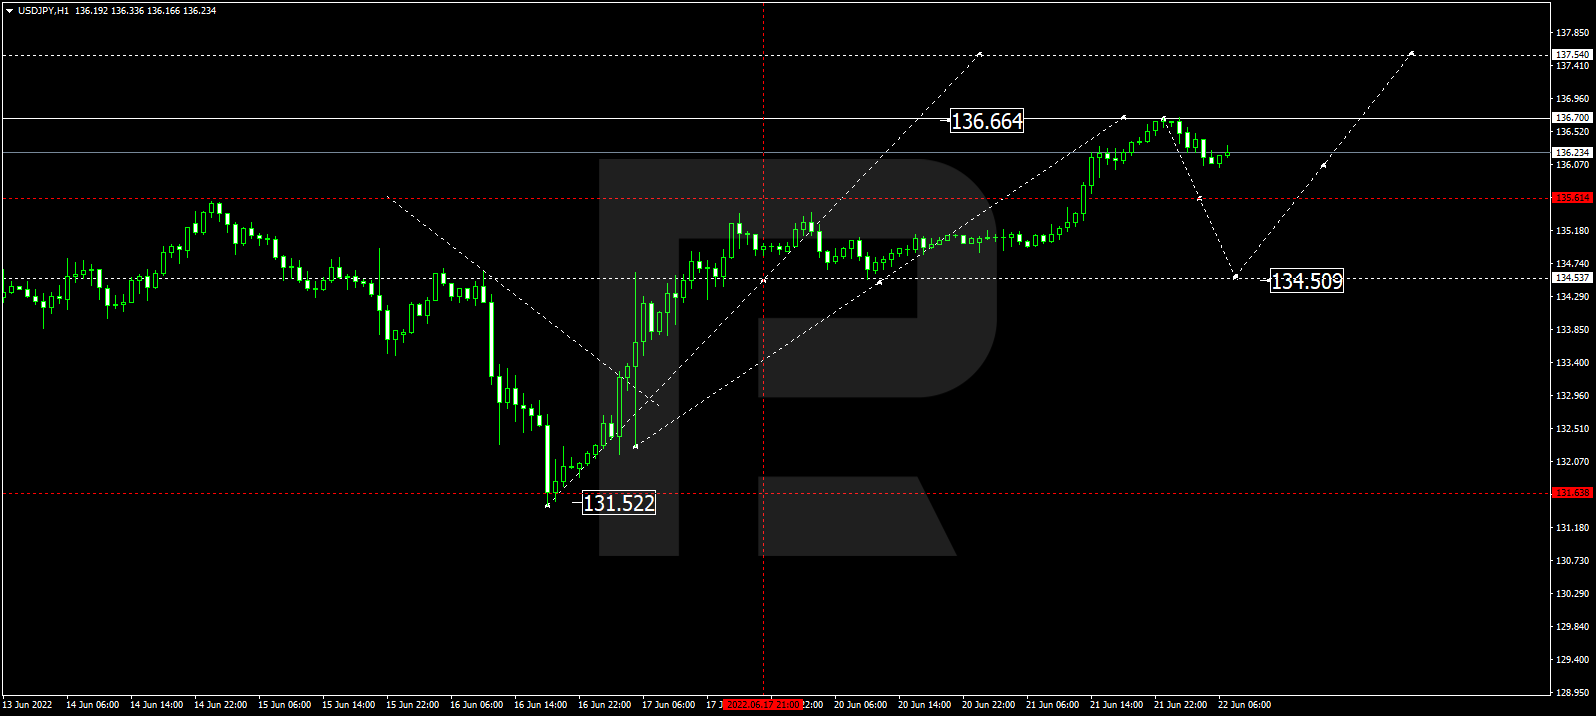
- Support levels: 134.10, 133.35, 131.67, 131.00, 130.12, 129.48, 128.76
- Resistance levels: 135.23, 135.77, 136.66
The medium-term trend on the USD/JPY currency pair is bullish, but the price corrected today to the moving average lines and canceled the final balance. This is a sign of buyers’ weakness. The MACD indicator is in the negative zone. Under such market conditions, buy trades can be considered from the support level of 134.10 or 133.35, but with confirmation. A resistance level of 135.23 is good for sell deals, but only with additional confirmation and short targets.
Alternative scenario: If the price fixes below 133.35, the downtrend will likely resume.

- – Japan National Core Consumer Price Index at 02:30 (GMT+3).
The USD/CAD currency pair
- Prev Open: 1.2945
- Prev Close: 1.2995
- % chg. over the last day: +0.39%
The Canadian dollar is a commodity currency, so it depends not only on the USD index dynamics but also on the oil quotes. The dollar index yesterday strengthened after the speech of Jerome Powell in front of Congress, while oil quotes went down. As a result, the Canadian dollar lost some ground. But worth noting that the Bank of Canada is on its way to raising interest rates, and the latest inflation data in Canada showed that inflation is not stopping. Therefore, on expectations of an aggressive rate hike at the next meeting, the Canadian dollar may get a boost soon.
- Support levels: 1.2966, 1.2893, 1.2815, 1.2709, 1.2618, 1.2578, 1.2510
- Resistance levels: 1.3068
In terms of technical analysis, the trend on the USD/CAD currency pair is bullish. The MACD indicator has become positive, and the buyers are showing their strength again. Under such market conditions, it is better to look for buy deals in the lower time frames from the support level of 1.2966. For sell deals, it is better to consider the resistance level of 1.3068, but it is also better with confirmation and short targets.
Alternative scenario: if the price breaks through and consolidates below the 1.2815 support level, the downtrend will likely resume.

By JustForex
This article reflects a personal opinion and should not be interpreted as an investment advice, and/or offer, and/or a persistent request for carrying out financial transactions, and/or a guarantee, and/or a forecast of future events.