
By InvestMacro | COT | Data Tables | COT Leaders | Downloads | COT Newsletter

Here are the latest charts and statistics for the Commitment of Traders (COT) data published by the Commodities Futures Trading Commission (CFTC).
The latest COT data is updated through Tuesday June 28th and shows a quick view of how large traders (for-profit speculators and commercial entities) were positioned in the futures markets. All currency positions are in direct relation to the US dollar where, for example, a bet for the euro is a bet that the euro will rise versus the dollar while a bet against the euro will be a bet that the euro will decline versus the dollar.
Currency market speculator bets were mostly higher this week as seven out of the eleven currency markets we cover had higher positioning while four markets had lower contracts.
Leading the gains for currency markets was the Mexican peso (12,890 contracts) and the British pound sterling (10,129 contracts) with the Japanese yen (5,884 contracts), Euro (5,009 contracts), Canadian dollar (4,992 contracts), New Zealand dollar (112 contracts) and Bitcoin (39 contracts) also showing a positive week.
Meanwhile, leading the declines in speculator bets this week were the Brazilian real (-7,317 contracts) and the Australian dollar (-2,374 contracts) with the US Dollar Index (-1,781 contracts) and the Swiss franc (-1,434 contracts) also registering lower bets on the week.
Highlighting the currency contracts this week was the cool off in bearish bets for both the British pound and the Japanese yen.
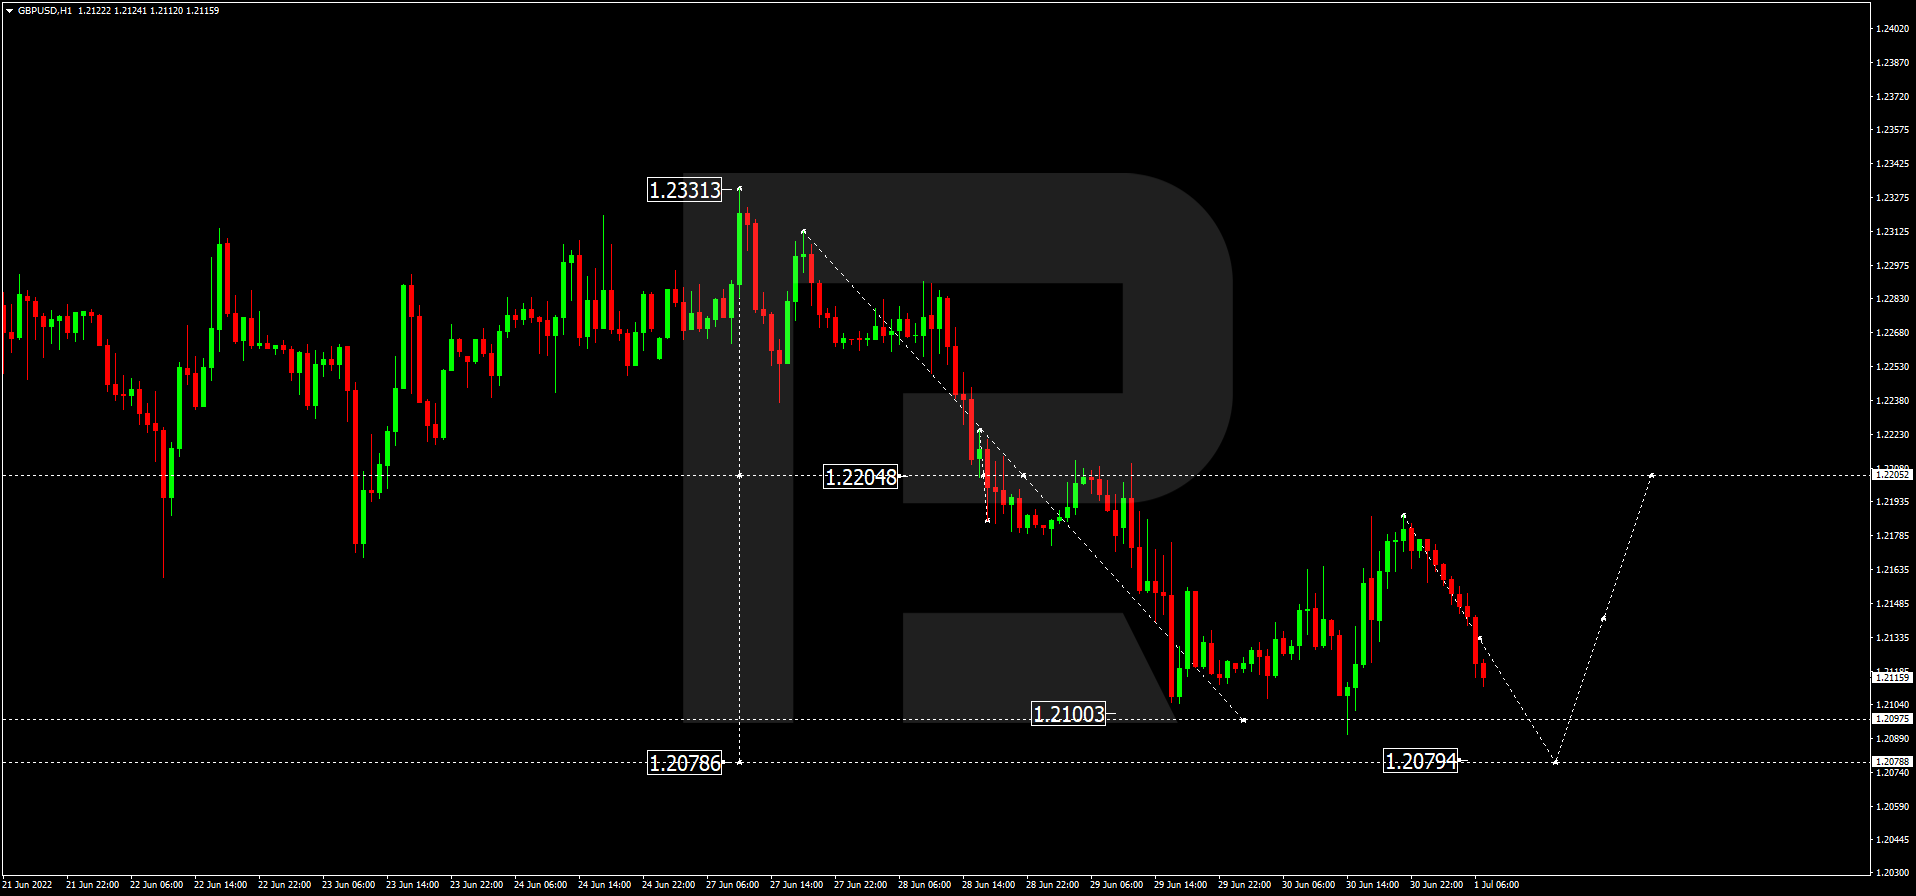
British pound sterling speculator positions rose for the fifth straight week and this week’s improvement pushed the overall position to the least bearish standing of the past eleven weeks. The GBP speculative standing has been in a continual bearish position since the middle of February but has come down from a total of -80,372 contracts on May 24th to a total of -53,118 contracts this week after the past five week’s improvement (by 27,254 contracts). The GBPUSD exchange rate has remained in a downtrend despite the recent cool off in speculator sentiment and touched below the 1.20 exchange this week for the second time this month.
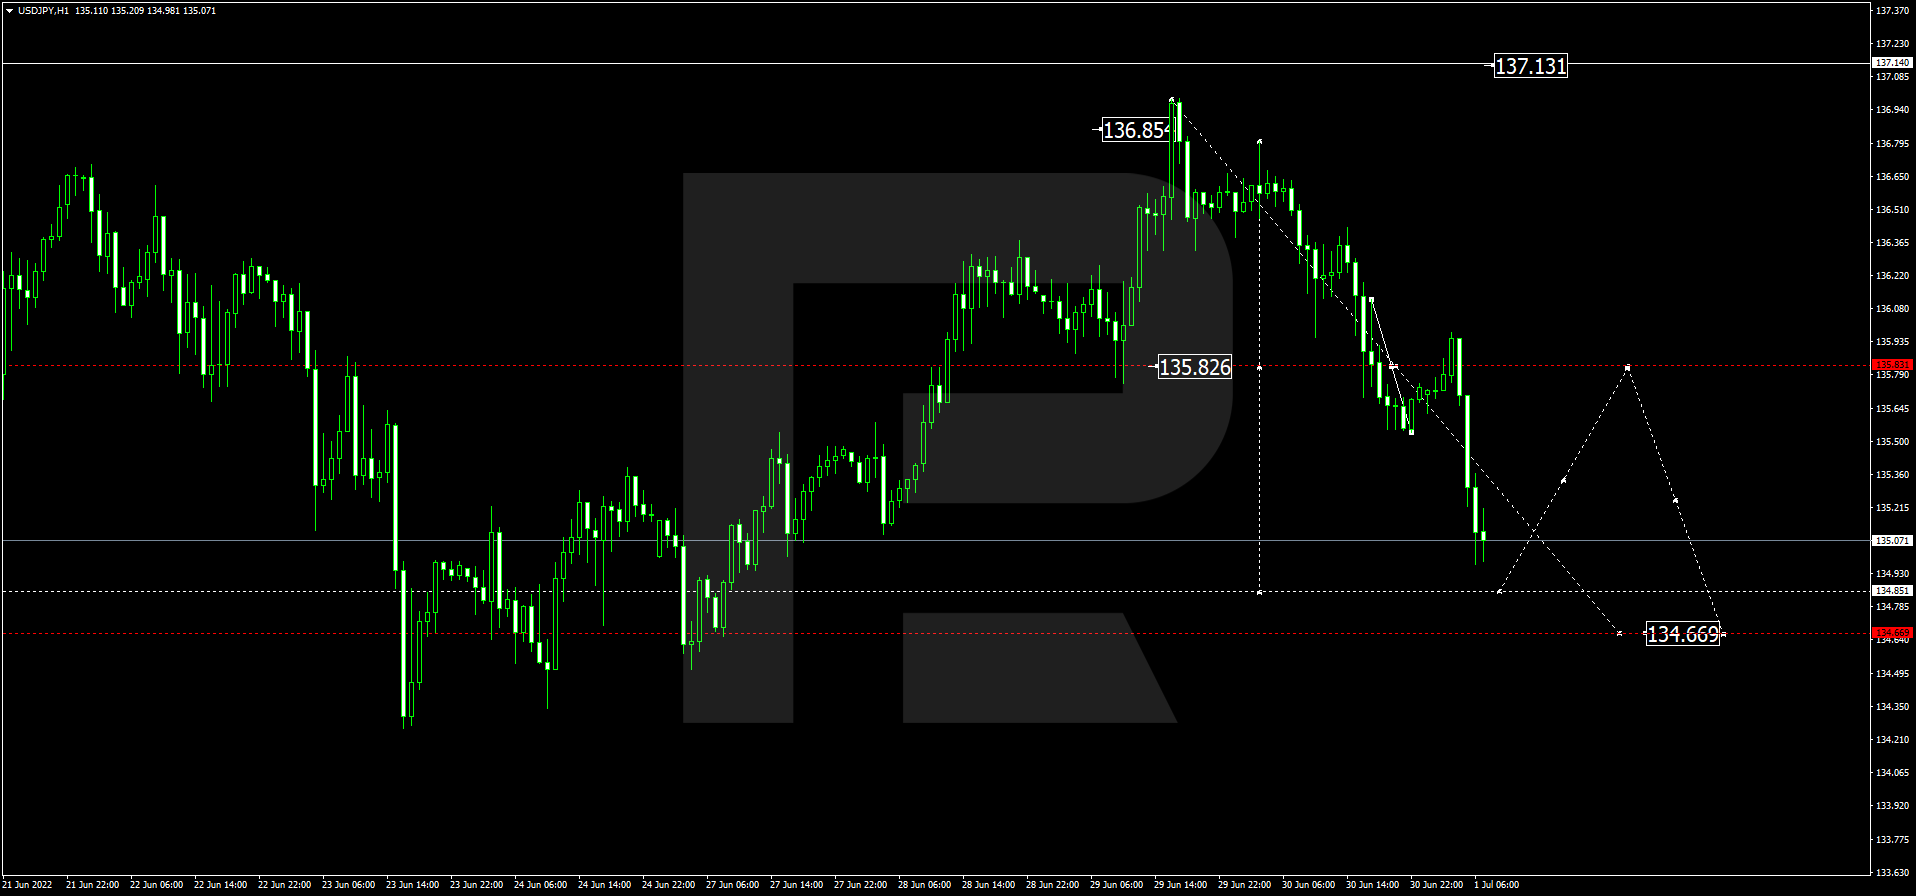
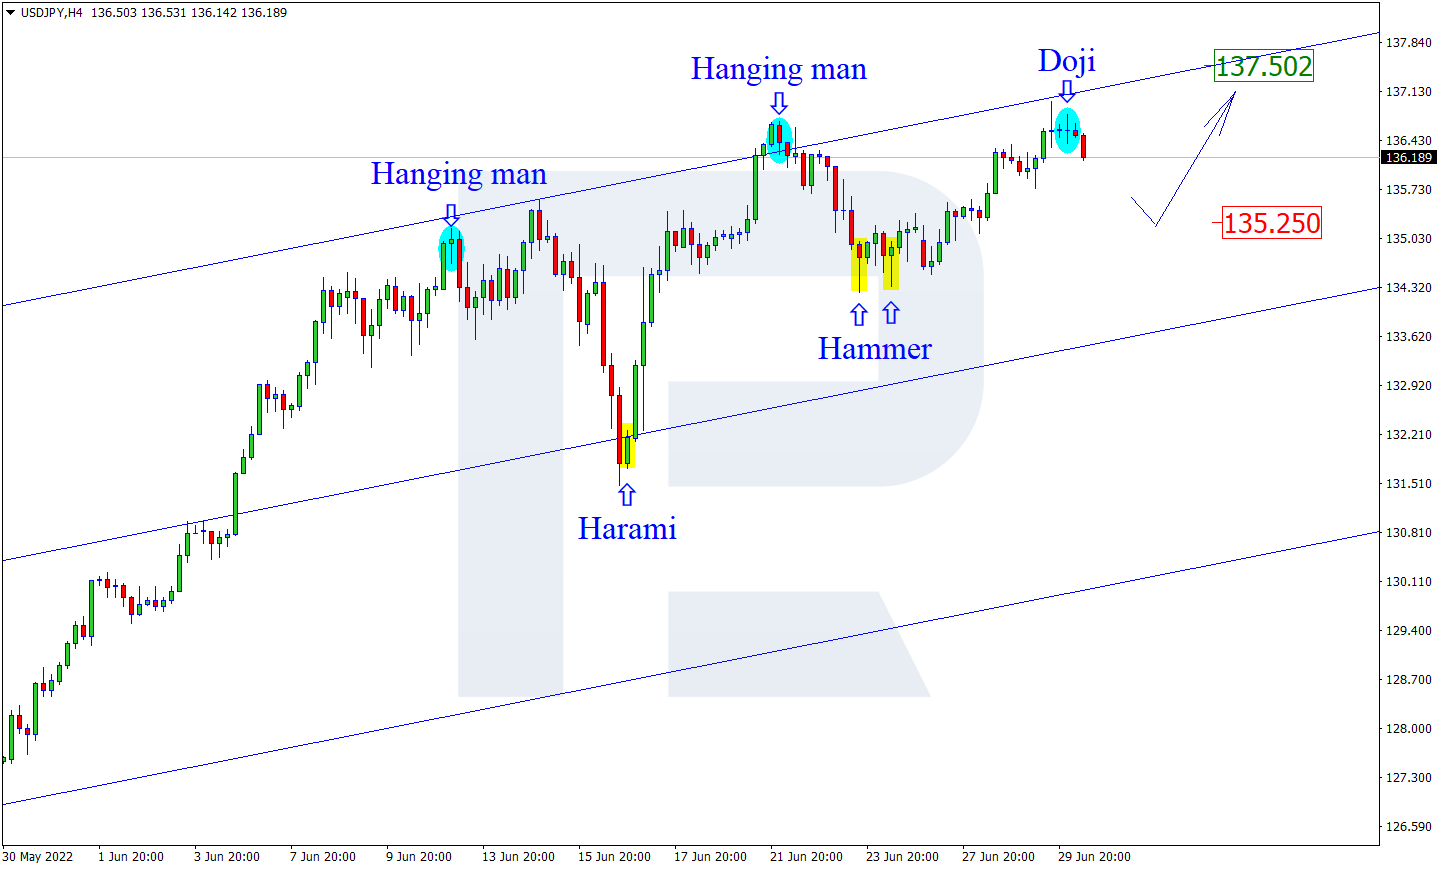
Japanese yen speculator bets rose for the seventh straight week this week and reached the least bearish position of the past 27 weeks. Japanese yen bets have been sharply bearish for over a year were at -110,454 contracts as recently as May 10th. The past seven weeks have shaved 57,884 contracts off the bearish level and brought the current speculative position to a total of -52,570 contracts this week. The exchange rate for the USDJPY currency pair remains at the top of its range (yen weakness) and near 20-year highs around 135.00.
In other currency contracts, the US Dollar Index speculator positions slid a bit this week after rising for six out of the previous seven weeks. The Dollar Index spec position had hit a new 5-year high last week at over +45,000 contracts and was at a 100 percent strength score (measured against past 3-years spec positioning). This week’s decline doesn’t dent the overall position much as the net position remains over +43,000 contracts for the third straight week. The Dollar Index futures price has remained strongly in an uptrend and reached a high over 105 this week before closing just below that figure at 104.91.

Strength scores (a measure of the 3-Year range of Speculator positions, from 0 to 100 where above 80 is extreme bullish and below 20 is extreme bearish) show that the Bitcoin (100 percent), the US Dollar Index (97 percent) and the Brazilian real (87 percent) are currently near the top of their ranges and in bullish extreme levels. The Mexican peso at 21 percent is at the lowest strength level currently and followed by the Euro at 32 percent.

Strength score trends (or move index, that calculate 6-week changes in strength scores) shows that the Japanese yen (31 percent) is on the greatest move of the past six weeks. The Canadian dollar (27 percent), New Zealand dollar (21 percent) and the Swiss franc (20 percent) round out the top movers in the latest data. The Mexican peso at -18 percent leads the downtrending currencies followed by the Euro at -10 percent and the Brazilian real at -1 percent.
| Jun-28-2022 | OI | OI-Index | Spec-Net | Spec-Index | Com-Net | COM-Index | Smalls-Net | Smalls-Index |
|---|---|---|---|---|---|---|---|---|
| USD Index | 63,143 | 96 | 43,229 | 97 | -46,558 | 2 | 3,329 | 53 |
| EUR | 671,472 | 70 | -10,596 | 32 | -19,812 | 70 | 30,408 | 25 |
| GBP | 228,736 | 57 | -53,118 | 36 | 70,230 | 71 | -17,112 | 20 |
| JPY | 213,767 | 64 | -52,570 | 37 | 67,895 | 69 | -15,325 | 22 |
| CHF | 40,123 | 21 | -8,591 | 35 | 17,862 | 72 | -9,271 | 26 |
| CAD | 142,584 | 25 | 9,097 | 50 | -12,247 | 59 | 3,150 | 36 |
| AUD | 139,891 | 37 | -42,980 | 45 | 47,163 | 54 | -4,183 | 42 |
| NZD | 40,337 | 25 | -5,311 | 62 | 8,551 | 44 | -3,240 | 14 |
| MXN | 193,536 | 46 | -13,980 | 21 | 9,107 | 77 | 4,873 | 64 |
| RUB | 20,930 | 4 | 7,543 | 31 | -7,150 | 69 | -393 | 24 |
| BRL | 60,107 | 54 | 37,028 | 87 | -38,531 | 14 | 1,503 | 82 |
| Bitcoin | 13,707 | 78 | 1,085 | 100 | -947 | 0 | -138 | 10 |
US Dollar Index Futures:
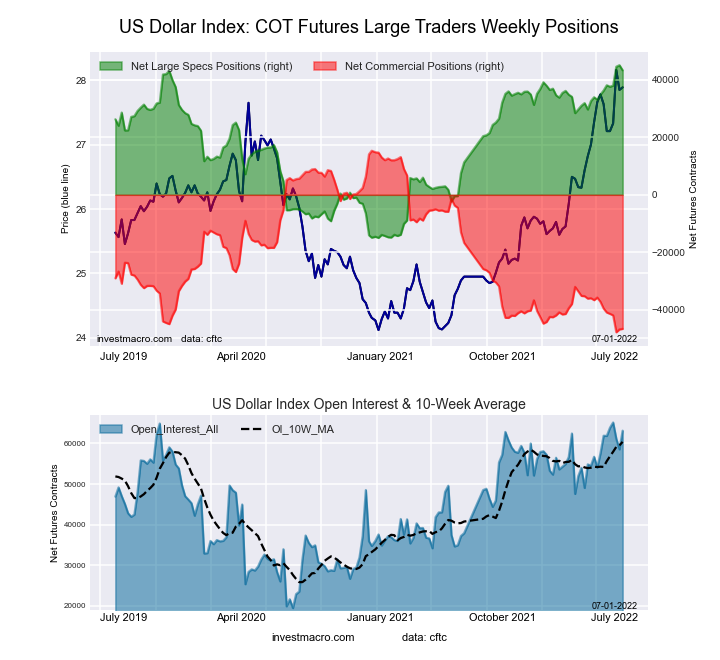 The US Dollar Index large speculator standing this week resulted in a net position of 43,229 contracts in the data reported through Tuesday. This was a weekly decline of -1,781 contracts from the previous week which had a total of 45,010 net contracts.
This week’s current strength score (the trader positioning range over the past three years, measured from 0 to 100) shows the speculators are currently Bullish-Extreme with a score of 97.0 percent. The commercials are Bearish-Extreme with a score of 1.9 percent and the small traders (not shown in chart) are Bullish with a score of 52.9 percent.
| US DOLLAR INDEX Statistics | SPECULATORS | COMMERCIALS | SMALL TRADERS |
| – Percent of Open Interest Longs: | 86.5 | 3.7 | 8.5 |
| – Percent of Open Interest Shorts: | 18.1 | 77.4 | 3.2 |
| – Net Position: | 43,229 | -46,558 | 3,329 |
| – Gross Longs: | 54,646 | 2,340 | 5,371 |
| – Gross Shorts: | 11,417 | 48,898 | 2,042 |
| – Long to Short Ratio: | 4.8 to 1 | 0.0 to 1 | 2.6 to 1 |
| NET POSITION TREND: | |||
| – Strength Index Score (3 Year Range Pct): | 97.0 | 1.9 | 52.9 |
| – Strength Index Reading (3 Year Range): | Bullish-Extreme | Bearish-Extreme | Bullish |
| NET POSITION MOVEMENT INDEX: | |||
| – 6-Week Change in Strength Index: | 11.7 | -11.2 | 0.4 |
Euro Currency Futures:
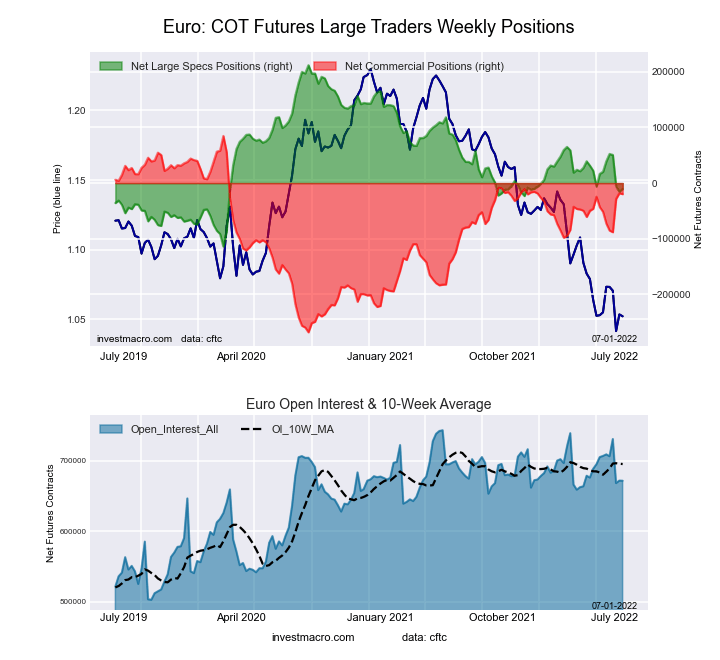 The Euro Currency large speculator standing this week resulted in a net position of -10,596 contracts in the data reported through Tuesday. This was a weekly advance of 5,009 contracts from the previous week which had a total of -15,605 net contracts.
This week’s current strength score (the trader positioning range over the past three years, measured from 0 to 100) shows the speculators are currently Bearish with a score of 31.7 percent. The commercials are Bullish with a score of 70.4 percent and the small traders (not shown in chart) are Bearish with a score of 24.8 percent.
| EURO Currency Statistics | SPECULATORS | COMMERCIALS | SMALL TRADERS |
| – Percent of Open Interest Longs: | 28.2 | 56.6 | 12.5 |
| – Percent of Open Interest Shorts: | 29.8 | 59.6 | 8.0 |
| – Net Position: | -10,596 | -19,812 | 30,408 |
| – Gross Longs: | 189,414 | 380,084 | 83,853 |
| – Gross Shorts: | 200,010 | 399,896 | 53,445 |
| – Long to Short Ratio: | 0.9 to 1 | 1.0 to 1 | 1.6 to 1 |
| NET POSITION TREND: | |||
| – Strength Index Score (3 Year Range Pct): | 31.7 | 70.4 | 24.8 |
| – Strength Index Reading (3 Year Range): | Bearish | Bullish | Bearish |
| NET POSITION MOVEMENT INDEX: | |||
| – 6-Week Change in Strength Index: | -9.5 | 9.0 | -1.3 |
British Pound Sterling Futures:
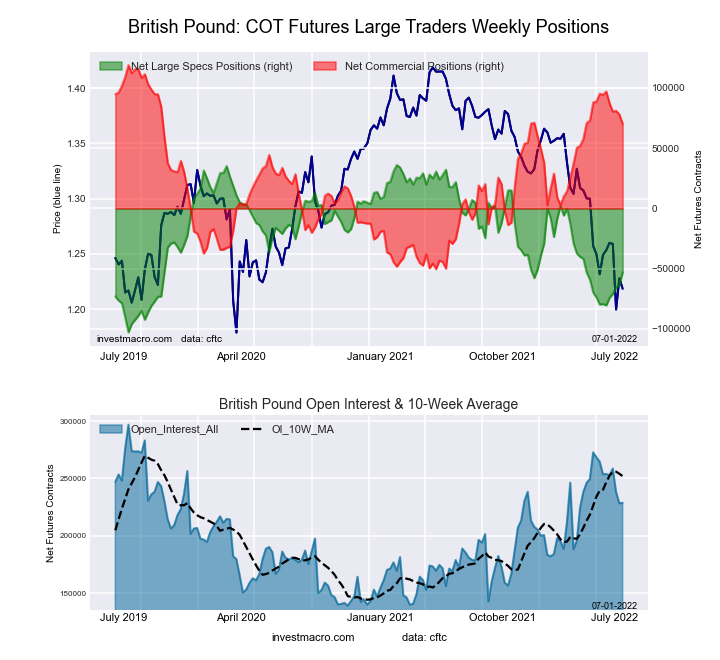 The British Pound Sterling large speculator standing this week resulted in a net position of -53,118 contracts in the data reported through Tuesday. This was a weekly advance of 10,129 contracts from the previous week which had a total of -63,247 net contracts.
This week’s current strength score (the trader positioning range over the past three years, measured from 0 to 100) shows the speculators are currently Bearish with a score of 35.7 percent. The commercials are Bullish with a score of 71.2 percent and the small traders (not shown in chart) are Bearish with a score of 20.2 percent.
| BRITISH POUND Statistics | SPECULATORS | COMMERCIALS | SMALL TRADERS |
| – Percent of Open Interest Longs: | 15.4 | 74.7 | 7.9 |
| – Percent of Open Interest Shorts: | 38.6 | 44.0 | 15.4 |
| – Net Position: | -53,118 | 70,230 | -17,112 |
| – Gross Longs: | 35,184 | 170,967 | 18,055 |
| – Gross Shorts: | 88,302 | 100,737 | 35,167 |
| – Long to Short Ratio: | 0.4 to 1 | 1.7 to 1 | 0.5 to 1 |
| NET POSITION TREND: | |||
| – Strength Index Score (3 Year Range Pct): | 35.7 | 71.2 | 20.2 |
| – Strength Index Reading (3 Year Range): | Bearish | Bullish | Bearish |
| NET POSITION MOVEMENT INDEX: | |||
| – 6-Week Change in Strength Index: | 18.8 | -14.3 | -4.2 |
Japanese Yen Futures:

The Japanese Yen large speculator standing this week resulted in a net position of -52,570 contracts in the data reported through Tuesday. This was a weekly boost of 5,884 contracts from the previous week which had a total of -58,454 net contracts.
This week’s current strength score (the trader positioning range over the past three years, measured from 0 to 100) shows the speculators are currently Bearish with a score of 36.5 percent. The commercials are Bullish with a score of 68.8 percent and the small traders (not shown in chart) are Bearish with a score of 22.3 percent.
| JAPANESE YEN Statistics | SPECULATORS | COMMERCIALS | SMALL TRADERS |
| – Percent of Open Interest Longs: | 17.1 | 71.1 | 10.5 |
| – Percent of Open Interest Shorts: | 41.6 | 39.4 | 17.6 |
| – Net Position: | -52,570 | 67,895 | -15,325 |
| – Gross Longs: | 36,462 | 152,071 | 22,379 |
| – Gross Shorts: | 89,032 | 84,176 | 37,704 |
| – Long to Short Ratio: | 0.4 to 1 | 1.8 to 1 | 0.6 to 1 |
| NET POSITION TREND: | |||
| – Strength Index Score (3 Year Range Pct): | 36.5 | 68.8 | 22.3 |
| – Strength Index Reading (3 Year Range): | Bearish | Bullish | Bearish |
| NET POSITION MOVEMENT INDEX: | |||
| – 6-Week Change in Strength Index: | 30.6 | -23.0 | -5.2 |
Swiss Franc Futures:
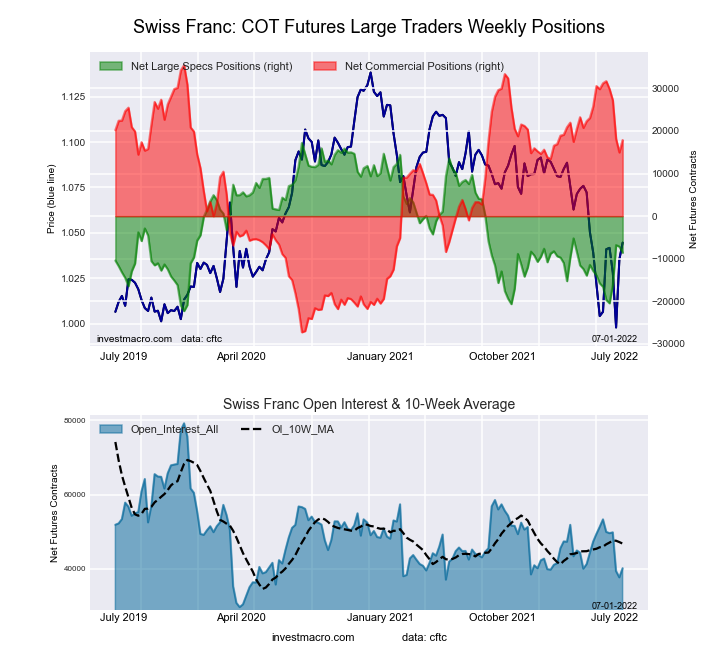 The Swiss Franc large speculator standing this week resulted in a net position of -8,591 contracts in the data reported through Tuesday. This was a weekly reduction of -1,434 contracts from the previous week which had a total of -7,157 net contracts.
This week’s current strength score (the trader positioning range over the past three years, measured from 0 to 100) shows the speculators are currently Bearish with a score of 34.7 percent. The commercials are Bullish with a score of 72.0 percent and the small traders (not shown in chart) are Bearish with a score of 26.1 percent.
| SWISS FRANC Statistics | SPECULATORS | COMMERCIALS | SMALL TRADERS |
| – Percent of Open Interest Longs: | 11.3 | 64.8 | 23.9 |
| – Percent of Open Interest Shorts: | 32.7 | 20.3 | 47.0 |
| – Net Position: | -8,591 | 17,862 | -9,271 |
| – Gross Longs: | 4,523 | 25,994 | 9,588 |
| – Gross Shorts: | 13,114 | 8,132 | 18,859 |
| – Long to Short Ratio: | 0.3 to 1 | 3.2 to 1 | 0.5 to 1 |
| NET POSITION TREND: | |||
| – Strength Index Score (3 Year Range Pct): | 34.7 | 72.0 | 26.1 |
| – Strength Index Reading (3 Year Range): | Bearish | Bullish | Bearish |
| NET POSITION MOVEMENT INDEX: | |||
| – 6-Week Change in Strength Index: | 20.3 | -21.2 | 18.0 |
Canadian Dollar Futures:

The Canadian Dollar large speculator standing this week resulted in a net position of 9,097 contracts in the data reported through Tuesday. This was a weekly gain of 4,992 contracts from the previous week which had a total of 4,105 net contracts.
This week’s current strength score (the trader positioning range over the past three years, measured from 0 to 100) shows the speculators are currently Bearish with a score of 49.6 percent. The commercials are Bullish with a score of 58.5 percent and the small traders (not shown in chart) are Bearish with a score of 36.4 percent.
| CANADIAN DOLLAR Statistics | SPECULATORS | COMMERCIALS | SMALL TRADERS |
| – Percent of Open Interest Longs: | 32.2 | 45.9 | 20.7 |
| – Percent of Open Interest Shorts: | 25.8 | 54.5 | 18.5 |
| – Net Position: | 9,097 | -12,247 | 3,150 |
| – Gross Longs: | 45,893 | 65,407 | 29,537 |
| – Gross Shorts: | 36,796 | 77,654 | 26,387 |
| – Long to Short Ratio: | 1.2 to 1 | 0.8 to 1 | 1.1 to 1 |
| NET POSITION TREND: | |||
| – Strength Index Score (3 Year Range Pct): | 49.6 | 58.5 | 36.4 |
| – Strength Index Reading (3 Year Range): | Bearish | Bullish | Bearish |
| NET POSITION MOVEMENT INDEX: | |||
| – 6-Week Change in Strength Index: | 26.5 | -20.7 | 2.5 |
Australian Dollar Futures:
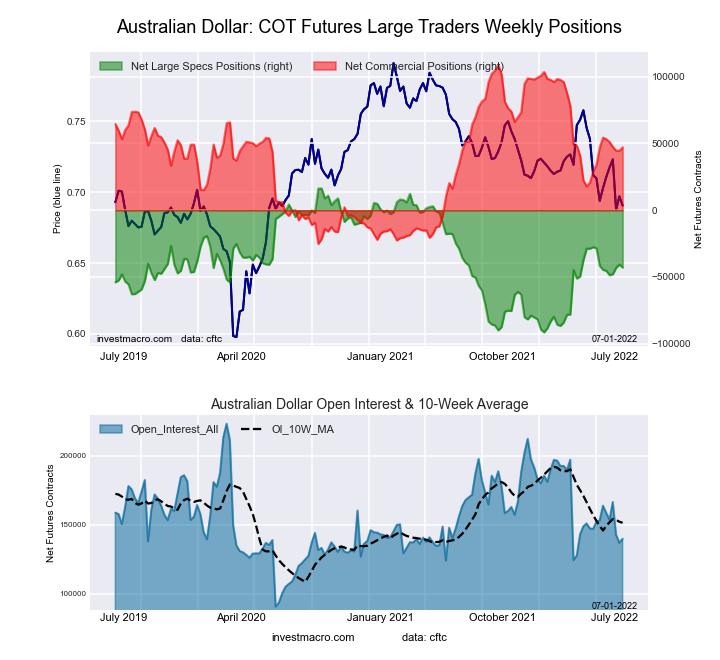 The Australian Dollar large speculator standing this week resulted in a net position of -42,980 contracts in the data reported through Tuesday. This was a weekly decrease of -2,374 contracts from the previous week which had a total of -40,606 net contracts.
This week’s current strength score (the trader positioning range over the past three years, measured from 0 to 100) shows the speculators are currently Bearish with a score of 45.0 percent. The commercials are Bullish with a score of 54.1 percent and the small traders (not shown in chart) are Bearish with a score of 42.2 percent.
| AUSTRALIAN DOLLAR Statistics | SPECULATORS | COMMERCIALS | SMALL TRADERS |
| – Percent of Open Interest Longs: | 20.6 | 61.7 | 14.1 |
| – Percent of Open Interest Shorts: | 51.4 | 28.0 | 17.1 |
| – Net Position: | -42,980 | 47,163 | -4,183 |
| – Gross Longs: | 28,887 | 86,347 | 19,791 |
| – Gross Shorts: | 71,867 | 39,184 | 23,974 |
| – Long to Short Ratio: | 0.4 to 1 | 2.2 to 1 | 0.8 to 1 |
| NET POSITION TREND: | |||
| – Strength Index Score (3 Year Range Pct): | 45.0 | 54.1 | 42.2 |
| – Strength Index Reading (3 Year Range): | Bearish | Bullish | Bearish |
| NET POSITION MOVEMENT INDEX: | |||
| – 6-Week Change in Strength Index: | 1.5 | -5.4 | 13.7 |
New Zealand Dollar Futures:
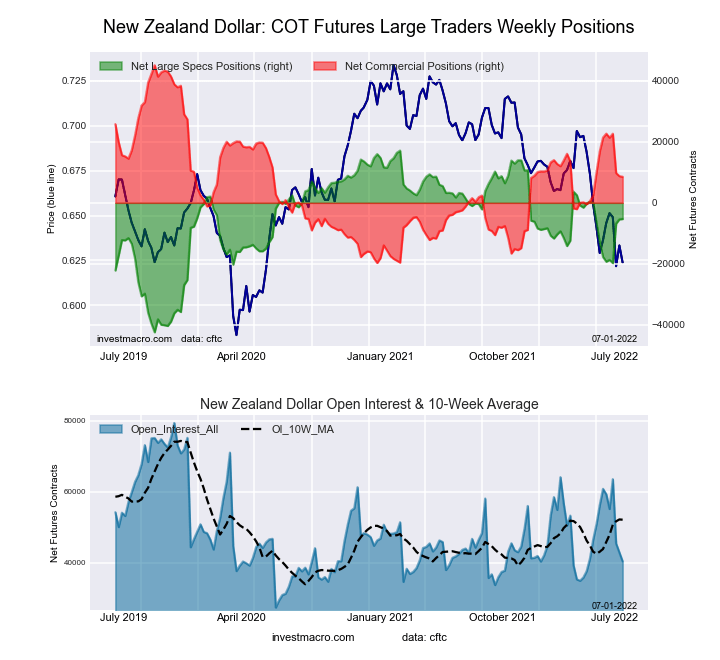 The New Zealand Dollar large speculator standing this week resulted in a net position of -5,311 contracts in the data reported through Tuesday. This was a weekly gain of 112 contracts from the previous week which had a total of -5,423 net contracts.
This week’s current strength score (the trader positioning range over the past three years, measured from 0 to 100) shows the speculators are currently Bullish with a score of 62.4 percent. The commercials are Bearish with a score of 43.6 percent and the small traders (not shown in chart) are Bearish-Extreme with a score of 14.4 percent.
| NEW ZEALAND DOLLAR Statistics | SPECULATORS | COMMERCIALS | SMALL TRADERS |
| – Percent of Open Interest Longs: | 29.1 | 64.9 | 5.6 |
| – Percent of Open Interest Shorts: | 42.2 | 43.7 | 13.6 |
| – Net Position: | -5,311 | 8,551 | -3,240 |
| – Gross Longs: | 11,720 | 26,167 | 2,256 |
| – Gross Shorts: | 17,031 | 17,616 | 5,496 |
| – Long to Short Ratio: | 0.7 to 1 | 1.5 to 1 | 0.4 to 1 |
| NET POSITION TREND: | |||
| – Strength Index Score (3 Year Range Pct): | 62.4 | 43.6 | 14.4 |
| – Strength Index Reading (3 Year Range): | Bullish | Bearish | Bearish-Extreme |
| NET POSITION MOVEMENT INDEX: | |||
| – 6-Week Change in Strength Index: | 20.9 | -19.8 | 4.4 |
Mexican Peso Futures:

The Mexican Peso large speculator standing this week resulted in a net position of -13,980 contracts in the data reported through Tuesday. This was a weekly boost of 12,890 contracts from the previous week which had a total of -26,870 net contracts.
This week’s current strength score (the trader positioning range over the past three years, measured from 0 to 100) shows the speculators are currently Bearish with a score of 21.4 percent. The commercials are Bullish with a score of 76.6 percent and the small traders (not shown in chart) are Bullish with a score of 63.7 percent.
| MEXICAN PESO Statistics | SPECULATORS | COMMERCIALS | SMALL TRADERS |
| – Percent of Open Interest Longs: | 55.3 | 40.9 | 3.6 |
| – Percent of Open Interest Shorts: | 62.5 | 36.1 | 1.1 |
| – Net Position: | -13,980 | 9,107 | 4,873 |
| – Gross Longs: | 107,031 | 79,060 | 7,059 |
| – Gross Shorts: | 121,011 | 69,953 | 2,186 |
| – Long to Short Ratio: | 0.9 to 1 | 1.1 to 1 | 3.2 to 1 |
| NET POSITION TREND: | |||
| – Strength Index Score (3 Year Range Pct): | 21.4 | 76.6 | 63.7 |
| – Strength Index Reading (3 Year Range): | Bearish | Bullish | Bullish |
| NET POSITION MOVEMENT INDEX: | |||
| – 6-Week Change in Strength Index: | -18.0 | 17.2 | 3.6 |
Brazilian Real Futures:
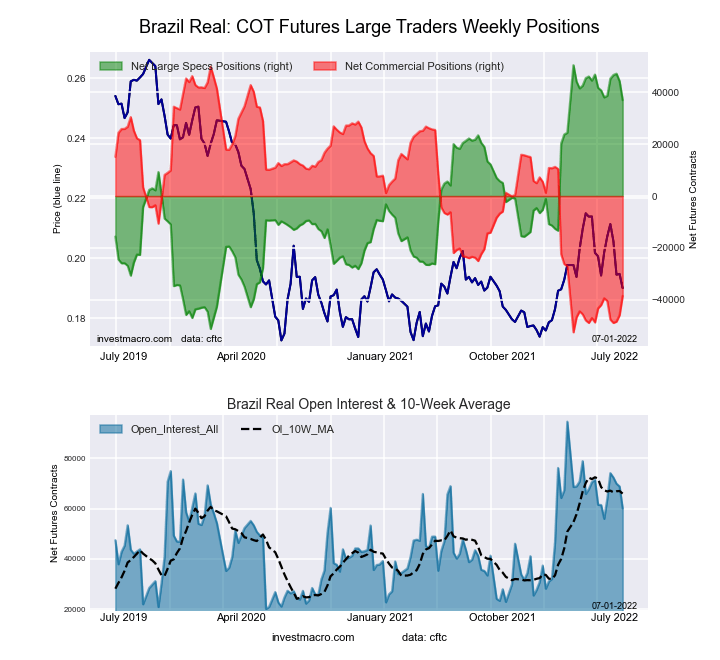 The Brazilian Real large speculator standing this week resulted in a net position of 37,028 contracts in the data reported through Tuesday. This was a weekly lowering of -7,317 contracts from the previous week which had a total of 44,345 net contracts.
This week’s current strength score (the trader positioning range over the past three years, measured from 0 to 100) shows the speculators are currently Bullish-Extreme with a score of 86.8 percent. The commercials are Bearish-Extreme with a score of 13.7 percent and the small traders (not shown in chart) are Bullish-Extreme with a score of 82.4 percent.
| BRAZIL REAL Statistics | SPECULATORS | COMMERCIALS | SMALL TRADERS |
| – Percent of Open Interest Longs: | 71.7 | 22.8 | 5.5 |
| – Percent of Open Interest Shorts: | 10.1 | 86.9 | 3.0 |
| – Net Position: | 37,028 | -38,531 | 1,503 |
| – Gross Longs: | 43,088 | 13,691 | 3,307 |
| – Gross Shorts: | 6,060 | 52,222 | 1,804 |
| – Long to Short Ratio: | 7.1 to 1 | 0.3 to 1 | 1.8 to 1 |
| NET POSITION TREND: | |||
| – Strength Index Score (3 Year Range Pct): | 86.8 | 13.7 | 82.4 |
| – Strength Index Reading (3 Year Range): | Bullish-Extreme | Bearish-Extreme | Bullish-Extreme |
| NET POSITION MOVEMENT INDEX: | |||
| – 6-Week Change in Strength Index: | -1.0 | 0.9 | 1.9 |
Bitcoin Futures:

The Bitcoin large speculator standing this week resulted in a net position of 1,085 contracts in the data reported through Tuesday. This was a weekly gain of 39 contracts from the previous week which had a total of 1,046 net contracts.
This week’s current strength score (the trader positioning range over the past three years, measured from 0 to 100) shows the speculators are currently Bullish-Extreme with a score of 100.0 percent. The commercials are Bearish-Extreme with a score of 2.8 percent and the small traders (not shown in chart) are Bearish-Extreme with a score of 9.8 percent.
| BITCOIN Statistics | SPECULATORS | COMMERCIALS | SMALL TRADERS |
| – Percent of Open Interest Longs: | 81.3 | 0.8 | 6.5 |
| – Percent of Open Interest Shorts: | 73.3 | 7.7 | 7.5 |
| – Net Position: | 1,085 | -947 | -138 |
| – Gross Longs: | 11,137 | 115 | 890 |
| – Gross Shorts: | 10,052 | 1,062 | 1,028 |
| – Long to Short Ratio: | 1.1 to 1 | 0.1 to 1 | 0.9 to 1 |
| NET POSITION TREND: | |||
| – Strength Index Score (3 Year Range Pct): | 100.0 | 2.8 | 9.8 |
| – Strength Index Reading (3 Year Range): | Bullish-Extreme | Bearish-Extreme | Bearish-Extreme |
| NET POSITION MOVEMENT INDEX: | |||
| – 6-Week Change in Strength Index: | 5.1 | -4.2 | -4.7 |
Article By InvestMacro – Receive our weekly COT Reports by Email
*COT Report: The COT data, released weekly to the public each Friday, is updated through the most recent Tuesday (data is 3 days old) and shows a quick view of how large speculators or non-commercials (for-profit traders) were positioned in the futures markets.
The CFTC categorizes trader positions according to commercial hedgers (traders who use futures contracts for hedging as part of the business), non-commercials (large traders who speculate to realize trading profits) and nonreportable traders (usually small traders/speculators) as well as their open interest (contracts open in the market at time of reporting).See CFTC criteria here.


