Archive for Forex and Currency News – Page 121

Ichimoku Cloud Analysis 25.07.2022 (GBPUSD, BRENT, USDJPY)

Article By RoboForex.com

GBPUSD, “Great Britain Pound vs US Dollar”

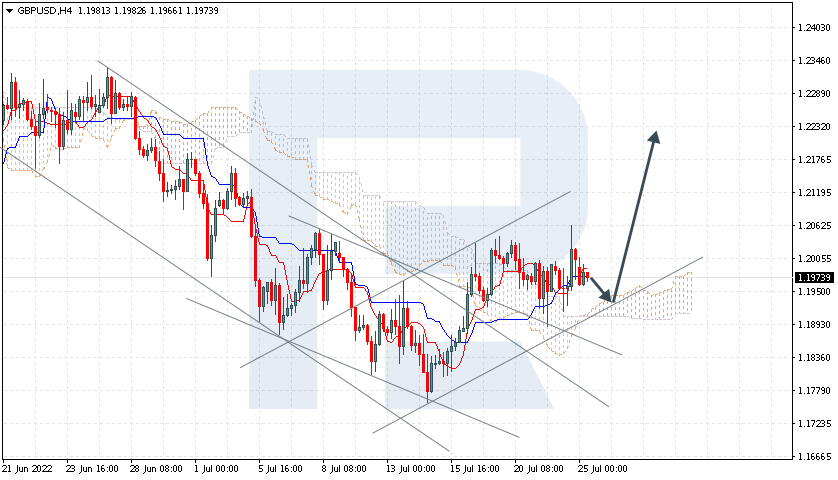
GBPUSD is testing Tenkan-Sen and Kijun-Sen. The instrument is currently moving above Ichimoku Cloud, thus indicating an ascending tendency. The markets could indicate that the price may test the cloud’s upside border at 1.1935 and then resume moving upwards to reach 1.2235. Another signal in favour of a further uptrend will be a rebound from the rising channel’s downside border. However, the bullish scenario may no longer be valid if the price breaks the cloud’s downside border and fixes below 1.1875. In this case, the pair may continue falling towards 1.1685.

GBPUSD
Risk Warning: the result of previous trading operations do not guarantee the same results in the future

BRENT

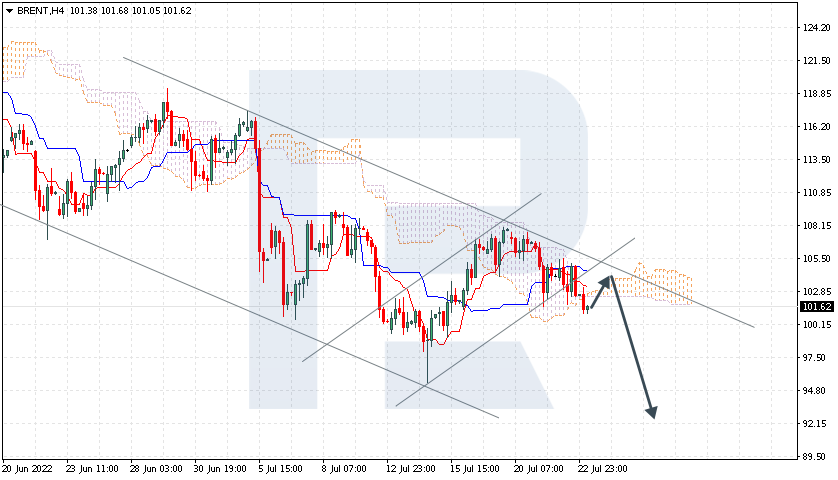
Brent is falling within the bearish channel. The instrument is currently moving below Ichimoku Cloud, thus indicating a descending tendency. The markets could indicate that the price may test the cloud’s upside border at 103.05 and then resume moving downwards to reach 92.15. Another signal in favour of a further downtrend will be a rebound from the descending channel’s upside border. However, the bearish scenario may no longer be valid if the price breaks the cloud’s upside border and fixes above 106.05. In this case, the pair may continue growing towards 110.55.

BRENT
Risk Warning: the result of previous trading operations do not guarantee the same results in the future

USDJPY, “US Dollar vs Japanese Yen”

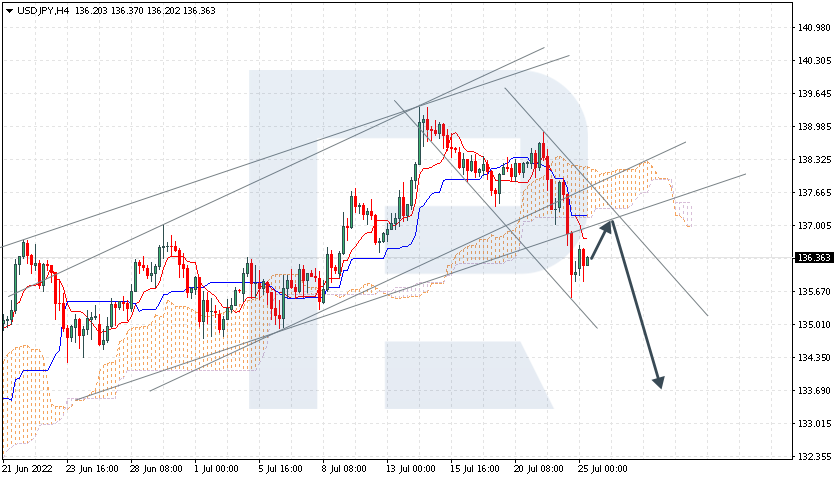
USDJPY is rebounding from the support area. The instrument is currently moving below Ichimoku Cloud, thus indicating a descending tendency. The markets could indicate that the price may test Tenkan-Sen at 137.00 and then resume moving upwards to reach 133.70. Another signal in favour of a further downtrend will be a rebound from the rising channel’s downside border. However, the bearish scenario may no longer be valid if the price breaks the cloud’s upside border and fixes above 138.75. In this case, the pair may continue growing towards 139.65.

USDJPY

Article By RoboForex.com

Attention!
Forecasts presented in this section only reflect the author’s private opinion and should not be considered as guidance for trading. RoboForex LP bears no responsibility for trading results based on trading recommendations described in these analytical reviews.

The Analytical Overview of the Main Currency Pairs on 2022.07.25

By JustForex

The EUR/USD currency pair

Technical indicators of the currency pair:
  • Prev Open: 1.0226
  • Prev Close: 1.0215
  • % chg. over the last day: -0.11%

The European Central Bank joined many other central banks in raising interest rates last week as its focus was on fighting inflation rather than a potential economic slowdown. On Friday, ECB chief Christine Lagarde said that the ECB would raise rates as much as needed to bring inflation back to target levels. By narrowing the interest rate differential, the euro has temporarily strengthened. But it should be noted that the US Federal Reserve will raise interest rates by 0.75-1% this week, which will widen the rates spread, causing the EUR/USD quotes to fall below parity again.

Trading recommendations
  • Support levels: 1.0181, 1.0106, 1.0035, 1.0000
  • Resistance levels: 1.0220, 1.0284, 1.0365, 1.0415, 1.050

From the technical point of view, the trend on the EUR/USD currency pair on the hour time frame is bullish. The price is forming a wide balance, and the MACD indicator has become inactive, but the buyers’ pressure remains. Under such market conditions, it is best to look for buy trades on intraday time frames from the support level of 1.0181 or 1.0106, but only with confirmation. Sell trades can be considered from the resistance level of 1.0220 or 1.0284, but only after additional confirmation and with short targets.

Alternative scenario: if the price breaks down through the 1.0000 support level and fixes below, the downtrend will likely resume.

EUR/USD
News feed for 2022.07.25:
  • – Eurozone German Ifo Business Climate (m/m) at 11:00 (GMT+3).

The GBP/USD currency pair

Technical indicators of the currency pair:
  • Prev Open: 1.1989
  • Prev Close: 1.2006
  • % chg. over the last day: -0.15%

Over the past month, the UK Manufacturing PMI has fallen from 52.8 to 52.2, while the service sector PMI has fallen from 54.3 to 53.3. This is weak data for the economy. The closer the index is to level 50, the closer the recession is. Statistically, if the PMI falls below 50, amid falling GDP, officials declare a recession. Volatile energy prices and a tight labor market have already caused Bank of England policymakers to oscillate between aggressively raising interest rates and the need to protect the economy from rising prices. With its open economy and huge current account deficit, the UK remains very vulnerable.

Trading recommendations
  • Support levels: 1.1964, 1.1907, 1.1803
  • Resistance levels: 1.2085, 1.2137

From the technical point of view, the trend on the GBP/USD currency pair on the hourly time frame is bullish. The price is trading at the level of the moving averages. The MACD indicator has become inactive. Under such market conditions, it is best to look for buy trades on intraday time frames from the support level of 1.1964 or 1.1907, but only with confirmation. Sell trades can be considered intraday from the resistance level of 1.2085, but only after additional confirmation and with short targets.

Alternative scenario: if the price breaks down through the 1.1803 support level and fixes below, the downtrend will likely resume.

GBP/USD
There is no news feed for today.

The USD/JPY currency pair

Technical indicators of the currency pair:
  • Prev Open: 137.34
  • Prev Close: 136.06
  • % chg. over the last day: -0.94%

From the fundamental point of view, nothing has changed on the USD/JPY currency pair, as the Bank of Japan is still keeping its soft monetary policy. At the same time, the US Federal Reserve will raise the rate by another 0.75-1% this week and increase the difference between the US and Japanese rates even more. Even so, Japan’s yen has temporarily strengthened on the back of the dollar, which in turn declined at the end of last week due to the strengthening euro as the ECB raised the interest rate unexpectedly by 0.5%.

Trading recommendations
  • Support levels: 135.99, 135.40, 134.64, 134.11
  • Resistance levels: 136.60, 137.26, 137.81, 138.25, 138.56, 140.29

From the technical point of view, the medium-term trend on the USD/JPY currency pair has changed to bearish. The price has consolidated below the moving averages and broke through the priority change level. But it should be understood that this fall is not accompanied by any fundamental factors, so it is still necessary to be cautious when selling. Under such market conditions, buy trades can be searched for intraday from the support level of 135.99, but with additional confirmation. For sell deals, traders can consider the resistance level of 136.60 or 137.26, but only with additional confirmation and short targets.

Alternative scenario: If the price fixes above 138.25, the uptrend will likely resume.

USD/JPY
There is no news feed for today.

The USD/CAD currency pair

Technical indicators of the currency pair:
  • Prev Open: 1.2865
  • Prev Close: 1.2914
  • % chg. over the last day: +0.38%

Canadian retail sales data for May increased by 1.6% on Friday, beating expectations of 1.2%. Retail sales excluding cars were also stronger than expected, +1.9% compared to the market forecast of 1.6% (m/m). But the Canadian dollar ended the day lower due to lower oil prices.

Trading recommendations
  • Support levels: 1.2862, 1.2781
  • Resistance levels: 1.2934, 1.3006, 1.3085, 1.3154

In terms of technical analysis, the trend on the USD/CAD currency pair is bearish. At the moment, the price is forming a balance and is trading at the levels of the moving lines. The MACD indicator has become inactive. Under such market conditions, it is best to consider sell deals from the resistance level of 1.2934, but with confirmation. Buy trades should be viewed on the lower time frames from the support level of 1.2862, but only with confirmation and short targets.

Alternative scenario: if the price breaks out and consolidates above the 1.3085 resistance level, the uptrend will likely resume.

USD/CAD
There is no news feed for today.

By JustForex


This article reflects a personal opinion and should not be interpreted as an investment advice, and/or offer, and/or a persistent request for carrying out financial transactions, and/or a guarantee, and/or a forecast of future events.

The Reserve Bank of Australia’s Comments Support AUD

By RoboForex Analytical Department

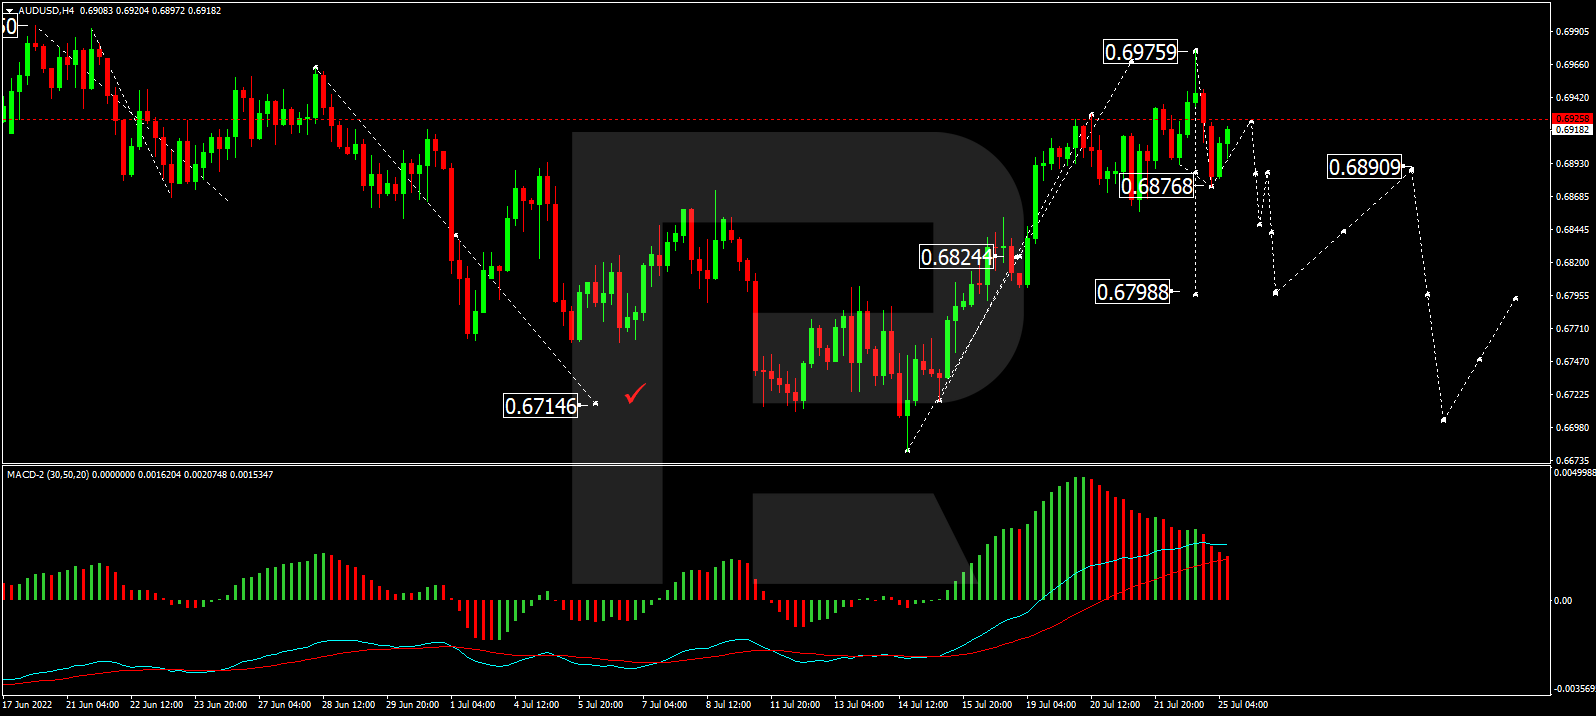
AUD/USD is balancing at 0.6083 on Monday. The bulls managed to break the descending channel and they stand a good chance of starting a new ascending tendency in the near future.

The RBA Governor is ready to tighten the regulator’s monetary policy by doubling the benchmark interest rate. The reason for this announcement is simple – it’s necessary to push inflation back to its target of 2-3%. Market players tend to respond to such comments, that’s why the AUD got significant support.

The quarterly CPI report is scheduled to be released as early as Wednesday and it is expected to show further growth in inflation, which has already reached its 20-year highs. Another important report, Retail Sales, will be published on Thursday and no positive dynamics are expected here as well. If this indicator is also far below expectations, the risks of a rate-hike by the RBA will increase, helping the AUD to continue its uptrend.

It should be noted that early in the year Philip Lowe wasn’t ready for monetary policy tightening and said that he couldn’t see the rate going up in 2022. However, high inflation forced the regulator to take emergency measures and start raising the rate.

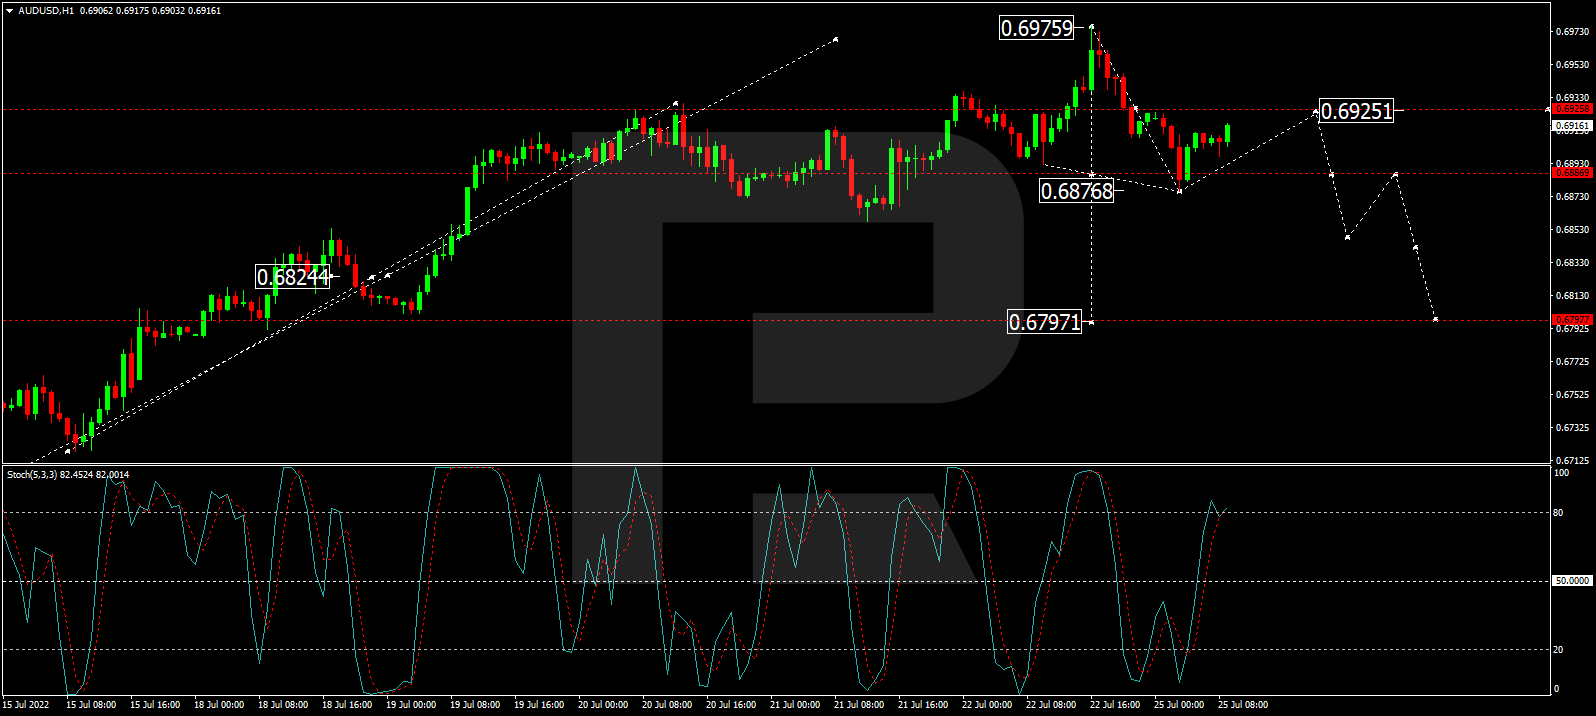
As we can see in the H4 chart, after finishing the first descending impulse at 0.6876, AUD/USD is correcting upwards to reach 0.6925 and may later form another descending impulse towards 0.6886. Later, the market may break the latter level and continue trading within the downtrend with the target at 0.6850, or even extend this structure down to 0.6798. From the technical point of view, this scenario is confirmed by the MACD Oscillator: after leaving the histogram area, its signal line is about to fall and reach 0.

In the H1 chart, having completed the five-wave structure of the first descending impulse at 0.6875, AUD/USD is correcting upwards to reach 0.6925 and may later fall towards 0.6888, thus forming a new consolidation range between the two latter levels. After that, the instrument may break the range to the downside and form a new descending structure with the target at 0.6850. From the technical point of view, this scenario is confirmed by the Stochastic Oscillator: its signal line is moving above 80 and may soon start falling to break 50. Later, it may continue moving down to 20.

Disclaimer

Any forecasts contained herein are based on the author’s particular opinion. This analysis may not be treated as trading advice. RoboForex bears no responsibility for trading results based on trading recommendations and reviews contained herein.

Trade Of The Week: Can Fed Satisfy Dollar Bulls?

By ForexTime 

The phrase “what goes up must eventually come down” springs to mind when looking at the dollar’s performance over the last few days.

We have seen the king of currency space loosen some grip on the FX throne thanks to a combination of profit-taking and reduced bets over how aggressive the Fed will be when raising rates this month. Appetite for the world’s most liquid currency has also been dampened by the improving market mood and recent fall in Treasury yields.

To be fair, the mighty dollar still has a domineering presence and this can be reflected in the month-to-date gains against most G10 currencies. However, the fuel could be running low for dollar bulls with a fresh fundamental spark needed to not only fill up the tank but keep the engines running at maximum speed.

Taking a brief look at the equally weighted dollar index, prices are under pressure on the H4 charts with bears eyeing the 1.1700 support.

After ruling over the FX arena since the start of 2022, are dollar bulls throwing in the towel or just taking a short break? It may be too early to answer this question due to the various fundamental forces at play. However, the dollar’s reaction to the Fed meeting on Wednesday and economic data this week could offer some fresh insight.

The low down…

The dollar got no love last week thanks to the risk-on mood and easing in longer-term inflation expectations.

In mid-July, there was a lot of chatter around the Federal Reserve potentially raising benchmark interest rates by a whopping 100 basis points to tame inflation. The drop in consumer inflation expectations for July trimmed expectations around the Fed making such a move. According to Bloomberg, the probability of a 100-basis point rate hike this month stands at 10%, as of writing.

This development could add more flavour and spice to the upcoming Federal Reserve meeting. The dollar’s weakness to the reduced bets of aggressive hikes continues to highlight how the currency remains highly sensitive to rate hike expectations.

The week ahead… 

It’s all about the Federal Reserve meeting on Wednesday.

The central bank is widely to raise interest rates by 75 basis points for a second straight meeting but the main focus will be directed toward Fed Chair Jerome Powell’s post-meeting conference. Given how markets remain highly reactive to anything relating to inflation, interest rates, and growth – Powell’s every word will be closely scrutinized. To prevent any unnecessary fireworks, he is expected to pledge the Fed’s resolve to vanquish inflation while putting growth into consideration.

Interestingly, the U.S economy is holding steady so far and the latest employment numbers look encouraging despite recession fears. However, the inflation picture remains gloomy with consumer prices (CPI), jumping 9.1% in June from a year earlier. On the bright side, the Federal Reserve’s preferred gauge of inflation declined to 4.7% in May.

Possible outcomes to Fed meeting 

  • Fed hikes rates by 75-basis point. This decision may not be enough for dollar bulls since it has already been priced in. Such a move needs to be complemented by a firmly hawkish Powell which fuels speculation around more aggressive hikes down the road.
  • Fed surprises markets with a 50-basis point hike. A smaller than expected hike is likely to trigger a sharp dollar selloff. If Powell adopts a cautious stance, this will add insult to injury – weakening the dollar further.
  • Fed fires 100 basis point bazooka. This could send the dollar surging higher in the short term but gains may be surrendered by renewed fears of a US recession.

On the data front, it will be wise to keep an eye out on the latest consumer confidence report for July, US Q2 GDP, weekly jobless claims, and the PCE core deflator among other key economic reports.

Time for USD bears to dominate the scene?

Earlier we spoke about “What goes up must eventually come down”.

Well, this looks like the case with the equally-weighted USD Index on the weekly. After punching above 1.2150 back in mid-July, prices have been on a slippery decline. The weekly bullish trend is under threat with a strong breakdown below the 1.1700 higher low bringing bears into the game.

On the daily charts, prices are trading within a wide range with support at 1.1700 and resistance at 1.1950. There is still some hope for bulls given how the candlesticks are above the 50, 100, and 200-day Simple Moving Average. However, a daily close below 1.1700 could inspire a decline towards 1.1630 and 1.1450, respectively.


Forex-Time-LogoArticle by ForexTime

ForexTime Ltd (FXTM) is an award winning international online forex broker regulated by CySEC 185/12 www.forextime.com


Europe On Sale: Get It While U Can

By Elliott Wave International

On July 13 and 14, the euro and the U.S. dollar briefly traded at parity — for the first time in 20 years.

Just 19 months ago, EURUSD was at $1.2350. It’s quietly dropped 20%+ since.

Quietly? Yeah, because of all the other fireworks in the market drowned out the news.

What would you have done with this knowledge a year and a half ago?

For one thing, you’d have put off that European vacation until now!

Who could have known? EWI subscribers. Check out this forecast from EWI back on January 8, 2021:

It appears that currencies are delivering the early New Year trend reversal that often occurs. The [Euro]’s high at 1.2350 on Wednesday, January 6, completes the five-wave rally from at least November 4, 2020 (1.1604) and likely from March 23, 2020 (1.0635)…Greater bearish potential exists…

Every student of Elliott knows that when five waves finish, you should anticipate a reversal of equal degree.

Here’s what happened since:

Mmmm, I love a good chart.

And a great tweet. Tip of the hat to Mr_Cuddlez!

So, are you ready to catch the next big euro move?

EWI’s Chief Market Analyst Steven Hochberg guides our Financial Forecast Service subscribers 3X/week through the twist and turns in the euro (and dollar) — plus, U.S. stock indexes, bonds, gold and silver — inside his Short Term Update.

Right now, read our forecasts for all of the markets listed above (and more) inside our Financial Forecast Service Test Drivejust $17 for a full week’s access.

Join the Financial Forecast Service Test Drive now.

Hurry: Your one-time Test Drive opportunity ends Thursday, July 28th.

This article was syndicated by Elliott Wave International and was originally published under the headline Europe On Sale: Get It While U Can. EWI is the world’s largest market forecasting firm. Its staff of full-time analysts led by Chartered Market Technician Robert Prechter provides 24-hour-a-day market analysis to institutional and private investors around the world.

Euro Currency bets continue to decline while US Dollar Index Speculator positions bounced back

By InvestMacro | COT | Data Tables | COT Leaders | Downloads | COT Newsletter

Here are the latest charts and statistics for the Commitment of Traders (COT) data published by the Commodities Futures Trading Commission (CFTC).

The latest COT data is updated through Tuesday July 19th and shows a quick view of how large traders (for-profit speculators and commercial entities) were positioned in the futures markets. All currency positions are in direct relation to the US dollar where, for example, a bet for the euro is a bet that the euro will rise versus the dollar while a bet against the euro will be a bet that the euro will decline versus the dollar.

Weekly Speculator Changes

COT currency market speculator bets were mostly higher this week as six out of the eleven currency markets we cover had higher positioning while the other five markets had lower speculator contracts.

Leading the gains for the currency markets was the Canadian dollar (3,162 contracts) and the British pound sterling (1,839 contracts) while the New Zealand dollar (1,612 contracts), the Japanese yen (773 contracts), the US Dollar Index (715 contracts) and the Brazilian real (270 contracts) also had higher speculator bets for the week.

The currencies leading the declines in speculator bets this week were the Euro (-17,501 contracts) and Mexican peso (-7,522 contracts) with the Swiss franc (-2,188 contracts), the Australian dollar (-1,548 contracts) and Bitcoin (-335 contracts) also registering lower bets on the week.
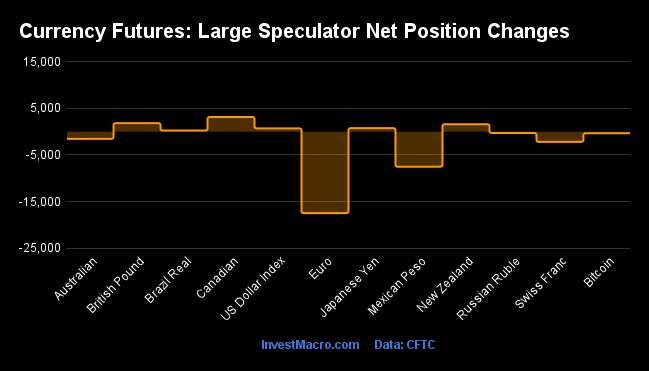
 

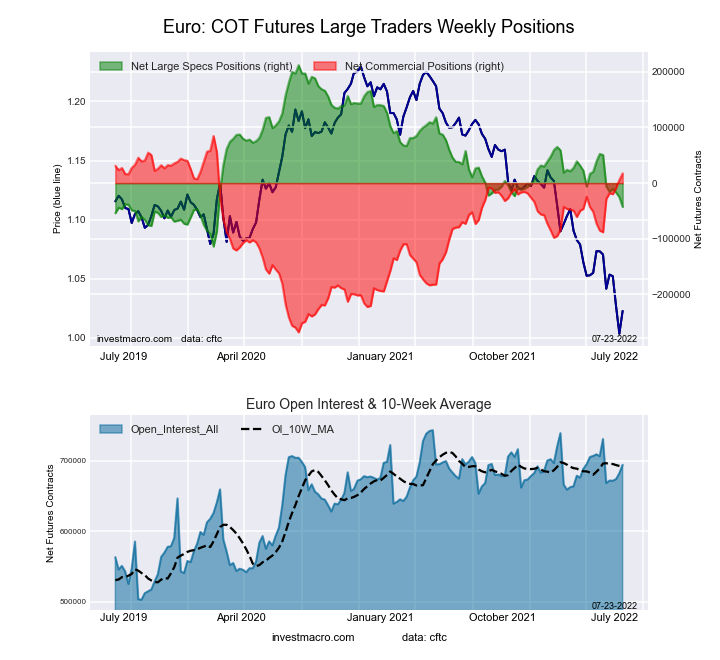
Highlighting the currencies data is the Euro’s continued decline in speculator bets. The Euro’s speculator positioning declined for the third straight week and for the sixth time in the past seven weeks which has taken off a total of -95,017 contracts from the speculator standing in that seven-week period. This decline has quickly taken the Euro speculator contracts from +52,272 contracts on May 31st to a total of -42,745 contracts this week. The EURUSD’s spot price this week had a modest bounce-back following a three-week decline and a dip below parity with the US Dollar last week. The EURUSD currency pair closed the week near the 1.0215 spot exchange rate after gaining by approximately 1.25 percent for the week.

The US Dollar Index speculator bets, meanwhile, rose this week for the first time in the past four weeks and remain near the top of their speculative range. Dollar speculators had taken a total of -6,656 contracts off the bullish position in the previous three weeks and pulled the net bullish position below +40,000 contracts for the first time since June 28th before this week’s small rebound. Speculators have been uber-bullish recently on the dollar and the past four months has seen a strong surge to the upside. Since April, the US Dollar Index price has been higher in twelve out of fifteen weeks and culminated with the highest DXY price in approximately twenty years above 109.00. The dollar strength has been punishing the other major currencies as the Euro and Yen have hit multi-decade lows (versus the USD) with the US Federal Reserve sharply raising interest rates to combat inflation. The Dollar Index spot price cooled off this week by approximately 1.30 percent and closed around the 106.50 exchange rate.


Data Snapshot of Forex Market Traders | Columns Legend
Jul-19-2022OIOI-IndexSpec-NetSpec-IndexCom-NetCOM-IndexSmalls-NetSmalls-Index
USD Index59,2148739,06990-41,500102,43143
EUR694,10680-42,7452217,4308125,31516
GBP228,05156-57,2503370,29971-13,04929
JPY229,44975-59,2253273,08271-13,85725
CHF41,85525-10,9122919,20574-8,29329
CAD142,216256,66747-8,746612,07934
AUD155,24649-43,1484549,27656-6,12837
NZD45,46735-3,671657,22742-3,55611
MXN196,12347-30,7601427,890842,87055
RUB20,93047,54331-7,15069-39324
BRL42,4523010,47561-11,580401,10578
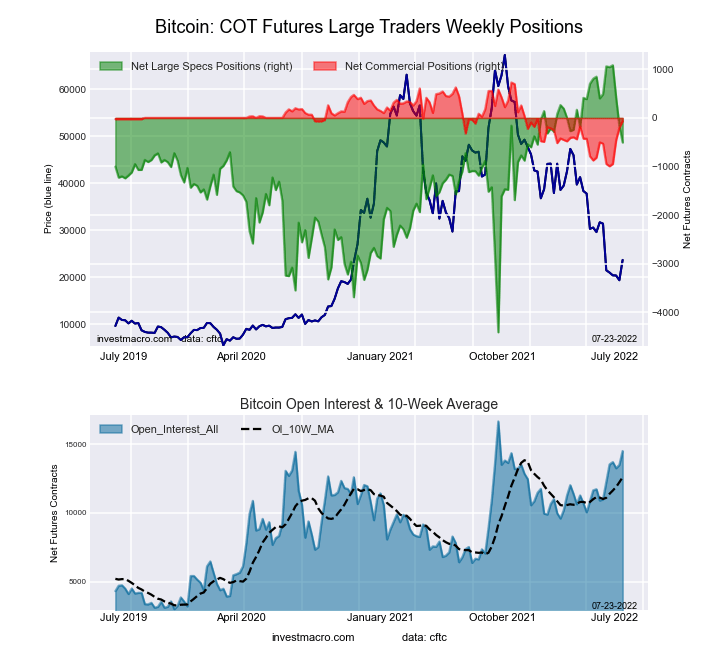
Bitcoin14,51284-50671-66057226


Strength Scores

Strength Scores (a normalized measure of Speculator positions over a 3-Year range, from 0 to 100 where above 80 is extreme bullish and below 20 is extreme bearish) show that the US Dollar Index (90.1 percent) leads the currency markets once again and remains in a bullish extreme position. Bitcoin (71.1 percent), the New Zealand Dollar (65.1 percent) and the Brazilian Real (60.7 percent) come in as the next highest in strength scores – also for a second straight week. On the downside, the Mexican Peso (14.2 percent) remains the currency with the lowest strength level currently and is followed by the EuroFX (21.9 percent) which is quickly getting more bearish by the week.
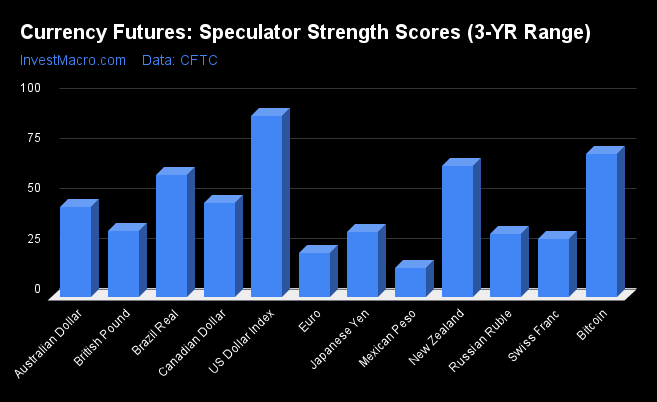

Strength Statistics:
US Dollar Index (90.1 percent) vs US Dollar Index previous week (88.9 percent)
EuroFX (21.9 percent) vs EuroFX previous week (27.3 percent)
British Pound Sterling (32.8 percent) vs British Pound Sterling previous week (31.4 percent)
Japanese Yen (32.4 percent) vs Japanese Yen previous week (31.9 percent)
Swiss Franc (28.8 percent) vs Swiss Franc previous week (34.4 percent)
Canadian Dollar (46.8 percent) vs Canadian Dollar previous week (43.3 percent)
Australian Dollar (44.8 percent) vs Australian Dollar previous week (46.3 percent)
New Zealand Dollar (65.1 percent) vs New Zealand Dollar previous week (62.4 percent)
Mexican Peso (14.2 percent) vs Mexican Peso previous week (17.4 percent)
Brazil Real (60.7 percent) vs Brazil Real previous week (60.4 percent)
Russian Ruble (31.2 percent) vs Russian Ruble previous week (31.9 percent)
Bitcoin (71.1 percent) vs Bitcoin previous week (77.2 percent)

Strength Trends

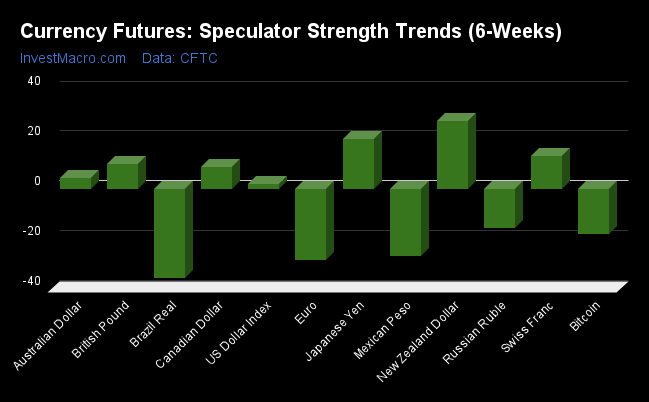
Strength Score Trends (or move index, calculates the 6-week changes in strength scores) show that the New Zealand Dollar (27.0 percent) leads the past six weeks trends for the currency markets this week. The Japanese Yen (20.0 percent) and the Swiss Franc (13.2 percent) fill out the top movers in the trends data. The Brazilian Real (-35.6 percent) leads the downside trend scores currently while the next markets with lower trend scores were the EuroFX (-28.6 percent) followed by the Mexican Peso (-27.1 percent).

Strength Trend Statistics:
US Dollar Index (1.9 percent) vs US Dollar Index previous week (1.4 percent)
EuroFX (-28.6 percent) vs EuroFX previous week (-23.8 percent)
British Pound Sterling (9.8 percent) vs British Pound Sterling previous week (10.8 percent)
Japanese Yen (20.0 percent) vs Japanese Yen previous week (21.2 percent)
Swiss Franc (13.2 percent) vs Swiss Franc previous week (29.7 percent)
Canadian Dollar (8.7 percent) vs Canadian Dollar previous week (11.8 percent)
Australian Dollar (4.4 percent) vs Australian Dollar previous week (6.6 percent)
New Zealand Dollar (27.0 percent) vs New Zealand Dollar previous week (22.6 percent)
Mexican Peso (-27.1 percent) vs Mexican Peso previous week (-25.0 percent)
Brazil Real (-35.6 percent) vs Brazil Real previous week (-34.5 percent)
Russian Ruble (-15.6 percent) vs Russian Ruble previous week (9.1 percent)
Bitcoin (-18.1 percent) vs Bitcoin previous week (-10.4 percent)


Individual Market Charts:

US Dollar Index Futures:
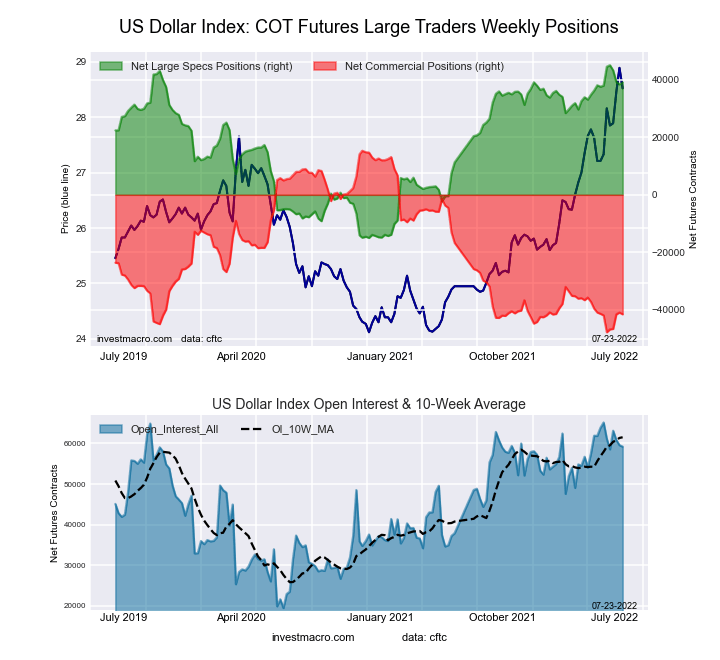
US Dollar Index Forex Futures COT ChartThe US Dollar Index large speculator standing this week rose to a net position of 39,069 contracts in the data reported through Tuesday. This was a weekly advance by 715 contracts from the previous week which had a total of 38,354 net contracts.

This week’s current strength score (the trader positioning range over the past three years, measured from 0 to 100) shows the speculators are currently Bullish-Extreme with a score of 90.1 percent. The commercials are Bearish-Extreme with a score of 9.9 percent and the small traders (not shown in chart) are Bearish with a score of 43.1 percent.

US DOLLAR INDEX StatisticsSPECULATORSCOMMERCIALSSMALL TRADERS
– Percent of Open Interest Longs:84.84.98.6
– Percent of Open Interest Shorts:18.974.94.5
– Net Position:39,069-41,5002,431
– Gross Longs:50,2342,8735,069
– Gross Shorts:11,16544,3732,638
– Long to Short Ratio:4.5 to 10.1 to 11.9 to 1
NET POSITION TREND:
– Strength Index Score (3 Year Range Pct):90.19.943.1
– Strength Index Reading (3 Year Range):Bullish-ExtremeBearish-ExtremeBearish
NET POSITION MOVEMENT INDEX:
– 6-Week Change in Strength Index:1.90.6-16.3


Euro Currency Futures:

Euro Currency Futures COT ChartThe Euro Currency large speculator standing this week was a net position of -42,745 contracts in the data reported through Tuesday. This was a sharp weekly drop of -17,501 contracts from the previous week which had a total of -25,244 net contracts.

The current strength score (the trader positioning range over the past three years, measured from 0 to 100) shows the speculators are currently Bearish with a score of 21.9 percent. The commercials are Bullish-Extreme with a score of 81.0 percent and the small traders (not shown in chart) are Bearish-Extreme with a score of 16.3 percent.

EURO Currency StatisticsSPECULATORSCOMMERCIALSSMALL TRADERS
– Percent of Open Interest Longs:28.257.311.9
– Percent of Open Interest Shorts:34.454.88.3
– Net Position:-42,74517,43025,315
– Gross Longs:195,875397,99182,676
– Gross Shorts:238,620380,56157,361
– Long to Short Ratio:0.8 to 11.0 to 11.4 to 1
NET POSITION TREND:
– Strength Index Score (3 Year Range Pct):21.981.016.3
– Strength Index Reading (3 Year Range):BearishBullish-ExtremeBearish-Extreme
NET POSITION MOVEMENT INDEX:
– 6-Week Change in Strength Index:-28.630.0-20.4


British Pound Sterling Futures:

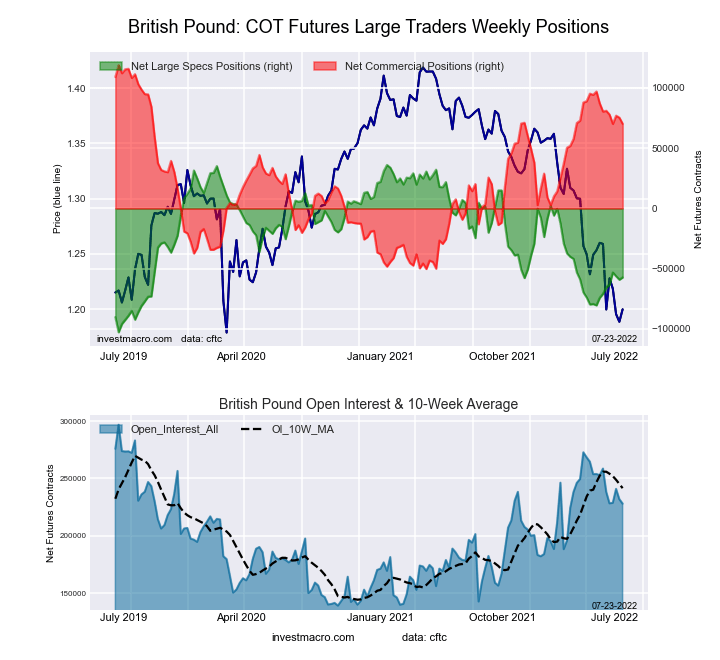
British Pound Sterling Futures COT ChartThe British Pound Sterling large speculator standing this week totaled a net position of -57,250 contracts in the data reported through Tuesday. This was a weekly gain of 1,839 contracts from last  week’s total of -59,089 net contracts.

This week’s current strength score (the trader positioning range over the past three years, measured from 0 to 100) shows the speculators are currently Bearish with a score of 32.8 percent. The commercials are Bullish with a score of 71.3 percent and the small traders (not shown in chart) are Bearish with a score of 28.6 percent.

BRITISH POUND StatisticsSPECULATORSCOMMERCIALSSMALL TRADERS
– Percent of Open Interest Longs:14.074.68.7
– Percent of Open Interest Shorts:39.143.714.4
– Net Position:-57,25070,299-13,049
– Gross Longs:31,943170,05319,882
– Gross Shorts:89,19399,75432,931
– Long to Short Ratio:0.4 to 11.7 to 10.6 to 1
NET POSITION TREND:
– Strength Index Score (3 Year Range Pct):32.871.328.6
– Strength Index Reading (3 Year Range):BearishBullishBearish
NET POSITION MOVEMENT INDEX:
– 6-Week Change in Strength Index:9.8-6.0-7.0


Japanese Yen Futures:

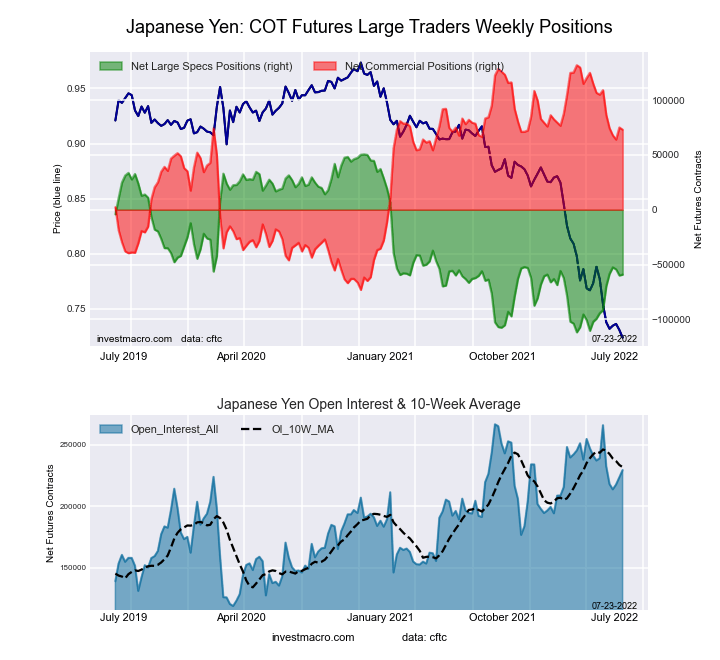
Japanese Yen Forex Futures COT ChartThe Japanese Yen large speculator standing this week was a net position of -59,225 contracts in the data reported through Tuesday. This was a weekly rise of 773 contracts from the previous week which had a total of -59,998 net contracts.

The current strength score (the trader positioning range over the past three years, measured from 0 to 100) shows the speculators are currently Bearish with a score of 32.4 percent. The commercials are Bullish with a score of 71.3 percent and the small traders (not shown in chart) are Bearish with a score of 25.3 percent.

JAPANESE YEN StatisticsSPECULATORSCOMMERCIALSSMALL TRADERS
– Percent of Open Interest Longs:18.769.010.7
– Percent of Open Interest Shorts:44.537.216.7
– Net Position:-59,22573,082-13,857
– Gross Longs:42,880158,42724,496
– Gross Shorts:102,10585,34538,353
– Long to Short Ratio:0.4 to 11.9 to 10.6 to 1
NET POSITION TREND:
– Strength Index Score (3 Year Range Pct):32.471.325.3
– Strength Index Reading (3 Year Range):BearishBullishBearish
NET POSITION MOVEMENT INDEX:
– 6-Week Change in Strength Index:20.0-17.67.3


Swiss Franc Futures:

The Swiss Franc large speculator standing this week totaled a net position of -10,912 contracts in the data reported through Tuesday. This was a weekly decline of -2,188 contracts from the previous week which had a total of -8,724 net contracts.

This week’s current strength score (the trader positioning range over the past three years, measured from 0 to 100) shows the speculators are currently Bearish with a score of 28.8 percent. The commercials are Bullish with a score of 74.1 percent and the small traders (not shown in chart) are Bearish with a score of 29.5 percent.

SWISS FRANC StatisticsSPECULATORSCOMMERCIALSSMALL TRADERS
– Percent of Open Interest Longs:16.659.723.5
– Percent of Open Interest Shorts:42.713.943.3
– Net Position:-10,91219,205-8,293
– Gross Longs:6,94825,0089,819
– Gross Shorts:17,8605,80318,112
– Long to Short Ratio:0.4 to 14.3 to 10.5 to 1
NET POSITION TREND:
– Strength Index Score (3 Year Range Pct):28.874.129.5
– Strength Index Reading (3 Year Range):BearishBullishBearish
NET POSITION MOVEMENT INDEX:
– 6-Week Change in Strength Index:13.2-12.89.5


Canadian Dollar Futures:

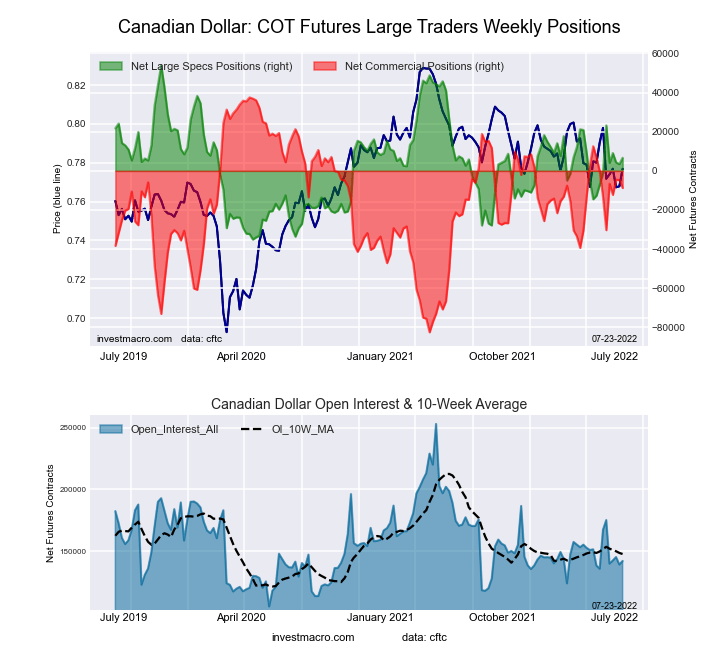
Canadian Dollar Forex Futures COT ChartThe Canadian Dollar large speculator standing this week was a net position of 6,667 contracts in the data reported through Tuesday. This was a weekly gain of 3,162 contracts from the previous week which had a total of 3,505 net contracts.

This week’s current strength score (the trader positioning range over the past three years, measured from 0 to 100) shows the speculators are currently Bearish with a score of 46.8 percent. The commercials are Bullish with a score of 61.4 percent and the small traders (not shown in chart) are Bearish with a score of 34.3 percent.

CANADIAN DOLLAR StatisticsSPECULATORSCOMMERCIALSSMALL TRADERS
– Percent of Open Interest Longs:29.647.122.1
– Percent of Open Interest Shorts:24.953.320.6
– Net Position:6,667-8,7462,079
– Gross Longs:42,04067,03831,391
– Gross Shorts:35,37375,78429,312
– Long to Short Ratio:1.2 to 10.9 to 11.1 to 1
NET POSITION TREND:
– Strength Index Score (3 Year Range Pct):46.861.434.3
– Strength Index Reading (3 Year Range):BearishBullishBearish
NET POSITION MOVEMENT INDEX:
– 6-Week Change in Strength Index:8.73.9-24.9


Australian Dollar Futures:

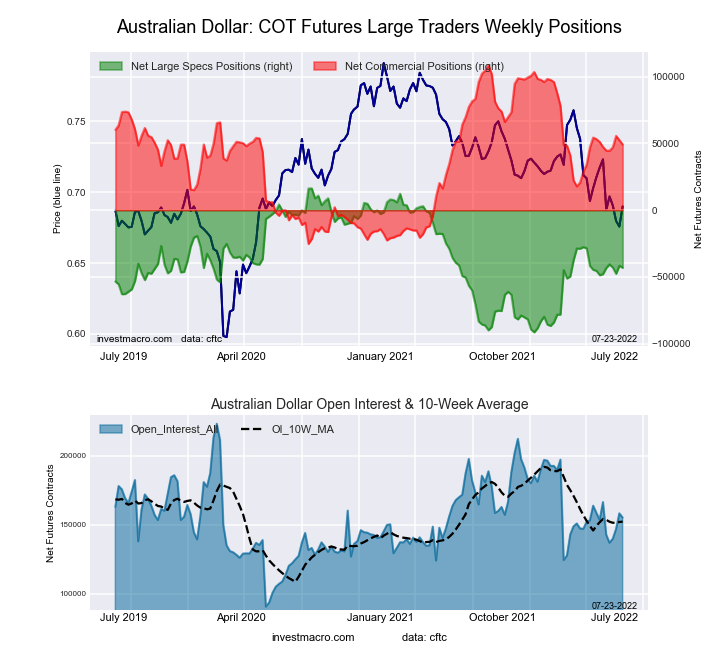
Australian Dollar Forex Futures COT ChartThe Australian Dollar large speculator standing this week was a net position of -43,148 contracts in the data reported through Tuesday. This was a weekly lowering of -1,548 contracts from the previous week which had a total of -41,600 net contracts.

This week’s current strength score (the trader positioning range over the past three years, measured from 0 to 100) shows the speculators are currently Bearish with a score of 44.8 percent. The commercials are Bullish with a score of 55.6 percent and the small traders (not shown in chart) are Bearish with a score of 37.5 percent.

AUSTRALIAN DOLLAR StatisticsSPECULATORSCOMMERCIALSSMALL TRADERS
– Percent of Open Interest Longs:19.766.011.2
– Percent of Open Interest Shorts:47.534.315.2
– Net Position:-43,14849,276-6,128
– Gross Longs:30,578102,51817,420
– Gross Shorts:73,72653,24223,548
– Long to Short Ratio:0.4 to 11.9 to 10.7 to 1
NET POSITION TREND:
– Strength Index Score (3 Year Range Pct):44.855.637.5
– Strength Index Reading (3 Year Range):BearishBullishBearish
NET POSITION MOVEMENT INDEX:
– 6-Week Change in Strength Index:4.41.4-16.1


New Zealand Dollar Futures:

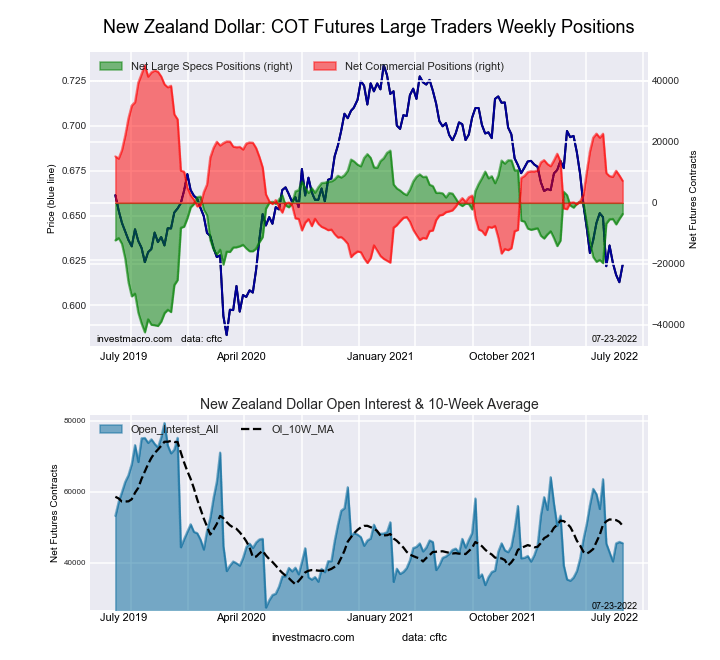
New Zealand Dollar Forex Futures COT ChartThe New Zealand Dollar large speculator standing this week was a net position of -3,671 contracts in the data reported through Tuesday. This was a weekly increase of 1,612 contracts from the previous week which had a total of -5,283 net contracts.

This week’s current strength score (the trader positioning range over the past three years, measured from 0 to 100) shows the speculators are currently Bullish with a score of 65.1 percent. The commercials are Bearish with a score of 41.5 percent and the small traders (not shown in chart) are Bearish-Extreme with a score of 10.8 percent.

NEW ZEALAND DOLLAR StatisticsSPECULATORSCOMMERCIALSSMALL TRADERS
– Percent of Open Interest Longs:34.759.25.4
– Percent of Open Interest Shorts:42.843.313.2
– Net Position:-3,6717,227-3,556
– Gross Longs:15,79126,9052,444
– Gross Shorts:19,46219,6786,000
– Long to Short Ratio:0.8 to 11.4 to 10.4 to 1
NET POSITION TREND:
– Strength Index Score (3 Year Range Pct):65.141.510.8
– Strength Index Reading (3 Year Range):BullishBearishBearish-Extreme
NET POSITION MOVEMENT INDEX:
– 6-Week Change in Strength Index:27.0-23.8-7.4


Mexican Peso Futures:

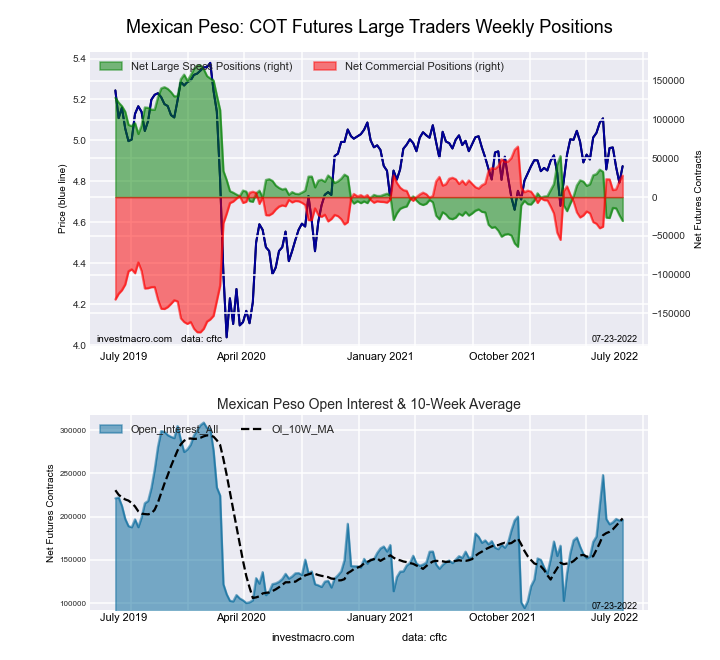
Mexican Peso Futures COT ChartThe Mexican Peso large speculator standing this week was a net position of -30,760 contracts in the data reported through Tuesday. This was a weekly decrease of -7,522 contracts from the previous week which had a total of -23,238 net contracts.

The current strength score (the trader positioning range over the past three years, measured from 0 to 100) shows the speculators are currently Bearish-Extreme with a score of 14.2 percent. The commercials are Bullish-Extreme with a score of 84.4 percent and the small traders (not shown in chart) are Bullish with a score of 55.2 percent.

MEXICAN PESO StatisticsSPECULATORSCOMMERCIALSSMALL TRADERS
– Percent of Open Interest Longs:50.046.63.0
– Percent of Open Interest Shorts:65.632.41.6
– Net Position:-30,76027,8902,870
– Gross Longs:97,96591,4585,972
– Gross Shorts:128,72563,5683,102
– Long to Short Ratio:0.8 to 11.4 to 11.9 to 1
NET POSITION TREND:
– Strength Index Score (3 Year Range Pct):14.284.455.2
– Strength Index Reading (3 Year Range):Bearish-ExtremeBullish-ExtremeBullish
NET POSITION MOVEMENT INDEX:
– 6-Week Change in Strength Index:-27.127.5-10.7


Brazilian Real Futures:

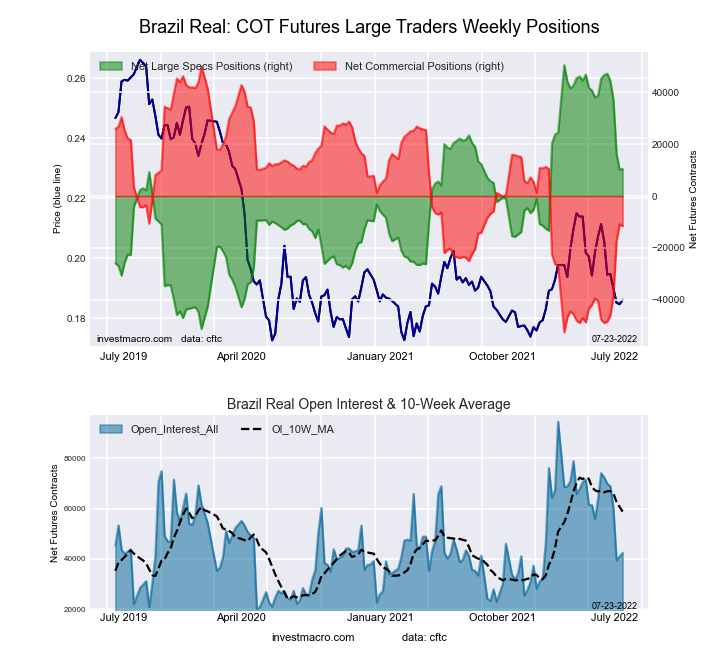
Brazil Real Futures COT ChartThe Brazilian Real large speculator standing this week reached a net position of 10,475 contracts in the data reported through Tuesday. This was a weekly advance of 270 contracts from the previous week which had a total of 10,205 net contracts.

The current strength score (the trader positioning range over the past three years, measured from 0 to 100) shows the speculators are currently Bullish with a score of 60.7 percent. The commercials are Bearish with a score of 40.0 percent and the small traders (not shown in chart) are Bullish with a score of 77.7 percent.

BRAZIL REAL StatisticsSPECULATORSCOMMERCIALSSMALL TRADERS
– Percent of Open Interest Longs:48.543.77.3
– Percent of Open Interest Shorts:23.971.04.7
– Net Position:10,475-11,5801,105
– Gross Longs:20,60018,5693,092
– Gross Shorts:10,12530,1491,987
– Long to Short Ratio:2.0 to 10.6 to 11.6 to 1
NET POSITION TREND:
– Strength Index Score (3 Year Range Pct):60.740.077.7
– Strength Index Reading (3 Year Range):BullishBearishBullish
NET POSITION MOVEMENT INDEX:
– 6-Week Change in Strength Index:-35.636.5-13.4


Bitcoin Futures:

Bitcoin Crypto Futures COT ChartThe Bitcoin large speculator standing this week was a net position of -506 contracts in the data reported through Tuesday. This was a weekly decline of -335 contracts from the previous week which had a total of -171 net contracts.

The current strength score (the trader positioning range over the past three years, measured from 0 to 100) shows the speculators are currently Bullish with a score of 71.1 percent. The commercials are Bullish with a score of 53.9 percent and the small traders (not shown in chart) are Bearish with a score of 25.9 percent.

BITCOIN StatisticsSPECULATORSCOMMERCIALSSMALL TRADERS
– Percent of Open Interest Longs:75.23.59.4
– Percent of Open Interest Shorts:78.74.05.4
– Net Position:-506-66572
– Gross Longs:10,9095141,360
– Gross Shorts:11,415580788
– Long to Short Ratio:1.0 to 10.9 to 11.7 to 1
NET POSITION TREND:
– Strength Index Score (3 Year Range Pct):71.153.925.9
– Strength Index Reading (3 Year Range):BullishBullishBearish
NET POSITION MOVEMENT INDEX:
– 6-Week Change in Strength Index:-18.126.912.1


Article By InvestMacroReceive our weekly COT Reports by Email

*COT Report: The COT data, released weekly to the public each Friday, is updated through the most recent Tuesday (data is 3 days old) and shows a quick view of how large speculators or non-commercials (for-profit traders) were positioned in the futures markets.

The CFTC categorizes trader positions according to commercial hedgers (traders who use futures contracts for hedging as part of the business), non-commercials (large traders who speculate to realize trading profits) and nonreportable traders (usually small traders/speculators) as well as their open interest (contracts open in the market at time of reporting).See CFTC criteria here.

Ichimoku Cloud Analysis 22.07.2022 (EURUSD, XAUUSD, NZDUSD)

Article By RoboForex.com

XAUUSD, “Gold vs US Dollar”

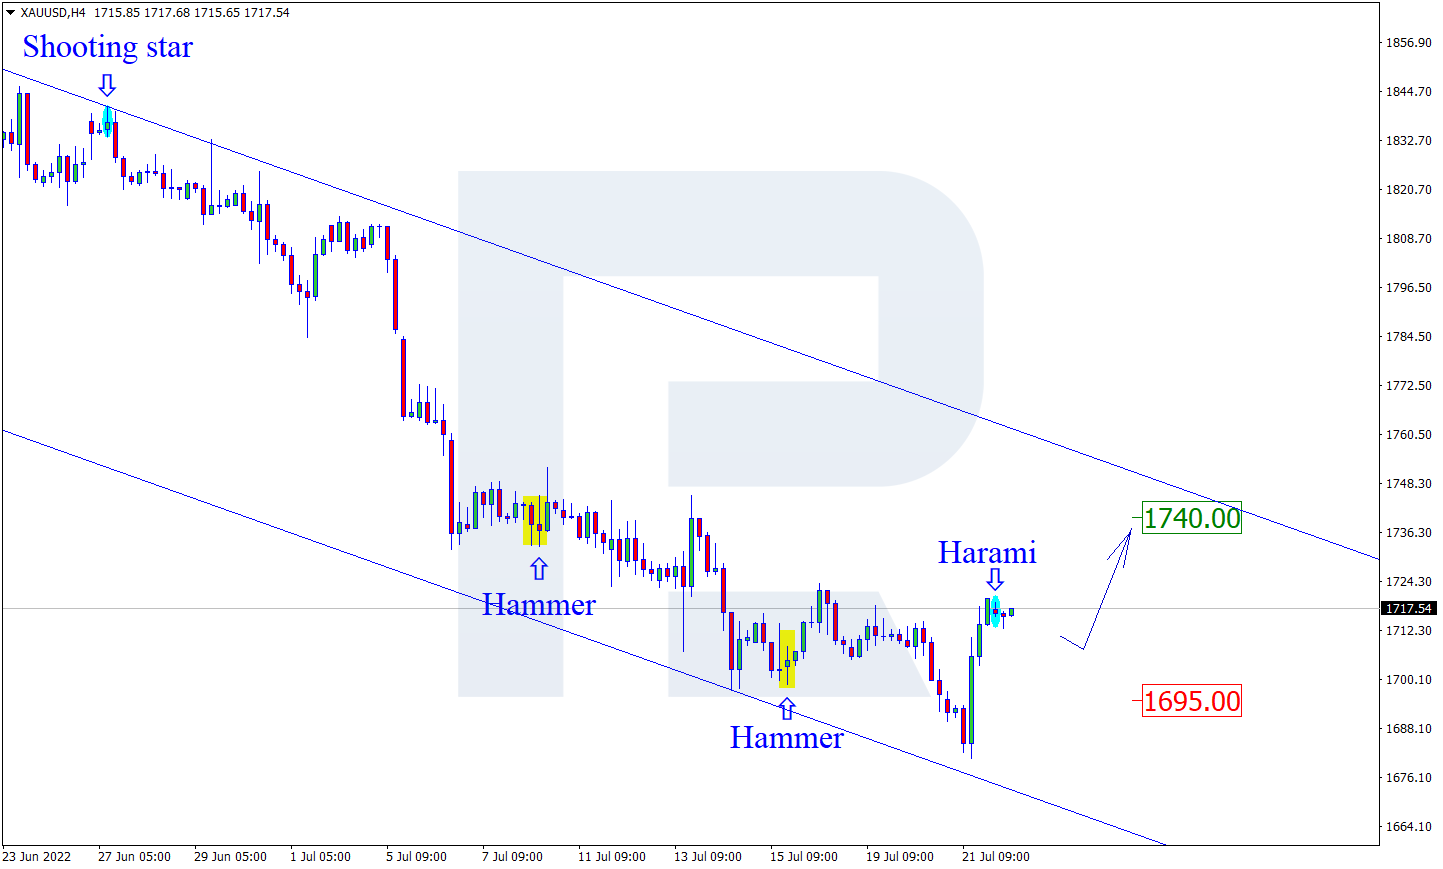
As we can see in the H4 chart, XAUUSD has formed a Harami reversal pattern not far from the resistance area. At the moment, the asset may reverse in the form of a new correctional impulse. In this case, the downside correctional target may be the support level at 1650.00. At the same time, the opposite scenario implies that the price may continue growing to reach 1740.00 without any pullbacks.

XAUUSD
Risk Warning: the result of previous trading operations do not guarantee the same results in the future

NZDUSD, “New Zealand vs US Dollar”

As we can see in the H4 chart, NZDUSD has formed a Hammer reversal pattern close to the support area. At the moment, the asset may reverse in the form of another ascending impulse. In this case, the upside target may be at 0.6290. After that, the asset may break the resistance level and continue moving upwards. However, an alternative scenario implies that the price may fall to reach 0.6190 before resuming its growth towards the resistance level.

NZDUSD
Risk Warning: the result of previous trading operations do not guarantee the same results in the future

GBPUSD, “Great Britain Pound vs US Dollar”

As we can see in the H4 chart, GBPUSD has formed a Harami reversal pattern near the resistance level. At the moment, the pair may reverse in the form of a new descending impulse. In this case, the downside target may be the support area at 1.1845. Later, the market may break this level and continue falling. Still, there might be an alternative scenario, in which the asset may correct to reach the resistance level at 1.2055 first and then resume the descending tendency.

GBPUSD

Article By RoboForex.com

Attention!
Forecasts presented in this section only reflect the author’s private opinion and should not be considered as guidance for trading. RoboForex LP bears no responsibility for trading results based on trading recommendations described in these analytical reviews.

Japanese Candlesticks Analysis 22.07.2022 (XAUUSD, NZDUSD, GBPUSD)

Article By RoboForex.com

XAUUSD, “Gold vs US Dollar”

As we can see in the H4 chart, XAUUSD has formed a Harami reversal pattern not far from the resistance area. At the moment, the asset may reverse in the form of a new correctional impulse. In this case, the downside correctional target may be the support level at 1650.00. At the same time, the opposite scenario implies that the price may continue growing to reach 1740.00 without any pullbacks.

XAUUSD
Risk Warning: the result of previous trading operations do not guarantee the same results in the future

NZDUSD, “New Zealand vs US Dollar”

As we can see in the H4 chart, NZDUSD has formed a Hammer reversal pattern close to the support area. At the moment, the asset may reverse in the form of another ascending impulse. In this case, the upside target may be at 0.6290. After that, the asset may break the resistance level and continue moving upwards. However, an alternative scenario implies that the price may fall to reach 0.6190 before resuming its growth towards the resistance level.

NZDUSD
Risk Warning: the result of previous trading operations do not guarantee the same results in the future

GBPUSD, “Great Britain Pound vs US Dollar”

As we can see in the H4 chart, GBPUSD has formed a Harami reversal pattern near the resistance level. At the moment, the pair may reverse in the form of a new descending impulse. In this case, the downside target may be the support area at 1.1845. Later, the market may break this level and continue falling. Still, there might be an alternative scenario, in which the asset may correct to reach the resistance level at 1.2055 first and then resume the descending tendency.

GBPUSD

Article By RoboForex.com

Attention!
Forecasts presented in this section only reflect the author’s private opinion and should not be considered as guidance for trading. RoboForex LP bears no responsibility for trading results based on trading recommendations described in these analytical reviews.

The Analytical Overview of the Main Currency Pairs on 2022.07.22

By JustForex

The EUR/USD currency pair

Technical indicators of the currency pair:
  • Prev Open: 1.0176
  • Prev Close: 1.0228
  • % chg. over the last day: +0.51%

The European Central Bank unexpectedly raised the interest rate by 0.5%, although Christine Lagarde had indicated that the first increase would be 0.25%. The ECB report indicates that the decision is based on an updated assessment of inflation risks, as rising prices are a growing concern for households and companies. The future trajectory of interest rates will depend on new inflation data. ECB policymakers also agreed to provide additional assistance to the currency bloc’s 19 heavily indebted countries, including Italy, with a new bond-buying scheme designed to limit their rising borrowing costs and thus limit financial fragmentation. Against this news, the euro strengthened significantly.

Trading recommendations
  • Support levels: 1.0188, 1.0154, 1.0106, 1.0035, 1.0000
  • Resistance levels: 1.0284, 1.0365, 1.0415, 1.050

From the technical point of view, the trend on the EUR/USD currency pair on the hourly time frame is bullish. The price is forming a wide balance, and the MACD indicator has become inactive, but the buyer’s pressure remains. Under such market conditions, it is best to look for buy trades on intraday time frames from the support level of 1.0188 or 1.0106, but only with confirmation. Sell trades can be considered from the resistance level of 1.0284, but only after additional confirmation and only with short targets.

Alternative scenario: if the price breaks down through the 1.0000 support level and fixes below, the downtrend will likely resume.

EUR/USD
News feed for 2022.07.22:
  • – Eurozone France Manufacturing PMI (m/m) at 10:15 (GMT+3);
  • – Eurozone France Services PMI (m/m) at 10:15 (GMT+3);
  • – Eurozone German Manufacturing PMI (m/m) at 10:30 (GMT+3);
  • – Eurozone German Services PMI (m/m) at 10:30 (GMT+3);
  • – Eurozone Manufacturing PMI (m/m) at 11:00 (GMT+3);
  • – Eurozone Services PMI (m/m) at 11:00 (GMT+3);
  • – US Manufacturing PMI (m/m) at 16:45 (GMT+3);
  • – US Services PMI (m/m) at 16:45 (GMT+3).

The GBP/USD currency pair

Technical indicators of the currency pair:
  • Prev Open: 1.1974
  • Prev Close: 1.1999
  • % chg. over the last day: -0.21%

In the UK, investors are watching the race for Prime Minister’s seat. Former Treasury Secretary Rishi Sunak and Foreign Secretary Liz Truss made it to the last round of the contest to become party leaders. A number of reports will also be released today. Traders expect a slowdown in the UK Manufacturing PMI for June and a decline in retail sales. If the data is worse than forecast, the British pound may react with a decline.

Trading recommendations
  • Support levels: 1.1955, 1.1907, 1.1803
  • Resistance levels: 1.2065, 1.2137

From the technical point of view, the trend on the GBP/USD currency pair on the hour time is bullish. The price has slightly corrected and is trading at the level of the moving averages. The MACD indicator has become inactive. Under such market conditions, it is best to look for buy trades on intraday time frames from the support level of 1.1955 or 1.1907, but only with confirmation. Sell trades can be considered intraday from the resistance level of 1.2065, but only after additional confirmation and with short targets.

Alternative scenario: if the price breaks down through the 1.1803 support level and fixes below, the downtrend will likely resume.

GBP/USD
News feed for 2022.07.22:
  • – UK Retail Sales (m/m) at 09:00 (GMT+3);
  • – UK Manufacturing PMI (m/m) at 11:30 (GMT+3);
  • – UK Services PMI (m/m) at 11:30 (GMT+3).

The USD/JPY currency pair

Technical indicators of the currency pair:
  • Prev Open: 138.13
  • Prev Close: 137.34
  • % chg. over the last day: -0.57%

Japan’s key inflation indicator has further exceeded the Bank of Japan’s target of 2%. According to data released Friday by the Ministry of Internal Affairs, core consumer prices (excluding food and fuel prices) reached an annualized rate of 2.2%. The result was in line with economists’ estimates. Despite the continued rise in prices, the Bank of Japan is unlikely to budge anytime soon, as the Bank of Japan remains unconvinced that inflation in the country is sustainable. Bank of Japan Governor Kuroda has repeatedly said that current cost inflation is unsustainable and that the central bank needs constant easing until it is demand-driven and accompanied by sustained wage growth. But wage growth has not kept pace with inflation, with May data showing that real wages are down 1.8% from a year ago.

Trading recommendations
  • Support levels: 137.11, 136.48, 135.92, 135.40, 134.64, 134.11
  • Resistance levels: 138.25, 138.56, 140.29

From the technical point of view, the medium-term trend on the USD/JPY currency pair is bullish. But the price has corrected to the priority change level and traded below the moving averages, indicating temporary sellers pressure. Under such market conditions, buy trades can be sought intraday from the support level of 137.11, but with confirmation. For sell deals, traders can consider the resistance level of 138.25, but only with additional confirmation and short targets.

Alternative scenario: If the price fixes below 137.11, the downtrend will likely resume.

USD/JPY
News feed for 2022.07.22:
  • – Japan National Core Consumer Price Index at 02:30 (GMT+3).

The USD/CAD currency pair

Technical indicators of the currency pair:
  • Prev Open: 1.2879
  • Prev Close: 1.2864
  • % chg. over the last day: -0.11%

The Canadian dollar is a commodity currency and is highly dependent on instruments such as the dollar index and oil. Both the US Dollar Index and oil quotes decreased yesterday. As a result, the USD/CAD currency pair traded in a volatile corridor. Volatility in the market increased due to a sharp increase in the ECB rate, which led to a sharp rise in the euro and a decline in the dollar index. Today the retail sales report will be published in Canada. Analysts are predicting an increase in value. If the actual value is better than the forecast, the Canadian dollar may strengthen even more (USD/CAD decline).

Trading recommendations
  • Support levels: 1.2853, 1.2781
  • Resistance levels: 1.2934, 1.3006, 1.3085, 1.3154

In terms of technical analysis, the trend on the USD/CAD currency pair is bearish. The price is forming a balance and trades at the levels of the moving average lines. The MACD indicator has become inactive. Under such market conditions, it is best to consider sell deals from the resistance level of 1.2934, but with confirmation. Buy trades should be viewed on the lower time frames from the support level 1.2853, but only with confirmation and short targets.

Alternative scenario: if the price breaks out and consolidates above the 1.3085 resistance level, the uptrend will likely resume.

USD/CAD
News feed for 2022.07.22:
  • – Canada Retail Sales (m/m) at 15:30 (GMT+3).

By JustForex


This article reflects a personal opinion and should not be interpreted as an investment advice, and/or offer, and/or a persistent request for carrying out financial transactions, and/or a guarantee, and/or a forecast of future events.

Week Ahead: Lower dollar if Fed surprises with “smaller” 50bps hike

By ForexTime

Are you ready for yet another jumbo-sized Fed rate hike?

Markets have been preparing for such an outcome at the upcoming FOMC policy decision, which will star in next week’s economic calendar

Monday, July 25

  • EUR: Germany July IFO business climate
  • GBP: UK PM candidates’ debate – Rishi Sunak vs. Liz Truss

Tuesday, July 26

  • JPY: Bank of Japan June meeting minutes
  • USD: US July consumer confidence
  • IMF releases updated world economic outlook
  • Alphabet 2Q earnings

Wednesday, July 27

  • AUD: Australia Q2 CPI
  • CNH: China June industrial profits
  • USD: Fed rate decision
  • US crude: EIA weekly oil inventory report
  • Meta Platforms 2Q earnings

Thursday, July 28

  • AUD: Australia June retail sales
  • EUR: Germany July CPI, Eurozone July economic and consumer confidence
  • USD: US Q2 GDP, weekly jobless claims
  • Amazon 2Q earnings
  • Apple 2Q earnings

Friday, July 29

  • JPY: Japan June unemployment, retail sales, industrial production; July Tokyo CPI
  • EUR: Eurozone July CPI, Q2 GDP
  • USD: US June personal income and spending, PCE core deflator, July consumer sentiment
  • Exxon 2Q earnings
  • Chevron 2Q earnings


Markets have fully priced in a second consecutive 75-basis point hike at next week’s FOMC policy meeting, as the US central bank continues its battle against the hottest inflation in 40 years.

However, that 75bps hike is a relative step down from the 100-basis point hike that some segments of the markets were expecting. Hence the recent unwinding of gains in the equally-weighted USD index. Still, this instrument is well within its uptrend since Q1 2022.

Note that this index compares the US dollar’s performance against six of its major peers, all in equal weights:

  • Euro
  • British Pound
  • Swiss Franc
  • Australian Dollar
  • New Zealand Dollar
  • Canadian Dollar


Any other outcome that deviates from the 75bps script would be a surprise.

  • DOVISH: A “mere” 50bps hike, though still twice the size of the traditional 25bps rate adjustments per meeting deployed by central bankers worldwide, should prompt more declines in the USD index, potentially moving it closer to its 50-day simple moving average (SMA) around the 1.175 region.
  • HAWKISH: Although the bar has been set high for a hawkish outcome at next week’s meeting, a 100bps shocker would reinvigorate dollar bulls into sending this USD index back above the 1.20 line. More dollar gains may also ensue if Fed Chair Jerome Powell, during his press conference, refuses to rule out a 100bps hike at upcoming meetings.


Ultimately, policymakers at the US central bank, as well as market participants, will continue to be guided by the inflation data.

And on that point, after the FOMC meeting concludes, next Friday’s release of the June PCE deflator will be closely watched, considering that it’s the Fed’s preferred way of measuring inflation.

The PCE deflator is forecasted to come in at 6.6% in June, which would mean that it has posted a reading of 6% or higher for every month so far this year. 6.6% is also more than three times the Fed’s 2% target, underscoring the tremendous task that the Fed is up against.

Further evidence of stubbornly elevated price pressures is set to force the Fed into triggering even more jumbo-sized rate hikes over the coming months. Such hawkish expectations could then see the USD index being restored to the last cycle high at 1.21859, or perhaps even higher.

Overall, as long as the Fed keeps the “pedal to the metal” while leaving other major central banks struggling to catch up with their own rate hikes, that should leave the buck with an easier path to climb even higher.


Forex-Time-LogoArticle by ForexTime

ForexTime Ltd (FXTM) is an award winning international online forex broker regulated by CySEC 185/12 www.forextime.com