Article By RoboForex.com
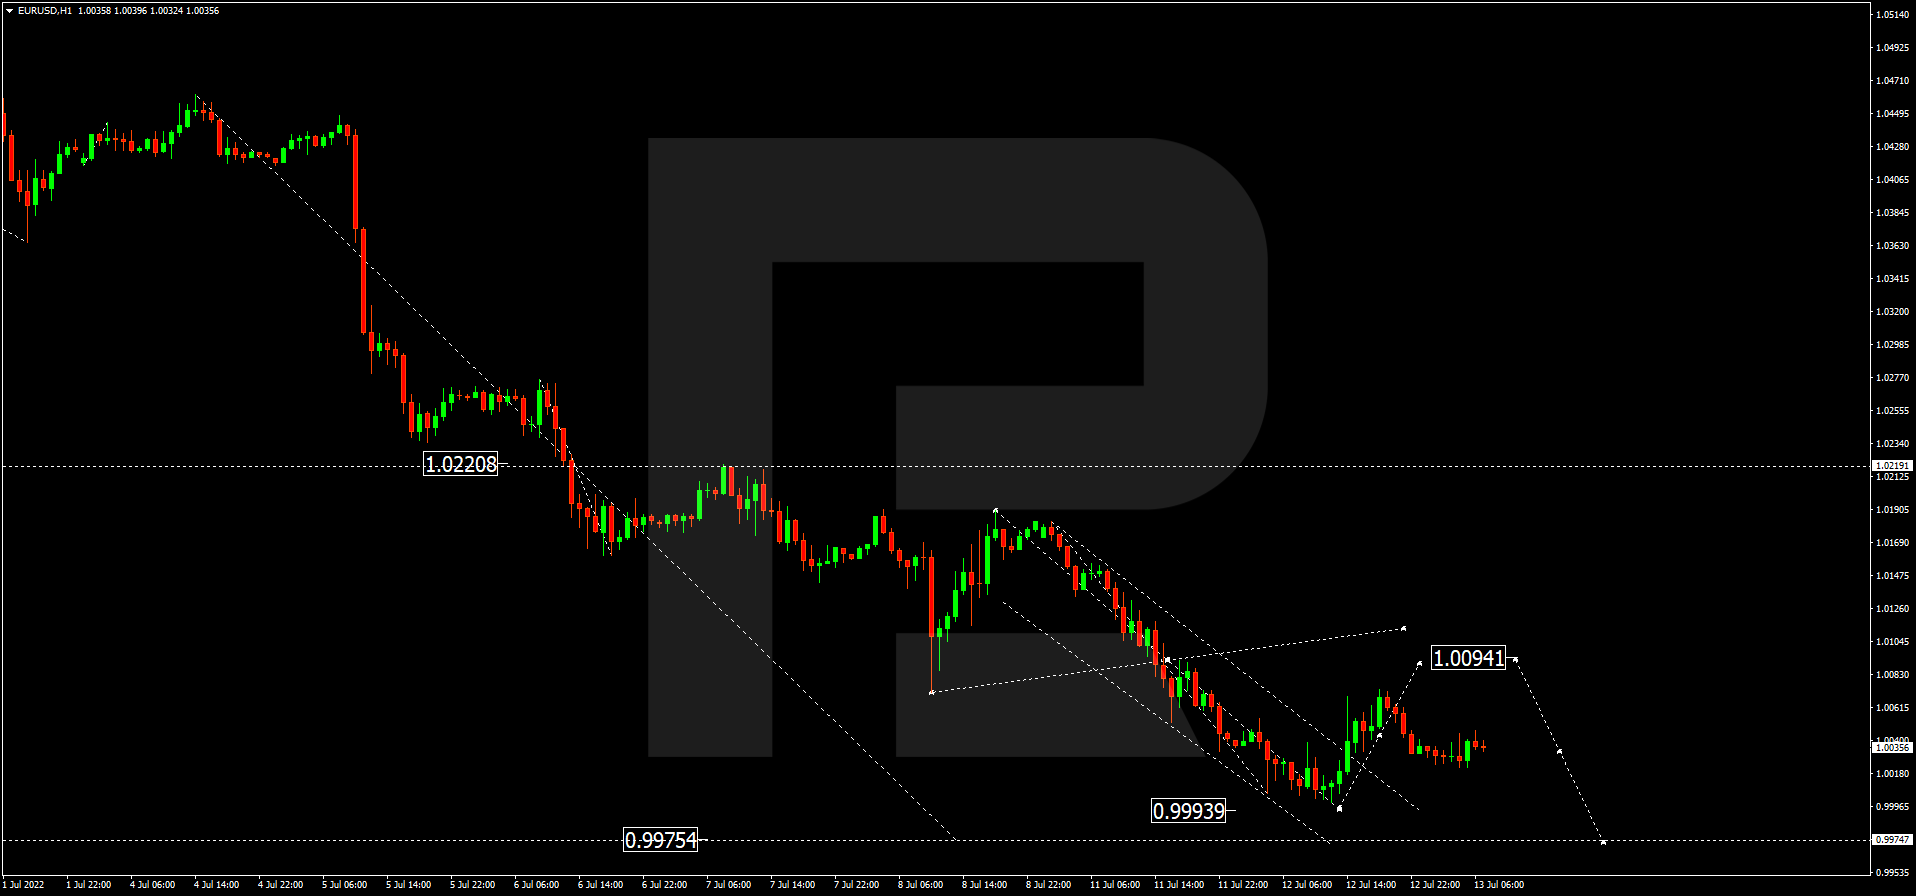
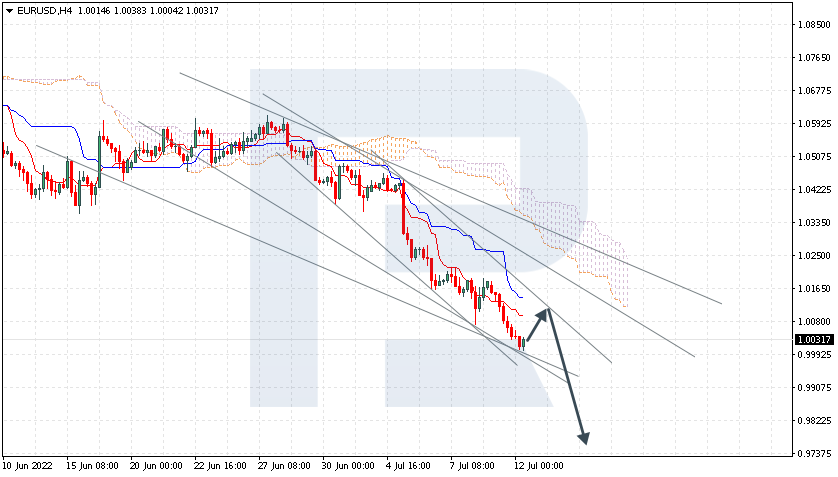
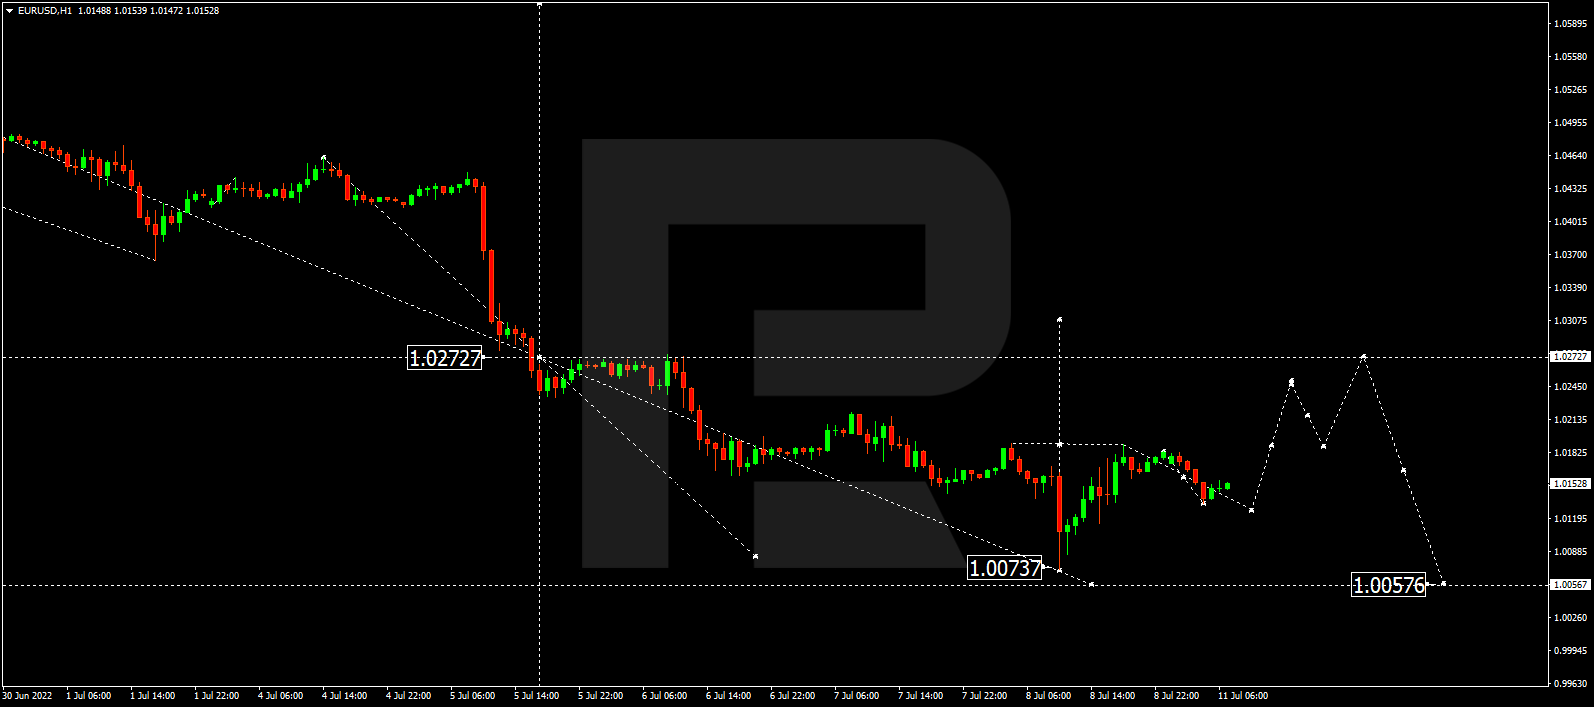
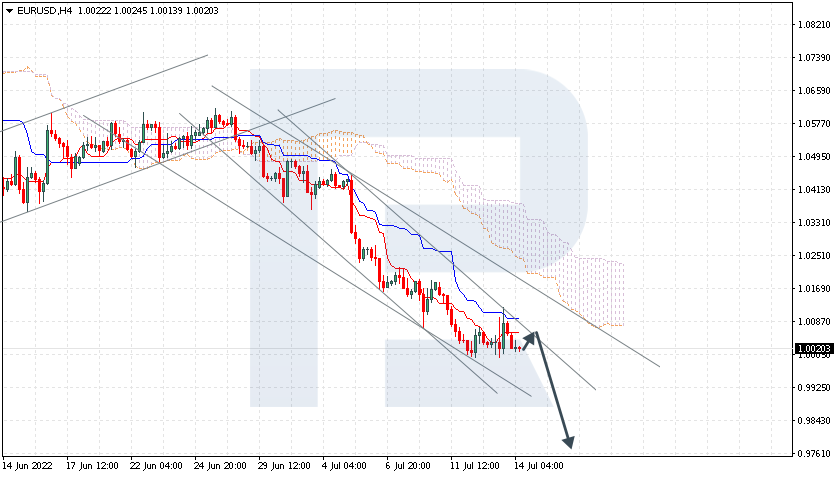
EURUSD, “Euro vs US Dollar”
EURUSD is testing the support level. The instrument is currently moving below Ichimoku Cloud, thus indicating a descending tendency. The markets could indicate that the price may test Tenkan-Sen, at 1.0055 and then resume moving downwards to reach 0.9765. Another signal in favour of a further downtrend will be a rebound from the descending channel’s upside border. However, the bearish scenario may no longer be valid if the price breaks the cloud’s upside border and fixes above 1.0265. In this case, the pair may continue to grow towards 1.0355.

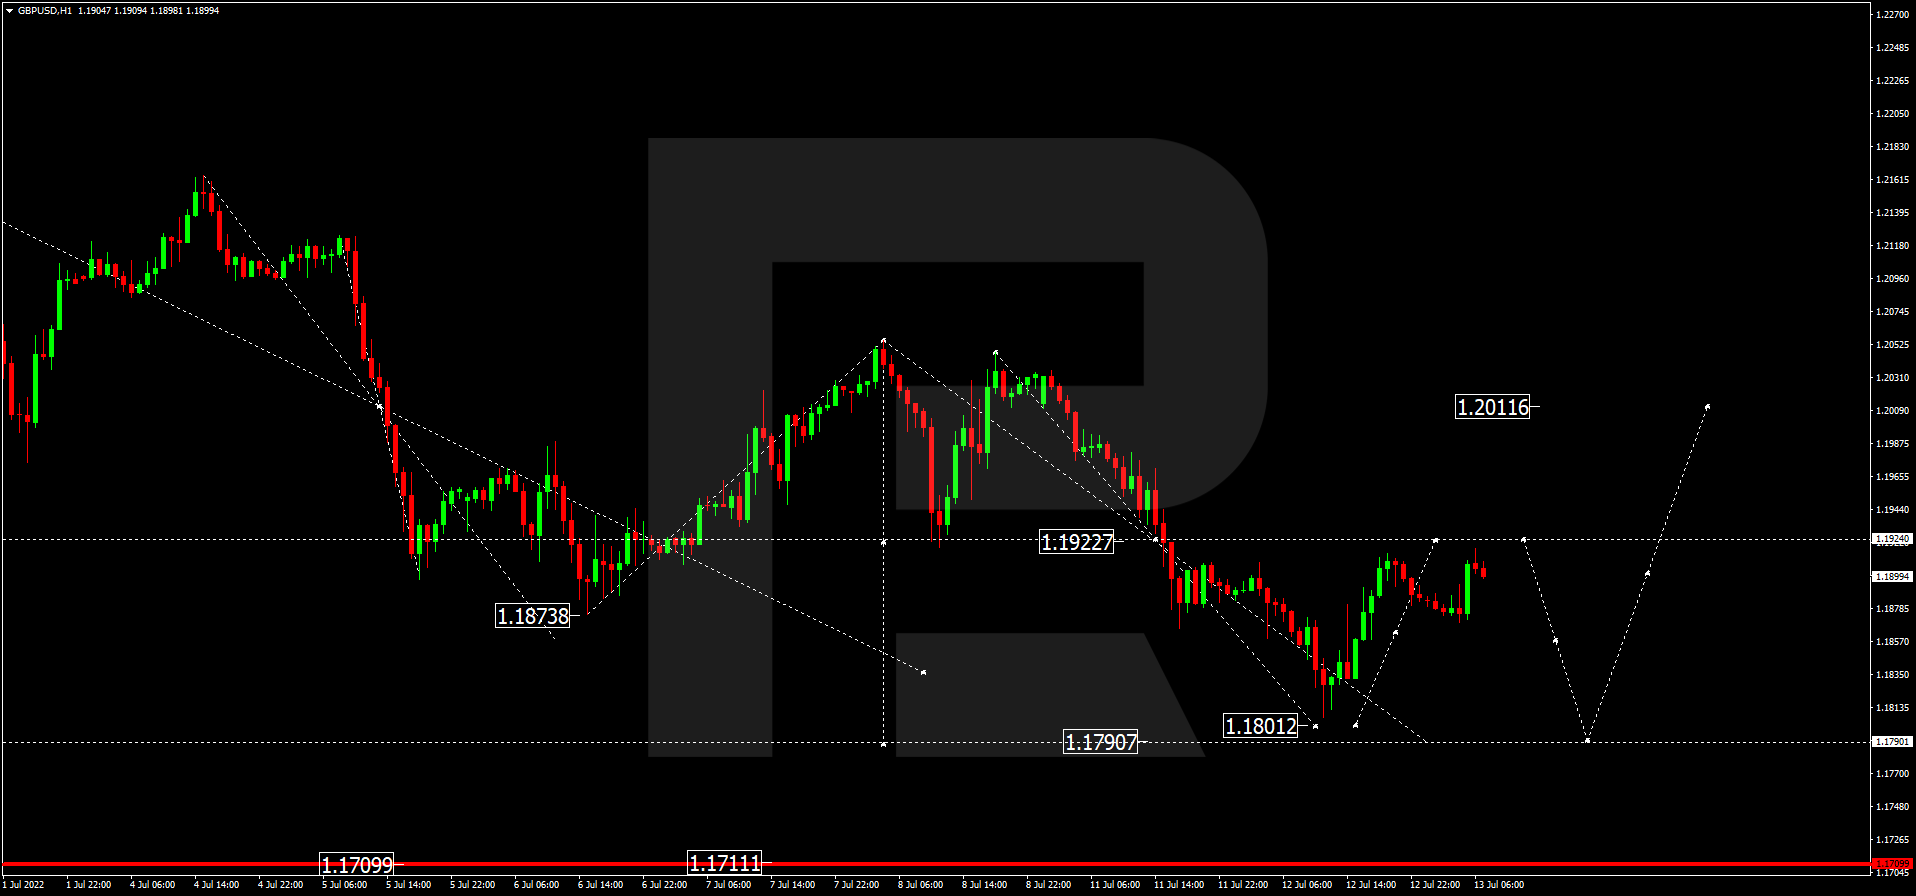
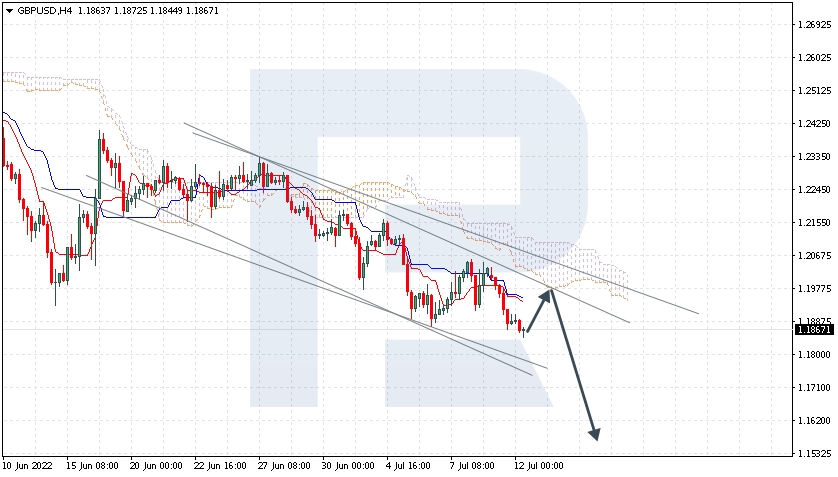
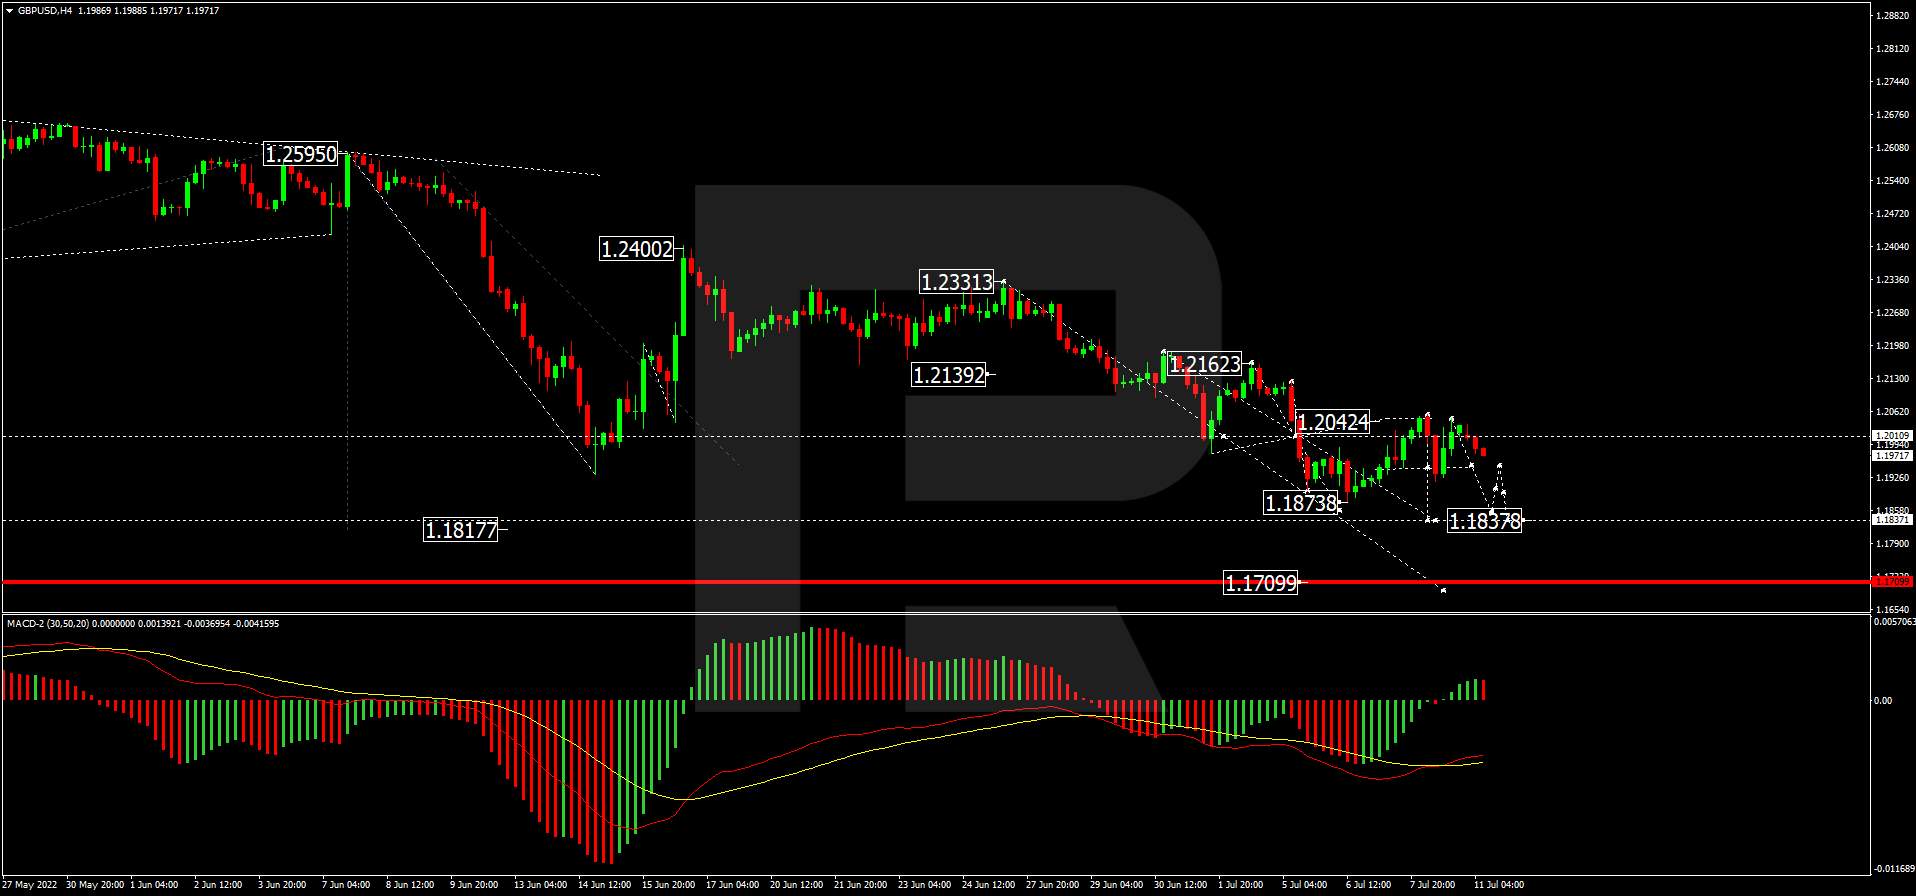
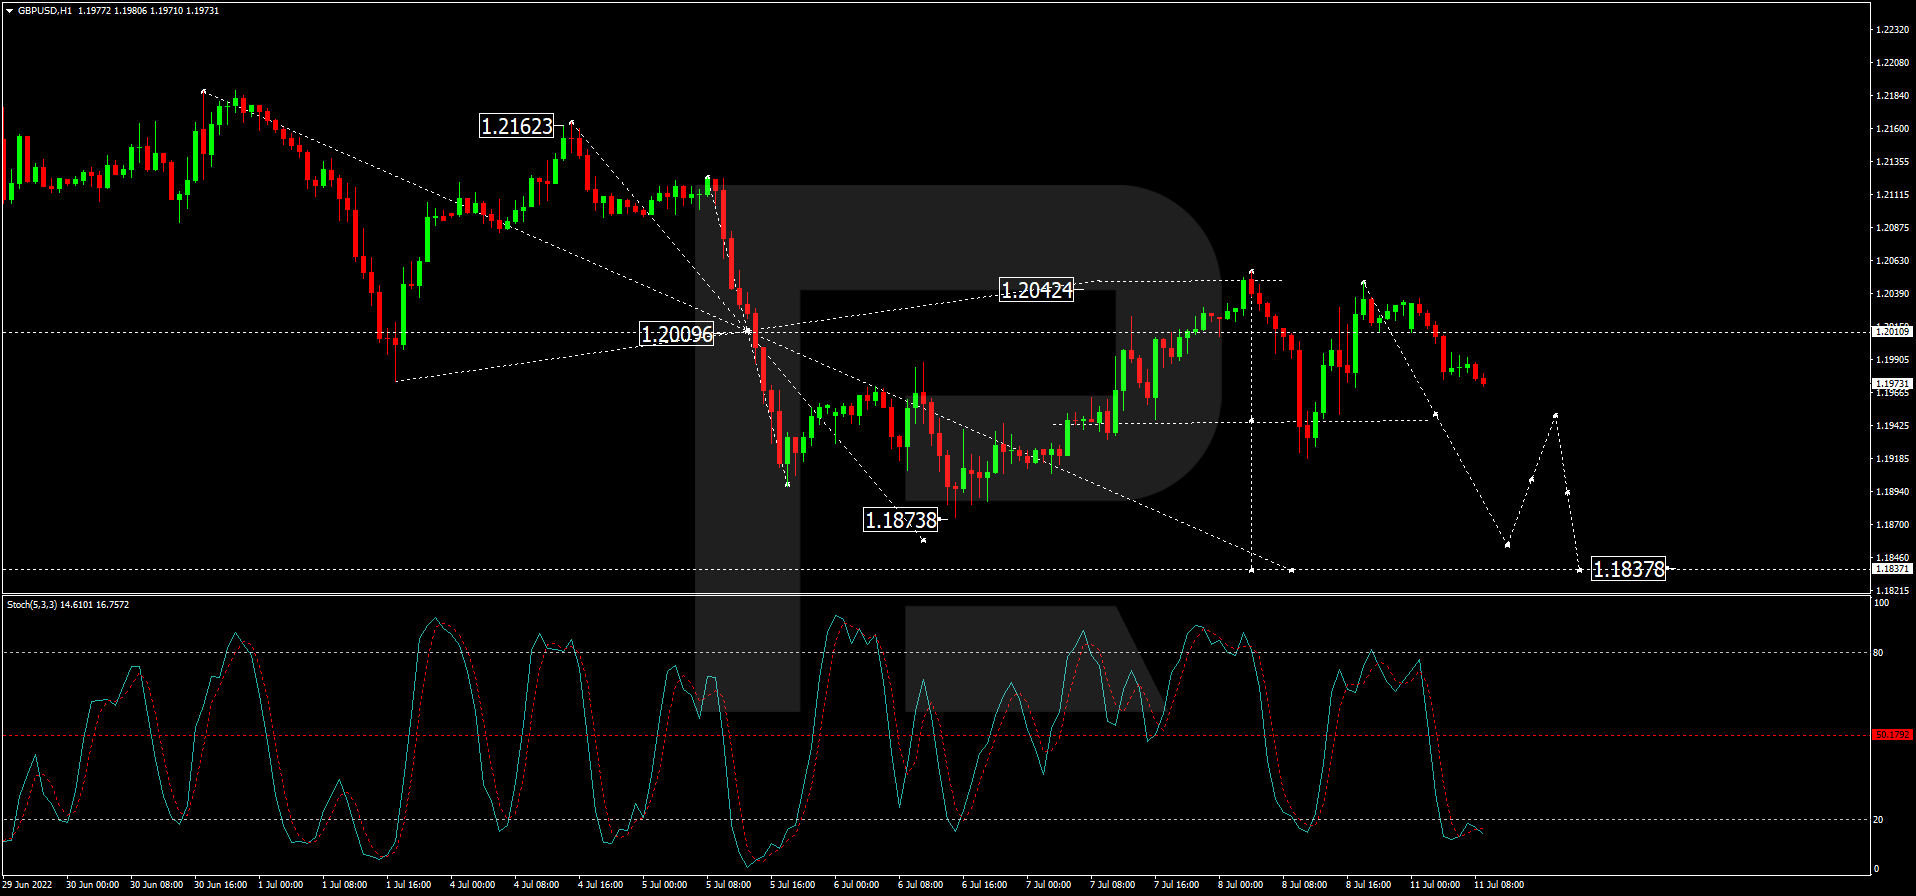
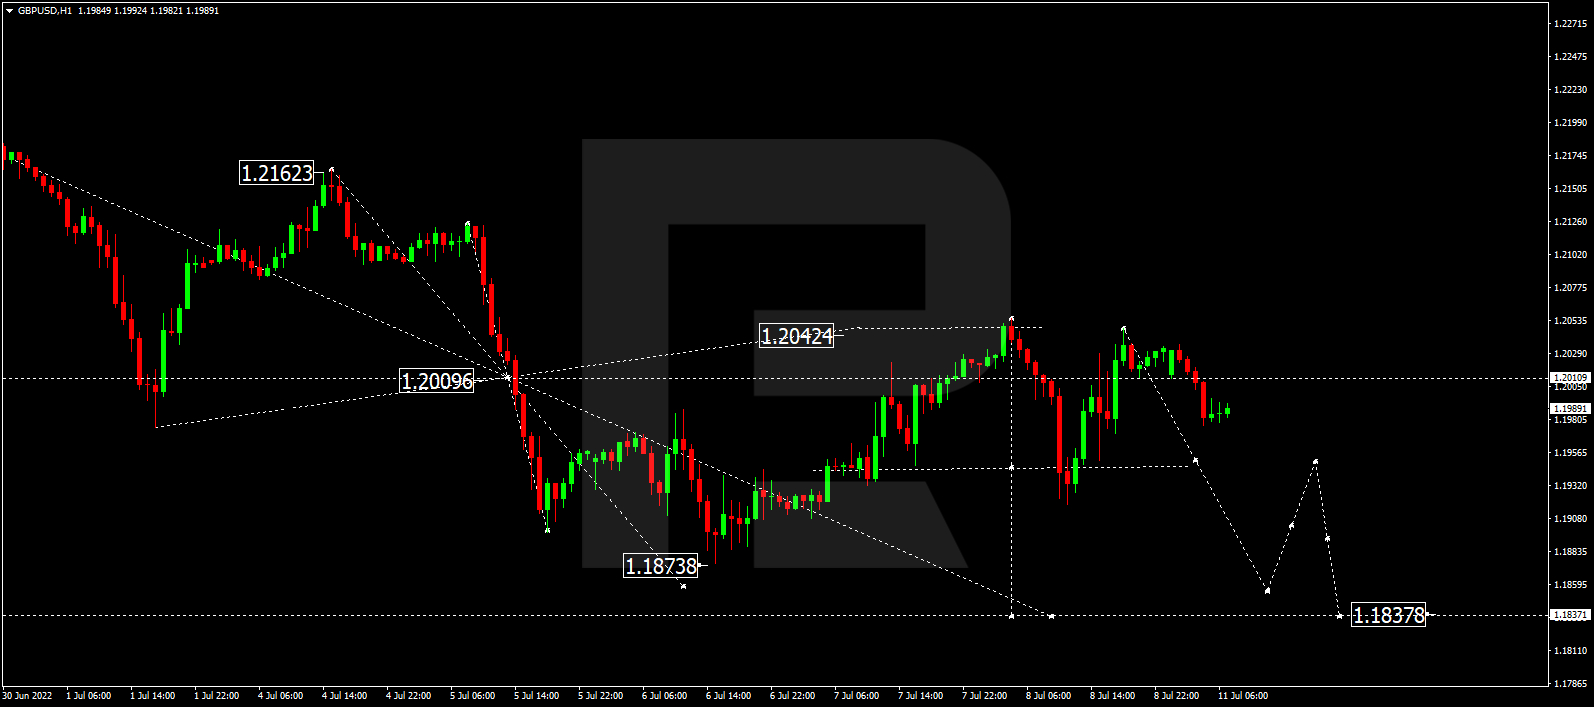
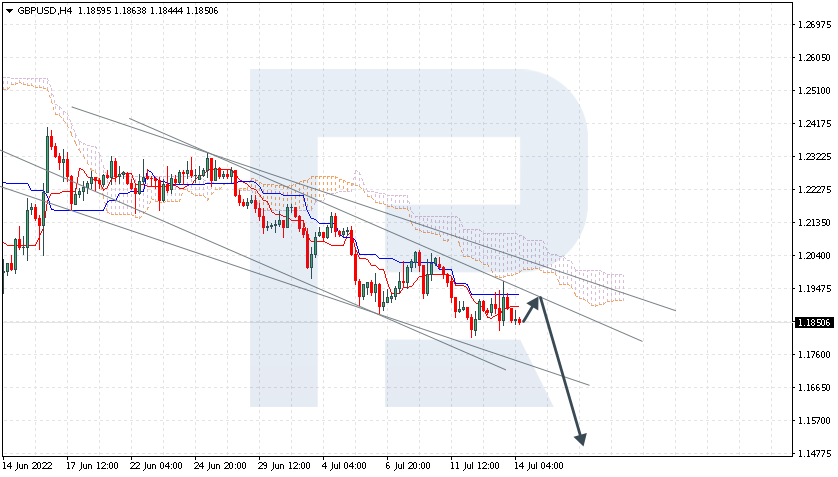
GBPUSD, “Great Britain Pound vs US Dollar”
GBPUSD is rebounding from Tenkan-Sen and Kijun-Sen. The instrument is currently moving below Ichimoku Cloud, thus indicating a descending tendency. The markets could indicate that the price may test Kijun-Sen, at 1.1865, and then resume moving downwards to reach 1.1495. Another signal in favour of a further downtrend will be a rebound from the descending channel’s upside border. However, the bearish scenario may no longer be valid if the price breaks the cloud’s upside border and fixes above 1.2145. In this case, the pair may continue to grow towards 1.2235.
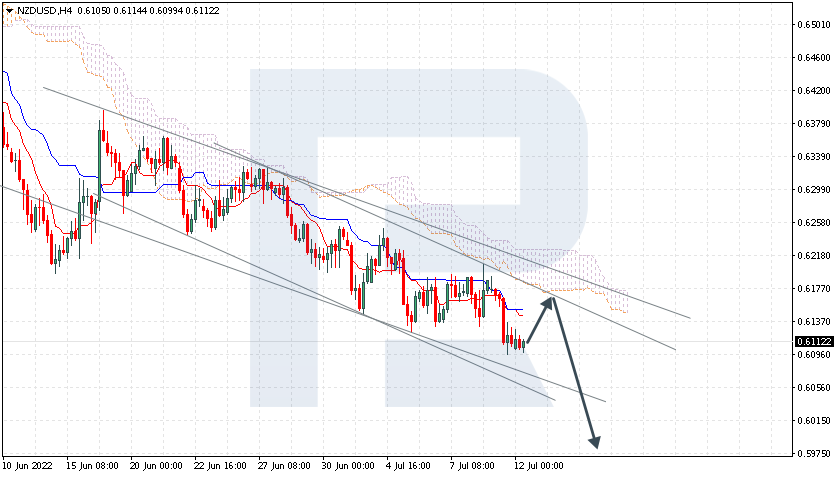
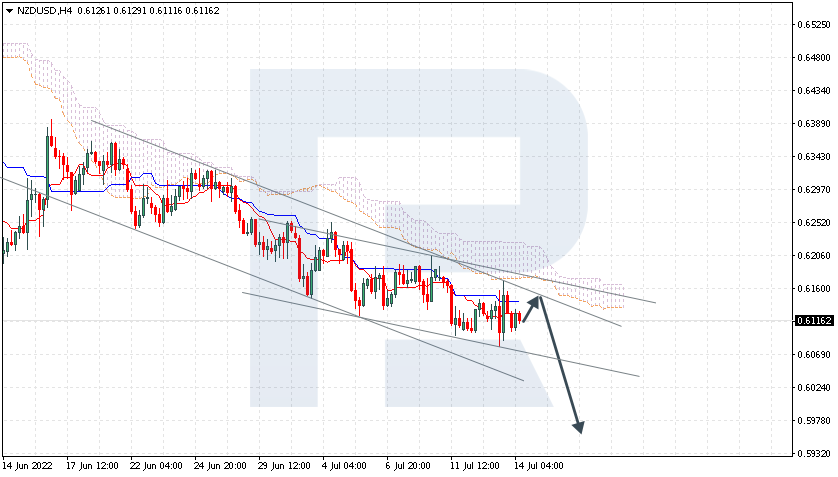
NZDUSD, “New Zealand Dollar vs US Dollar”
NZDUSD continues rebounding from the resistance level. The instrument is currently moving below Ichimoku Cloud, thus indicating a descending tendency. The markets could indicate that the price may test Kijun-Sen, at 0.6125 and then resume moving downwards to reach 0.5965. Another signal in favour of a further downtrend will be a rebound from the descending channel’s upside border. However, the bearish scenario may no longer be valid if the price breaks the cloud’s upside border and fixes above 0.6260. In this case, the pair may continue to grow towards 0.6350.
Article By RoboForex.com
Attention!
Forecasts presented in this section only reflect the author’s private opinion and should not be considered as guidance for trading. RoboForex LP bears no responsibility for trading results based on trading recommendations described in these analytical reviews.