Article By RoboForex.com
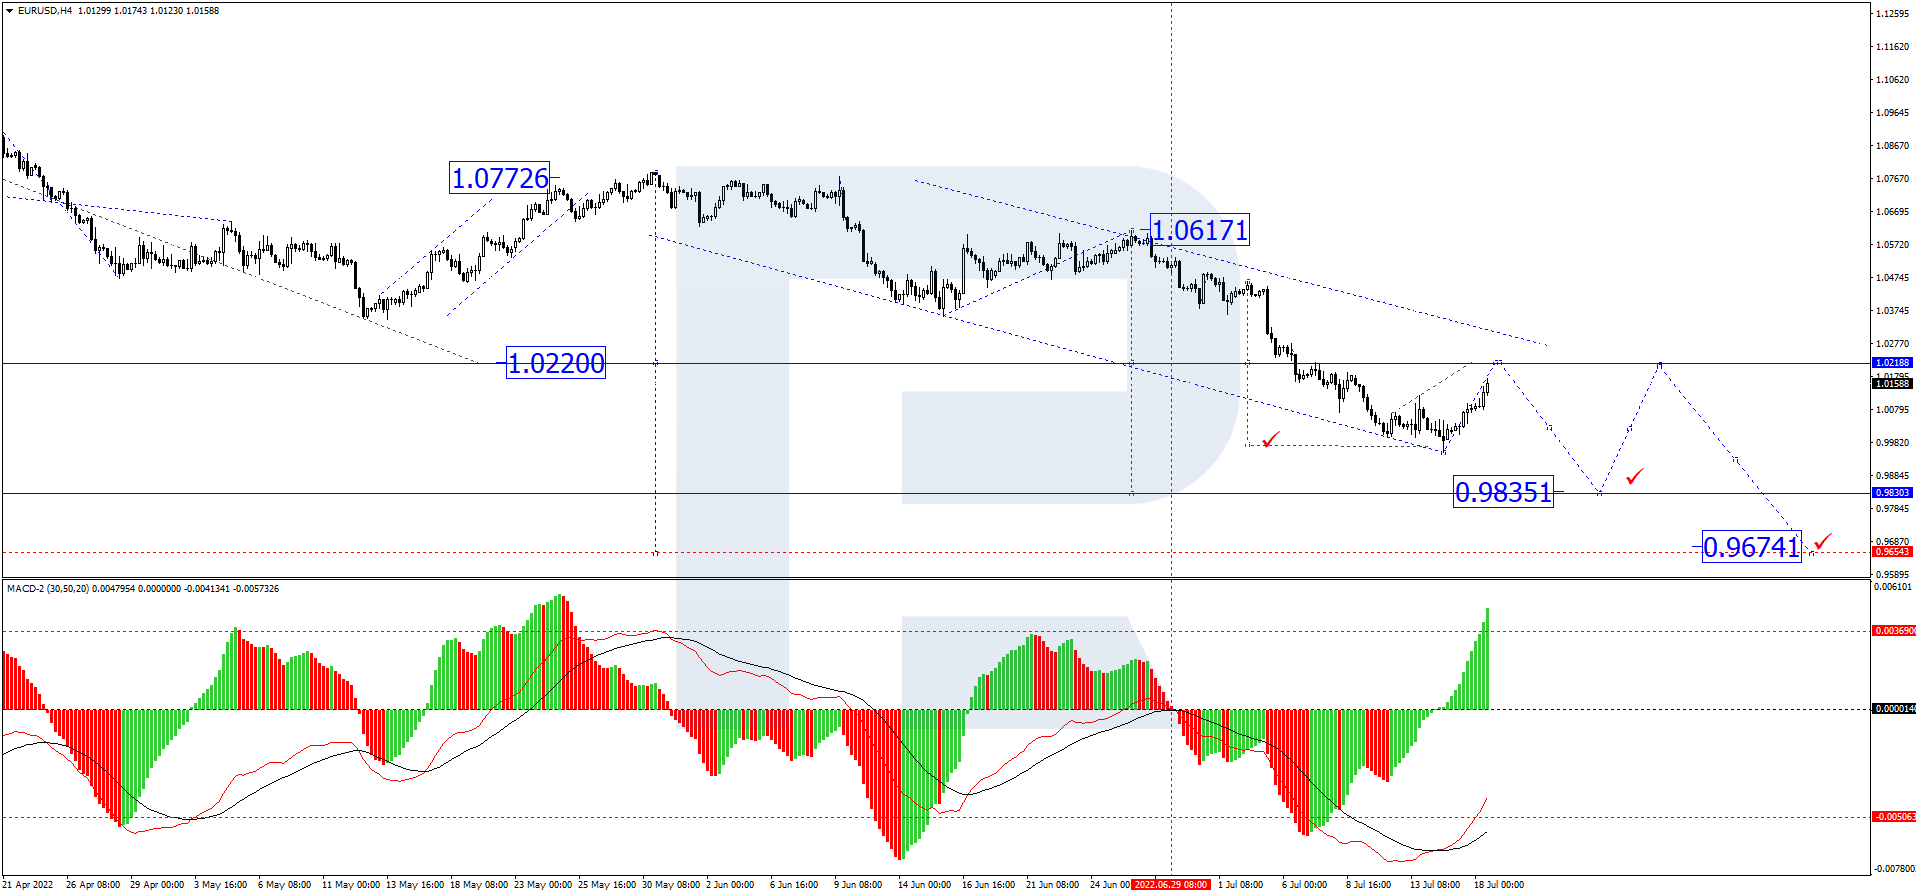
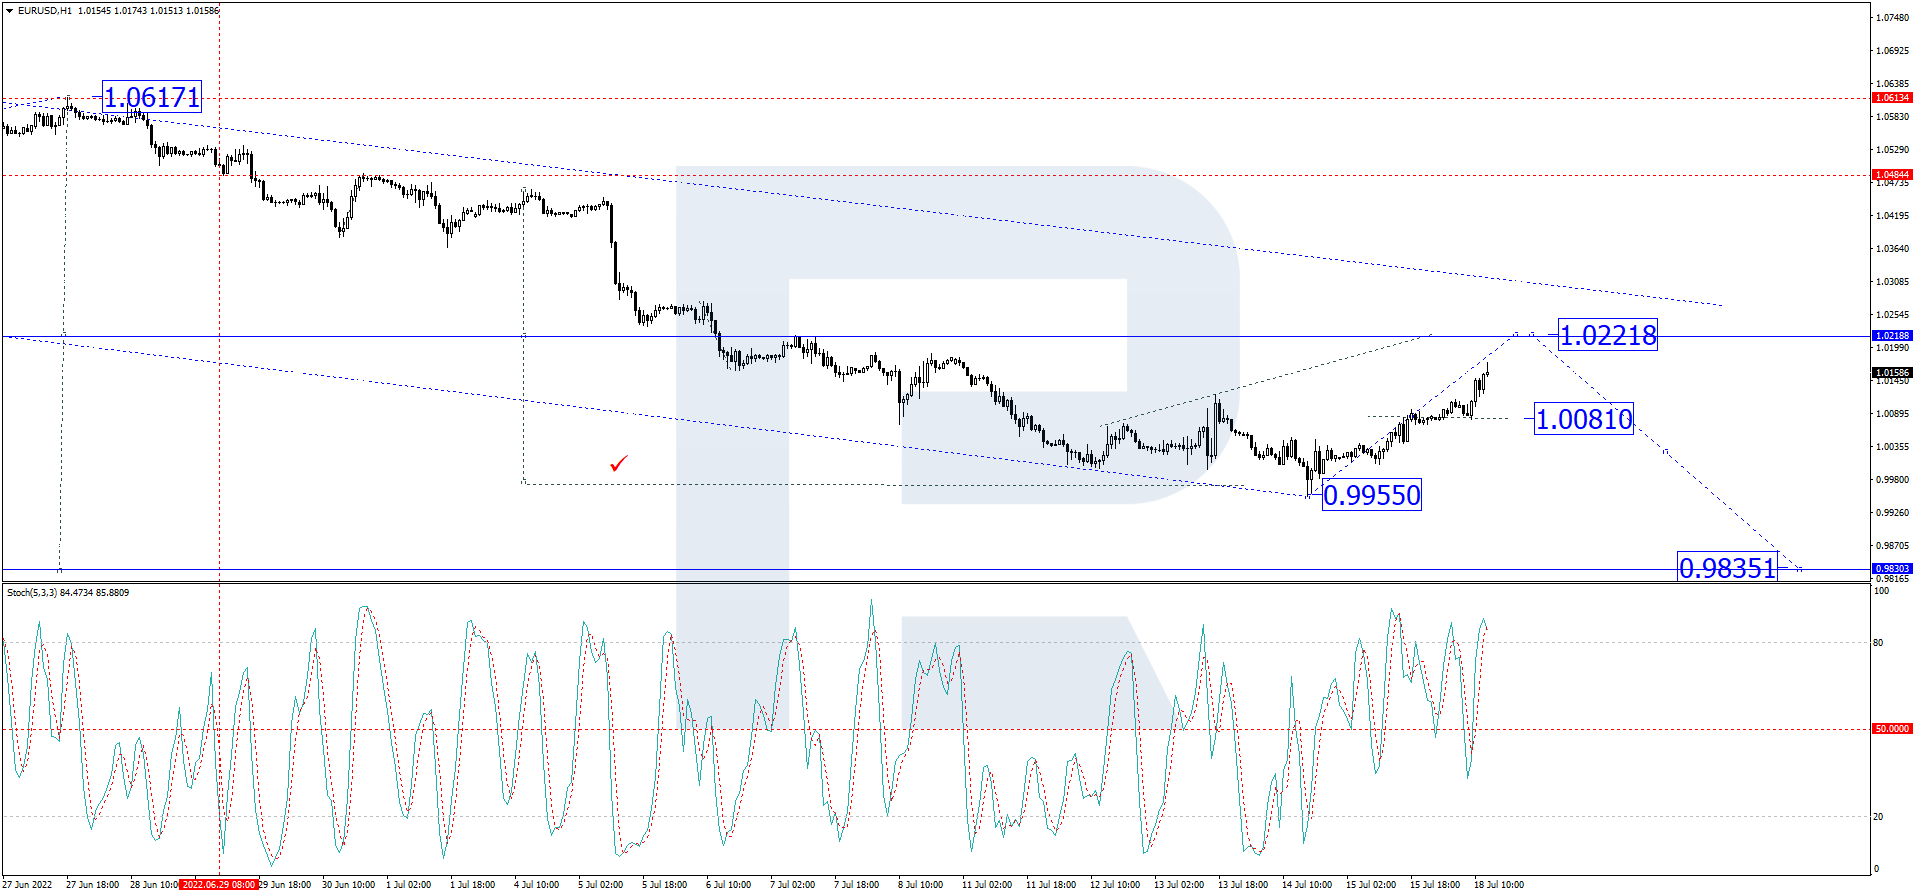
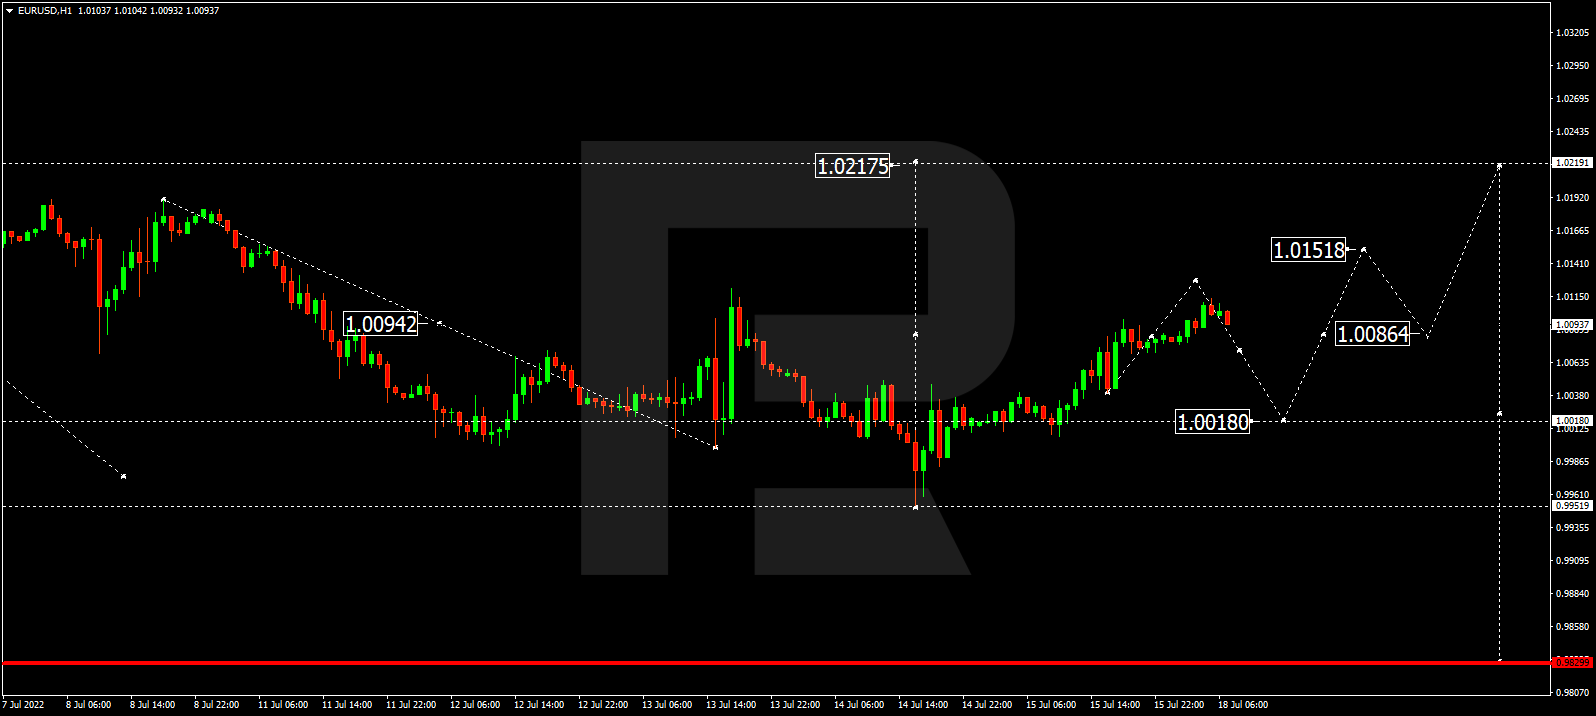
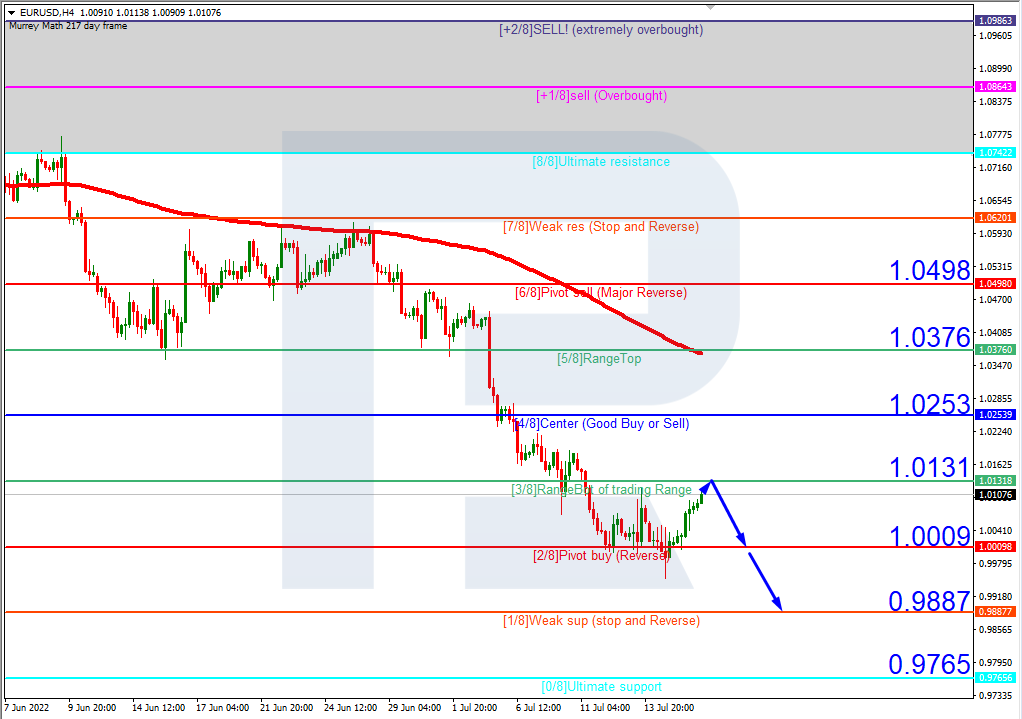
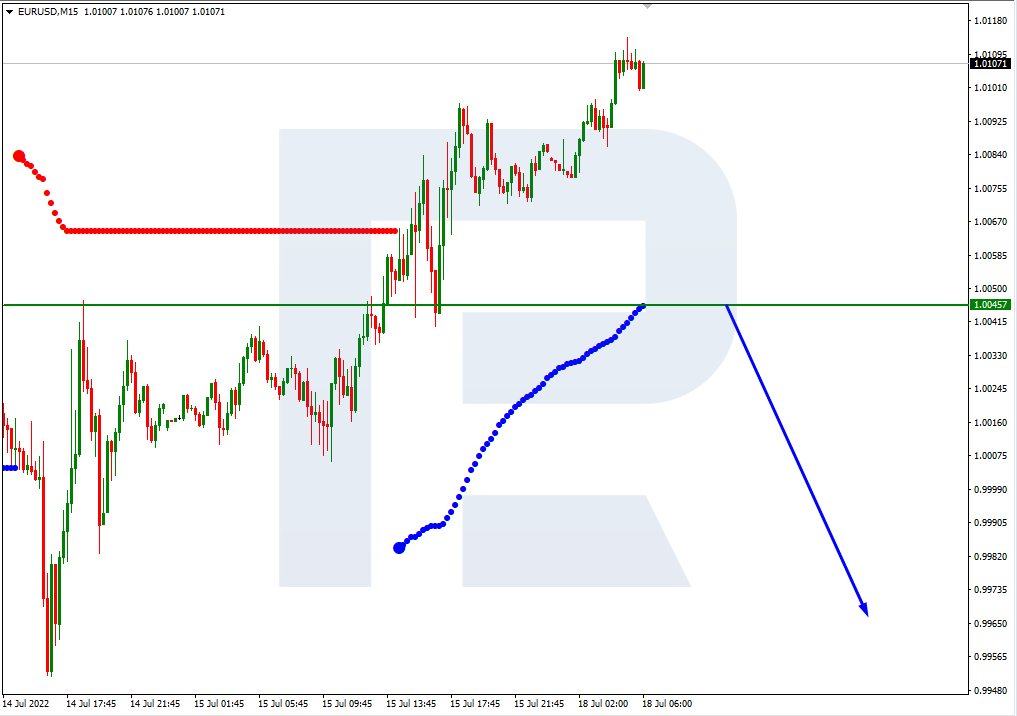
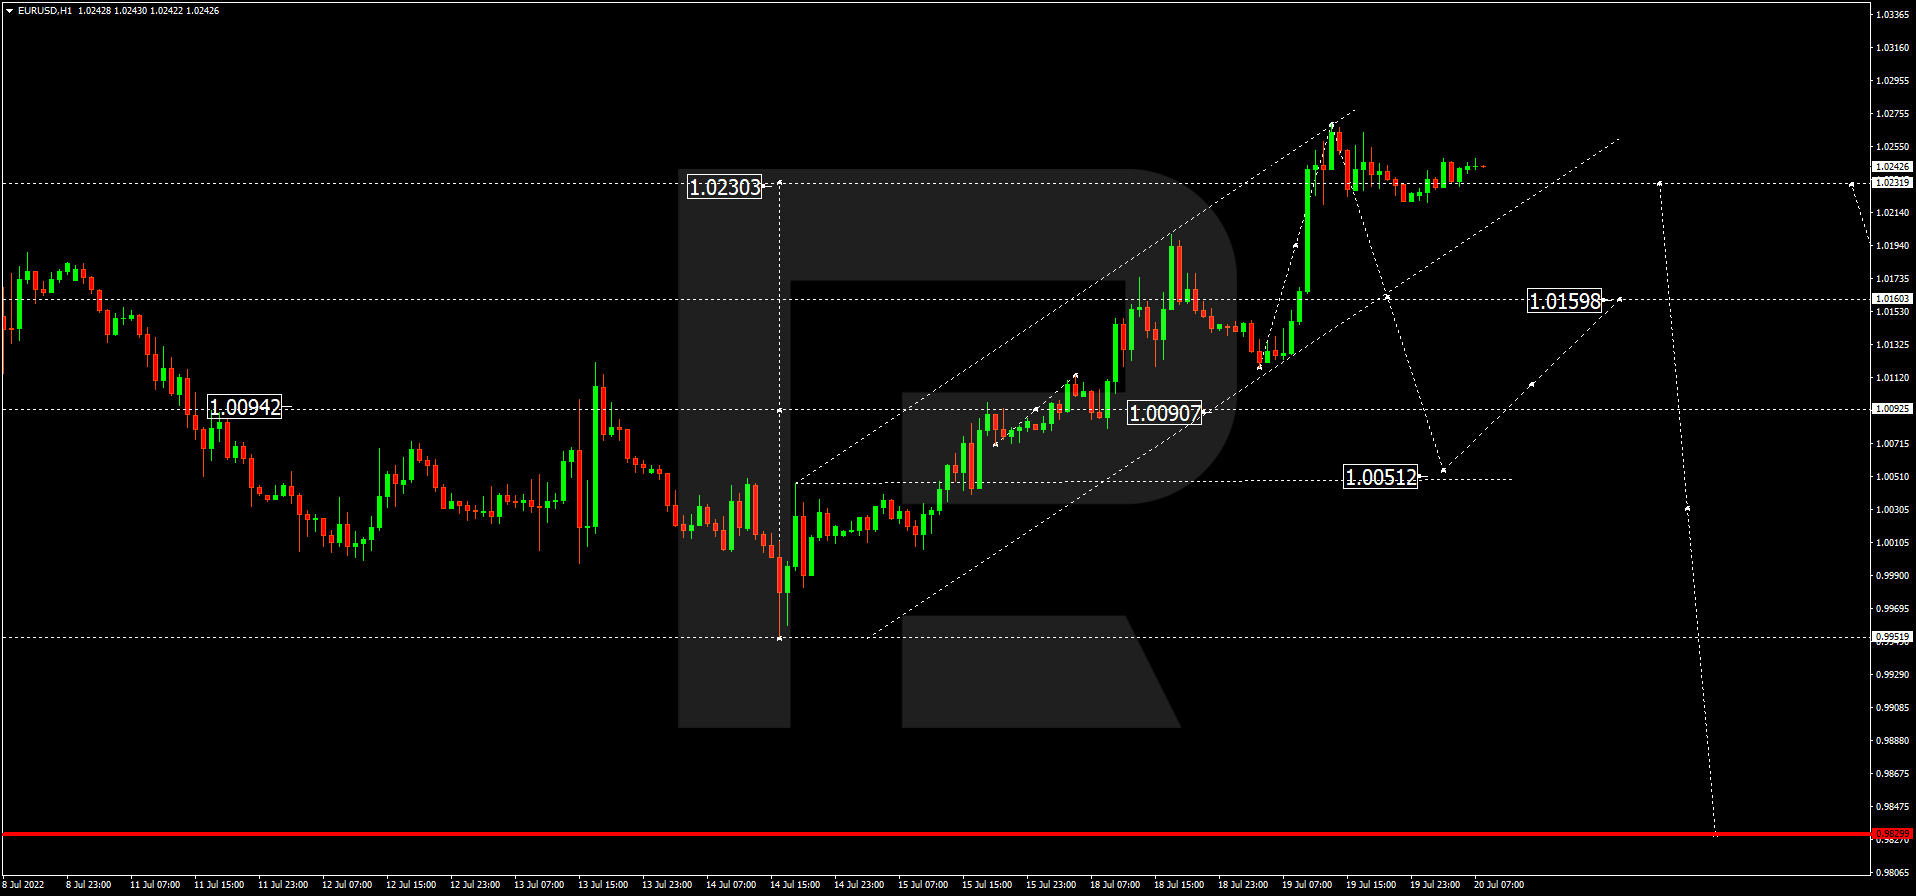
EURUSD, “Euro vs US Dollar”
Having finished the ascending wave at 1.0230, EURUSD is consolidating around this level. Possibly, the pair may break it to the downside and then resume moving within the downtrend with the first target at 1.0051.

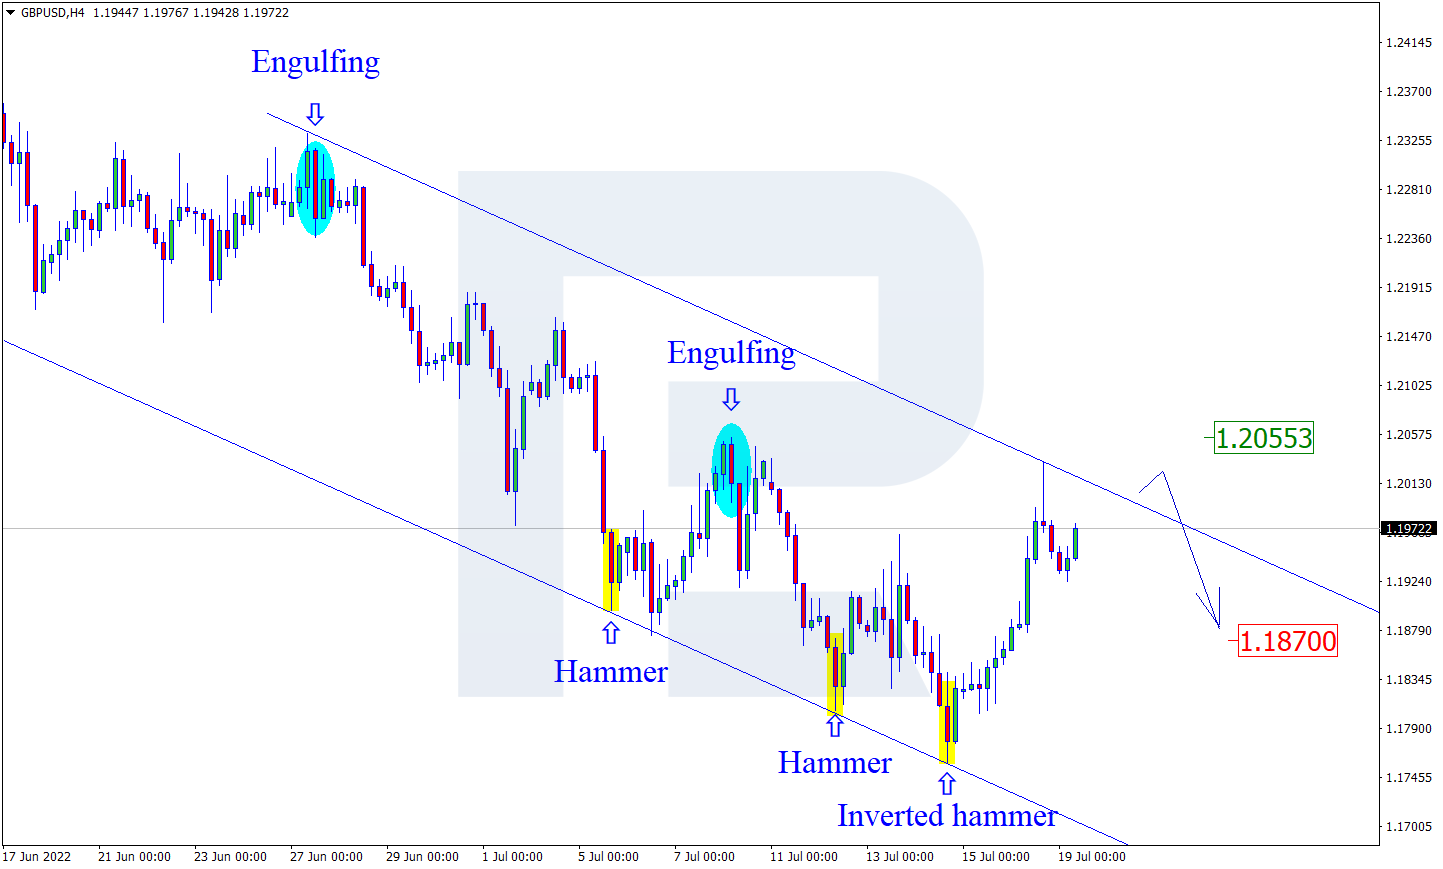
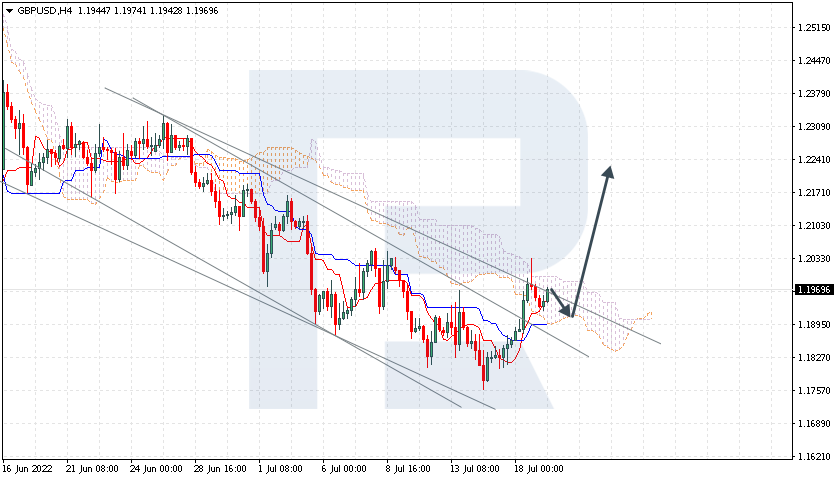
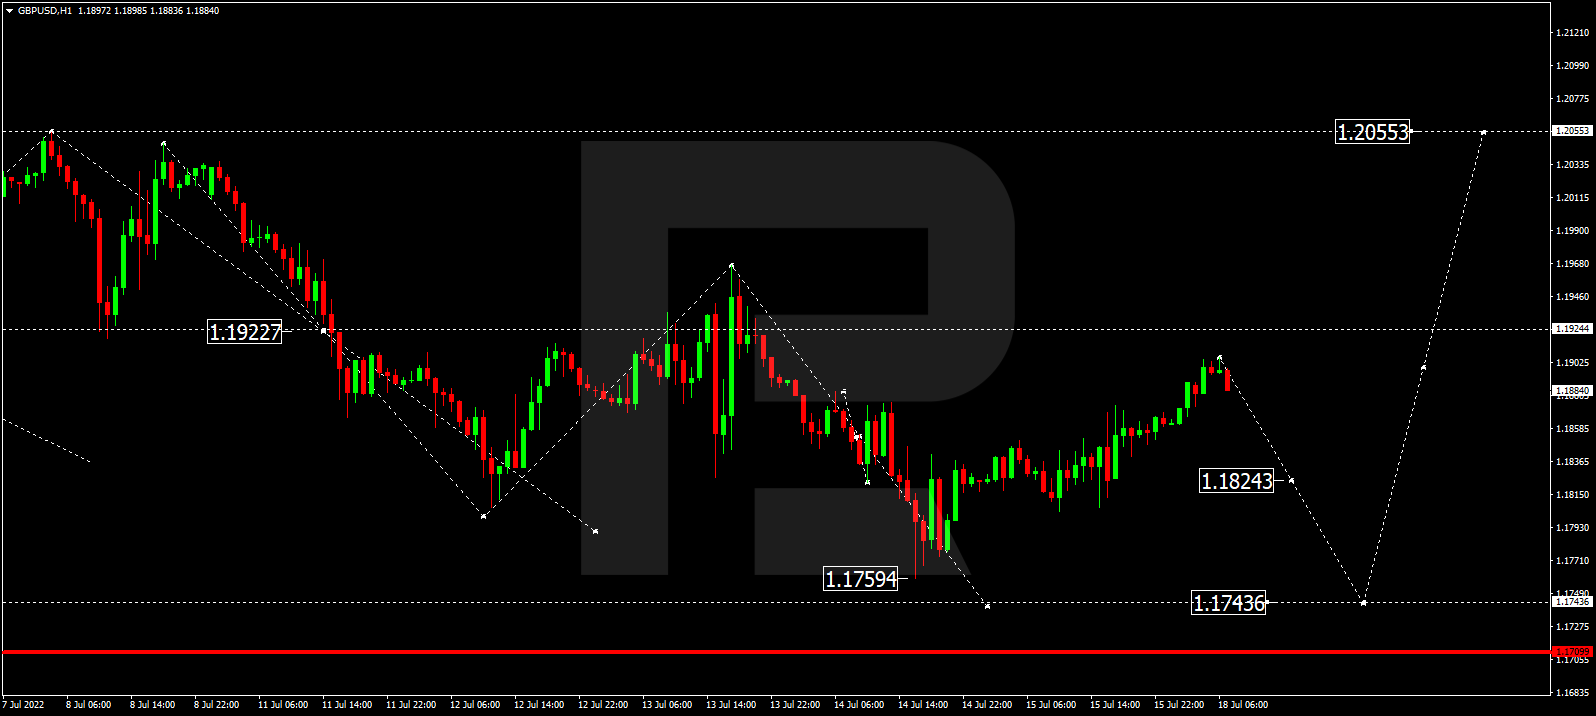
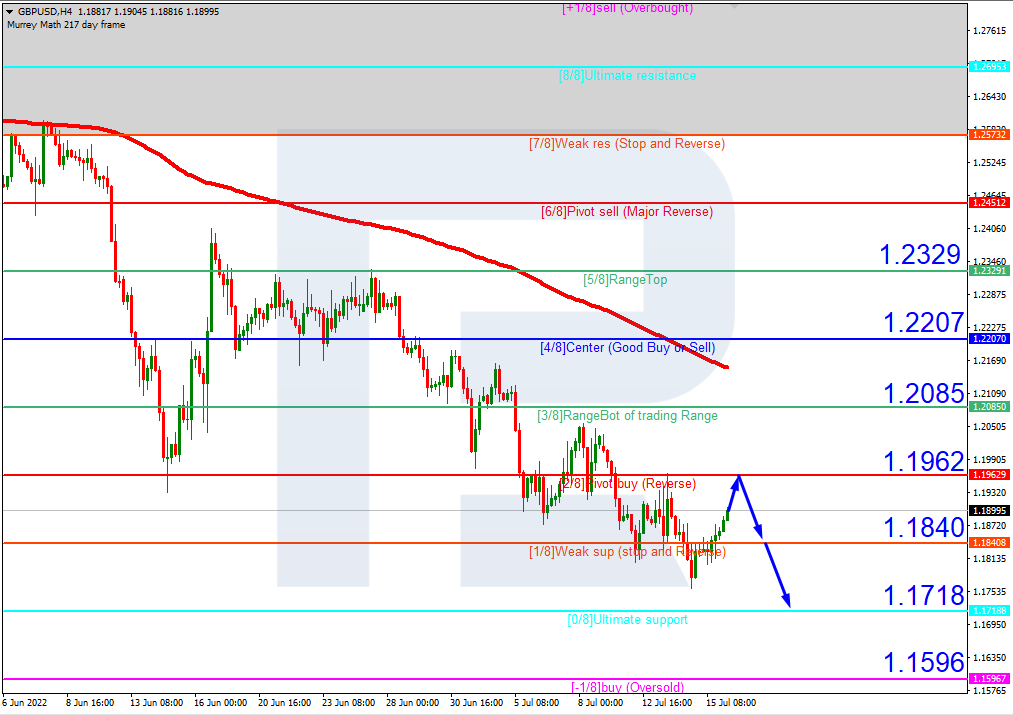
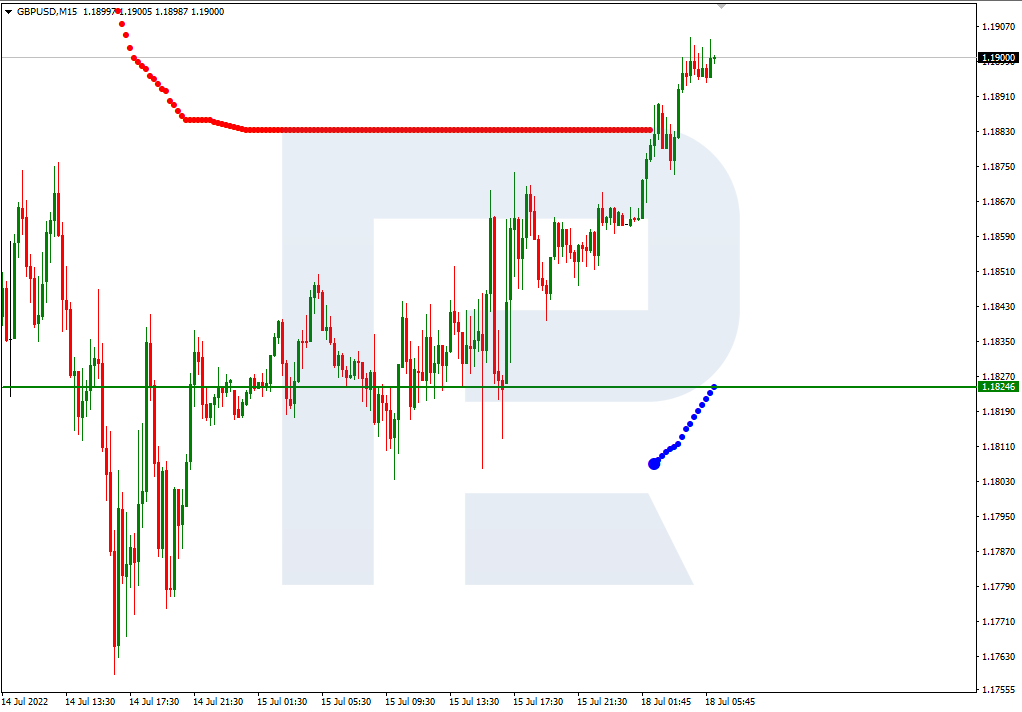
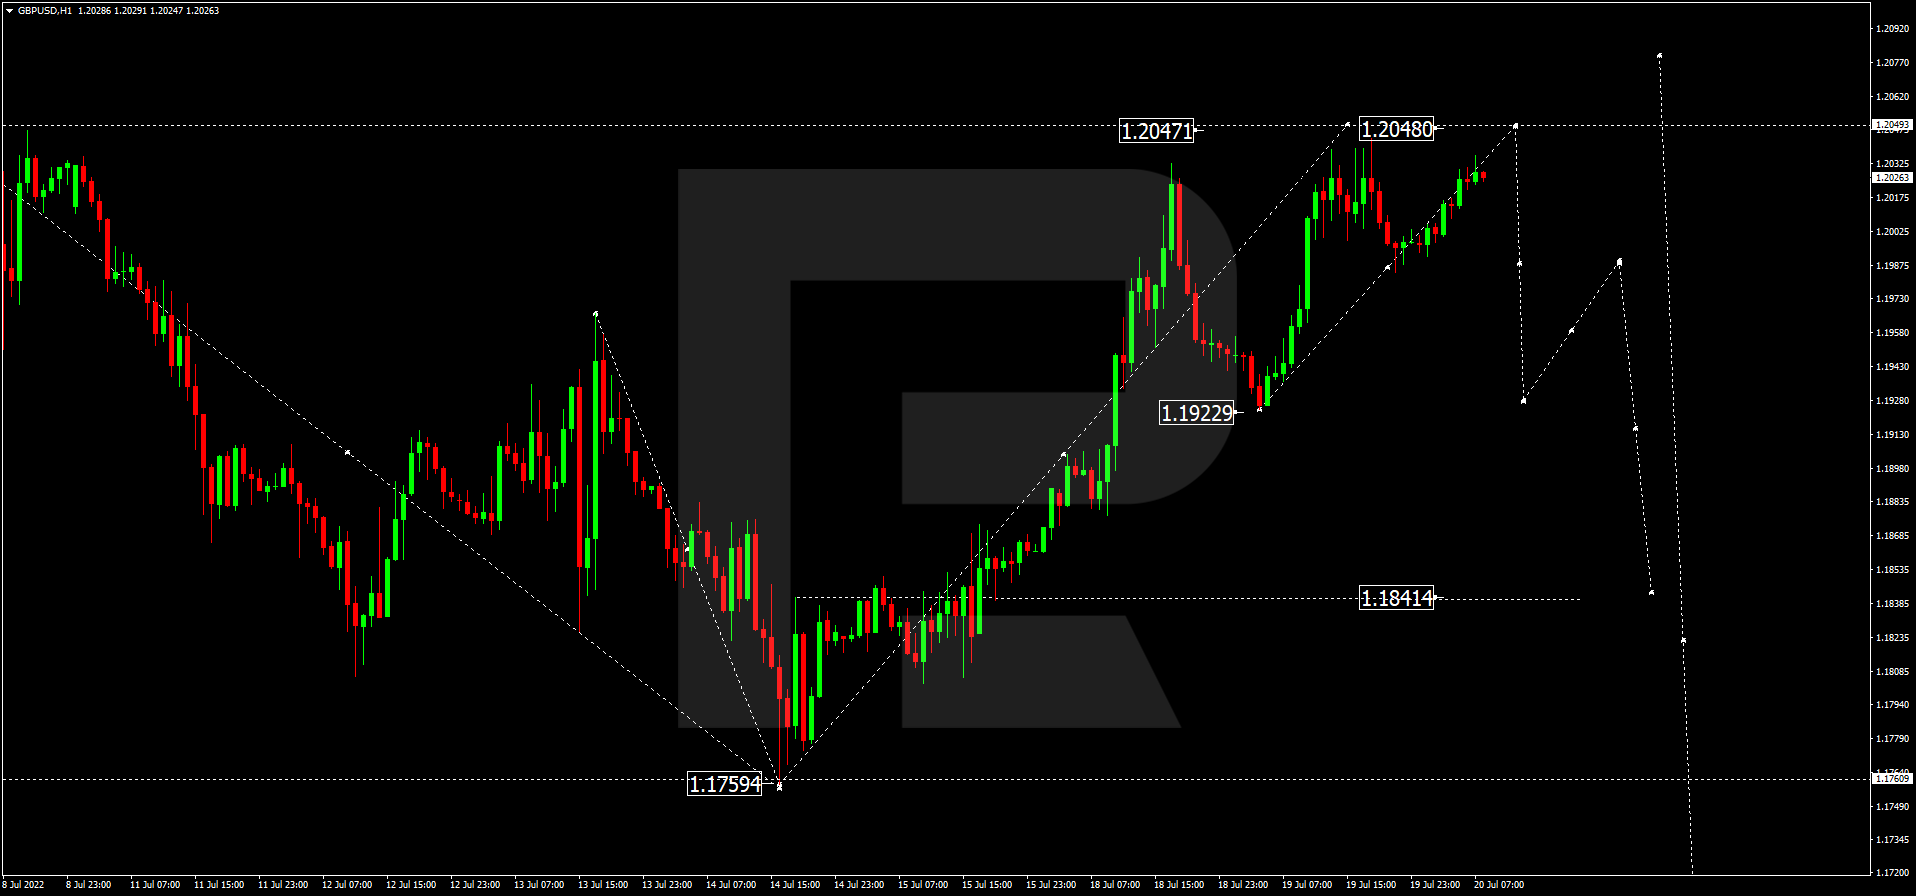
GBPUSD, “Great Britain Pound vs US Dollar”
GBPUSD is still growing towards 1.2048 and may later form a new descending structure with the first target at 1.1922. After that, the instrument may resume trading upwards to reach 1.1988 and then start another decline towards 1.1814.
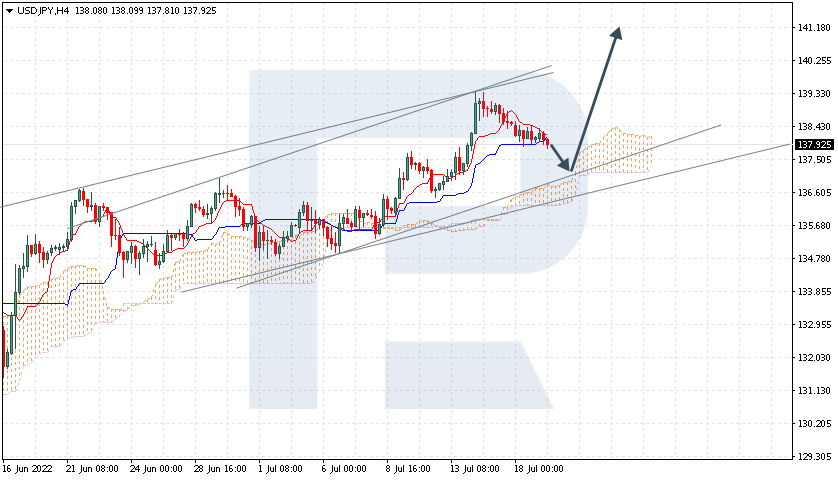
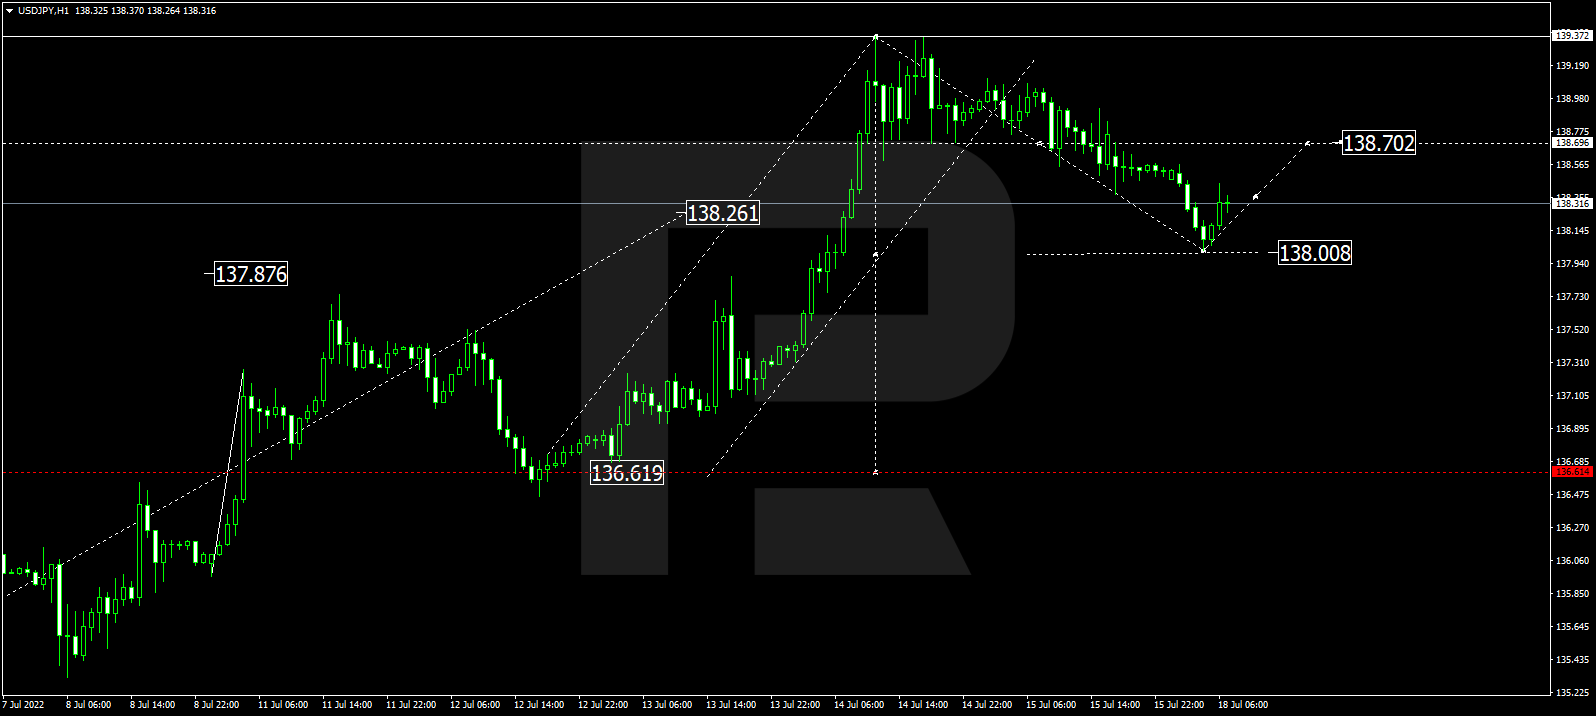
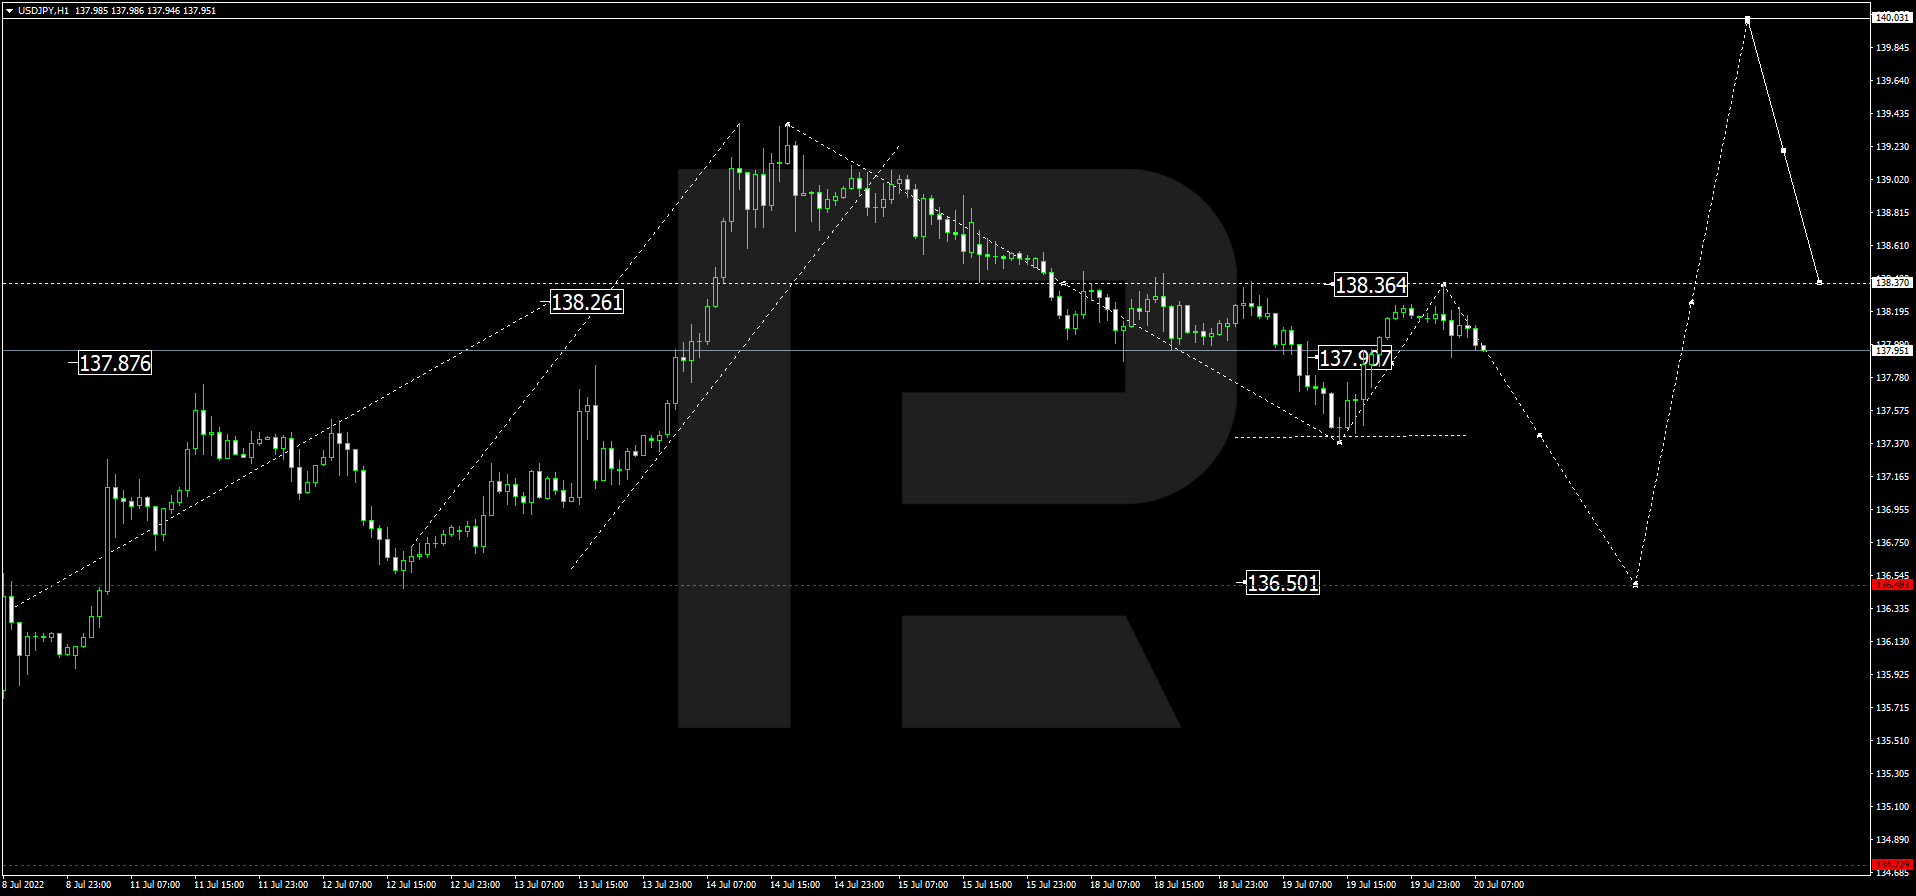
USDJPY, “US Dollar vs Japanese Yen”
USDJPY has finished the descending wave at 137.40 along with the correction up to 138.36, thus forming a new consolidation range between these two levels. If the price breaks the range to the upside, the market may resume growing with the target at 140.00; if to the downside – start a new decline to reach 136.50.
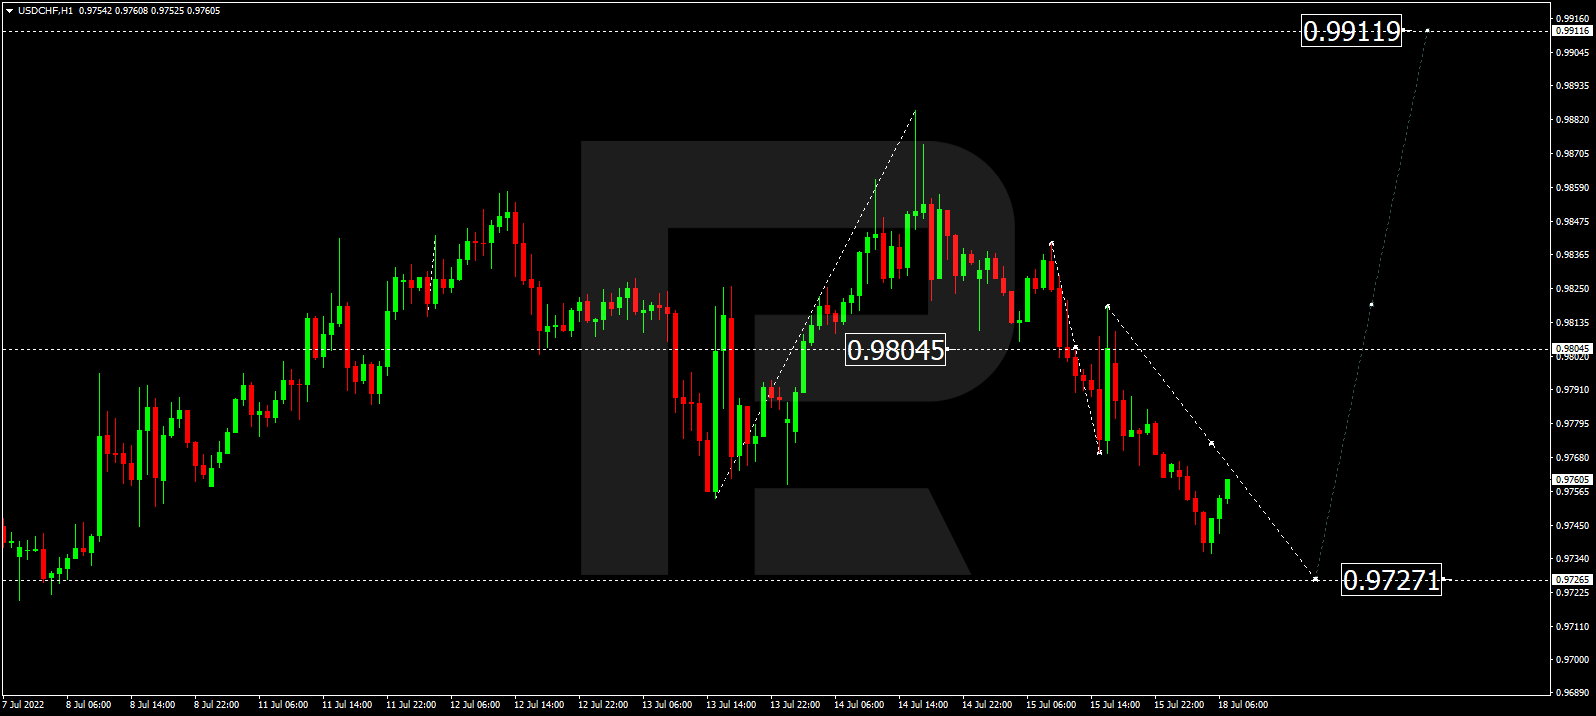
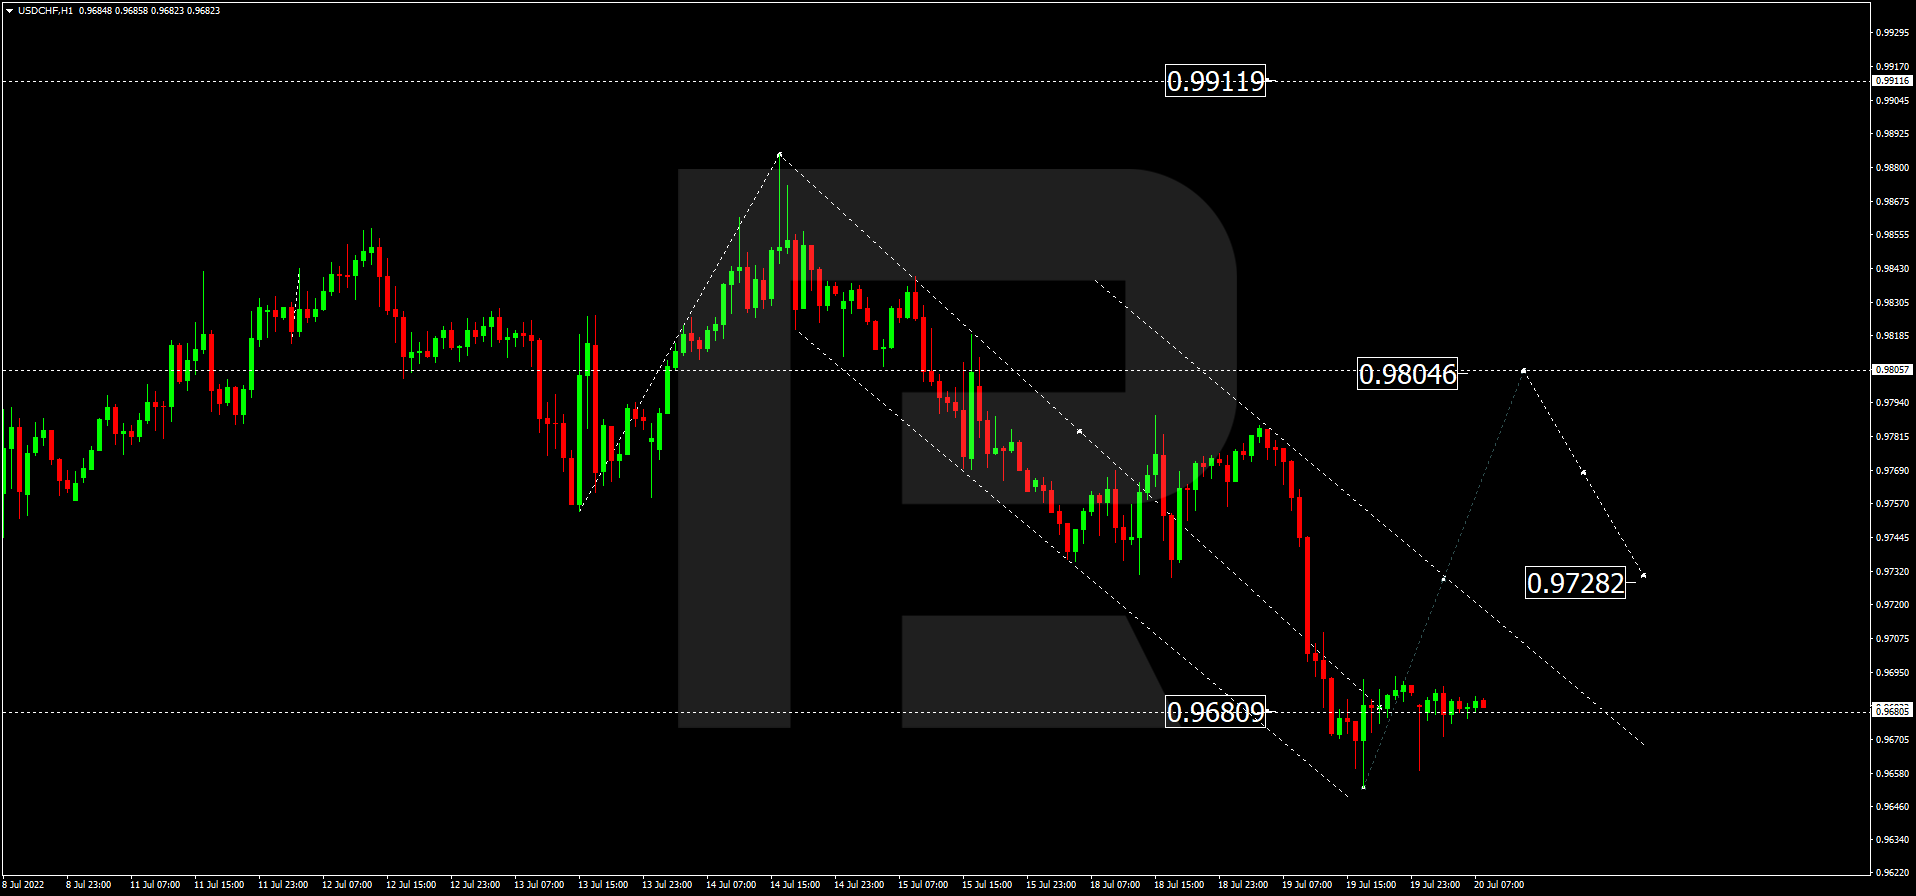
USDCHF, “US Dollar vs Swiss Franc”
After completing the descending wave at 0.9680, USDCHF is consolidating around this level. Possibly, the pair may break the range to the upside and form one more ascending wave towards 0.9804. After that, the instrument may correct down to 0.9728 and then resume trading upwards with the target at 0.9911.
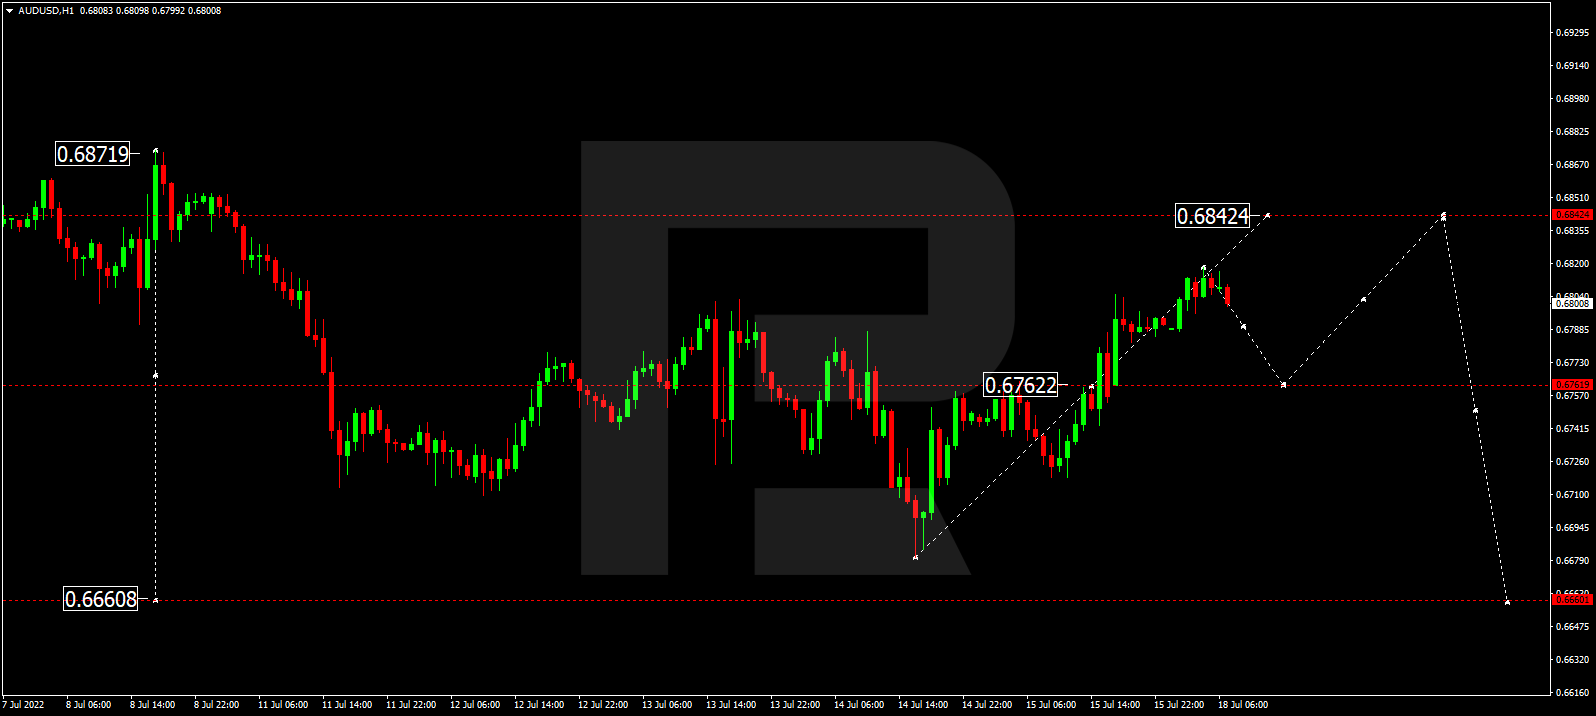
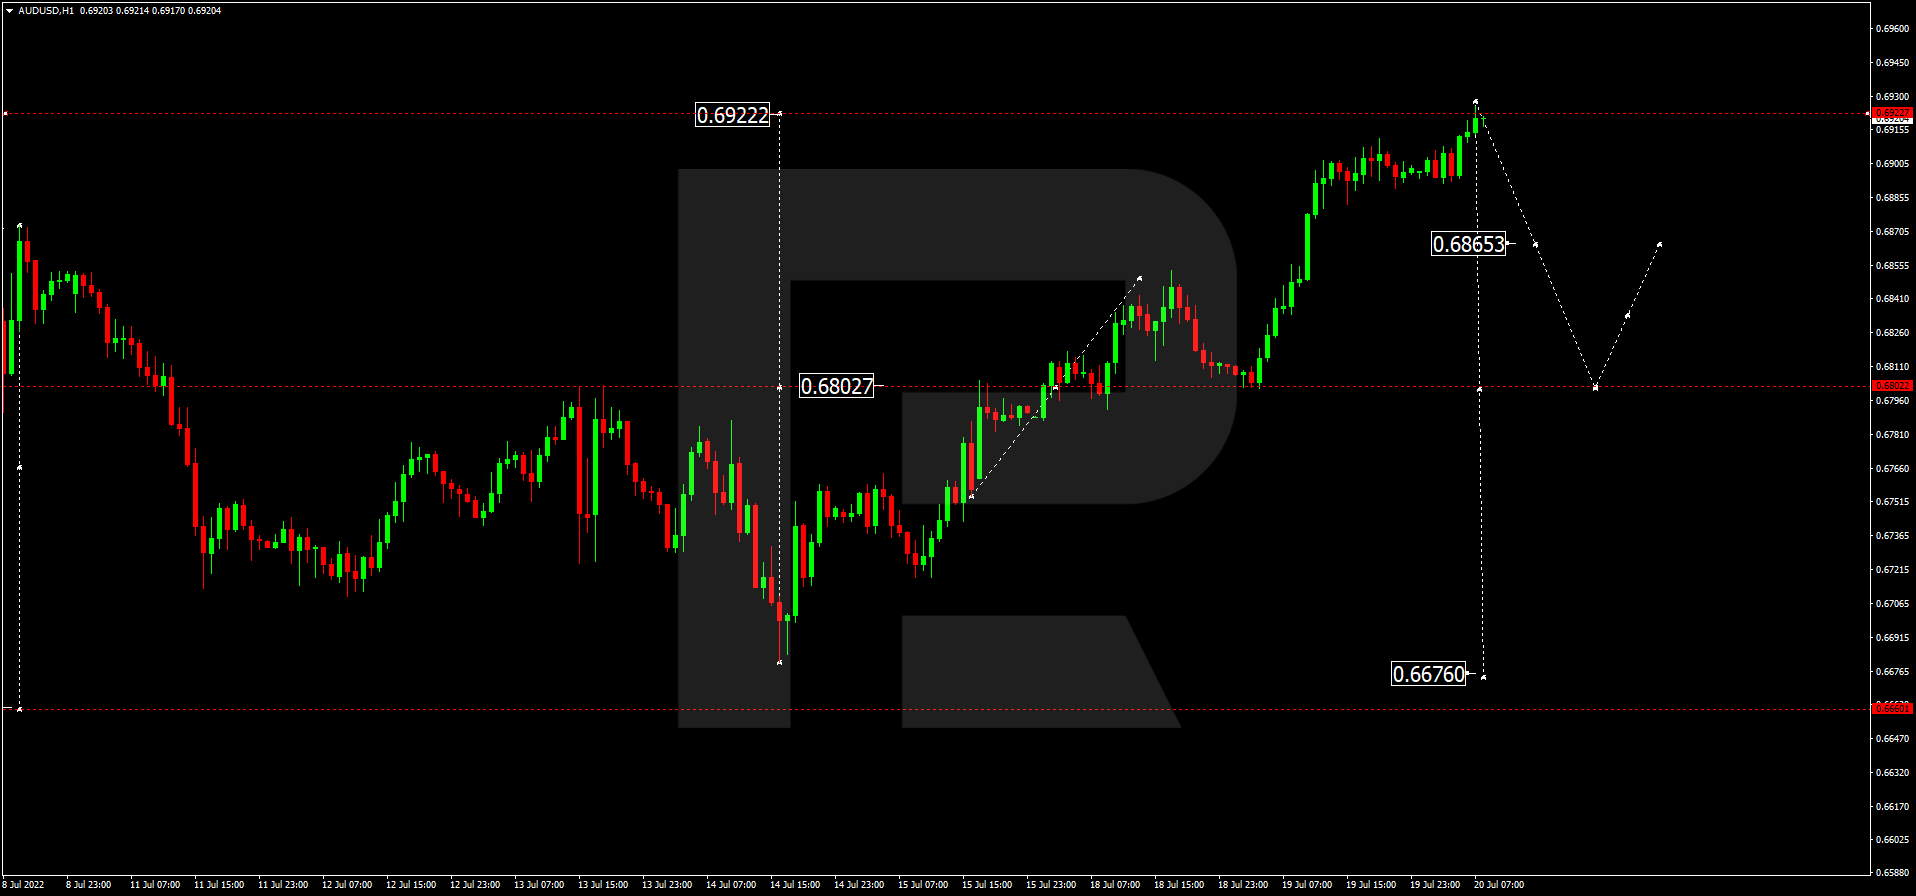
AUDUSD, “Australian Dollar vs US Dollar”
AUDUSD has finished the ascending wave at 0.6922. Today, the pair may consolidate around this level. If later the price breaks the range to the downside, the market may resume falling to reach 0.6802 or even extend this structure down to 0.6676.
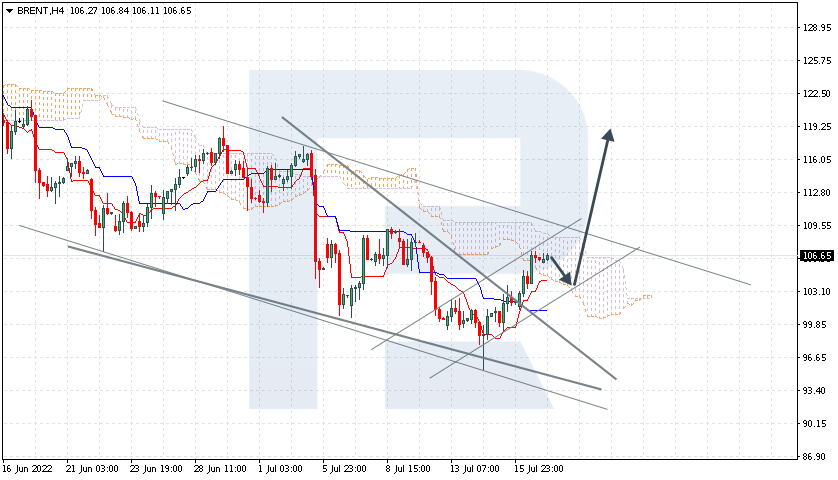
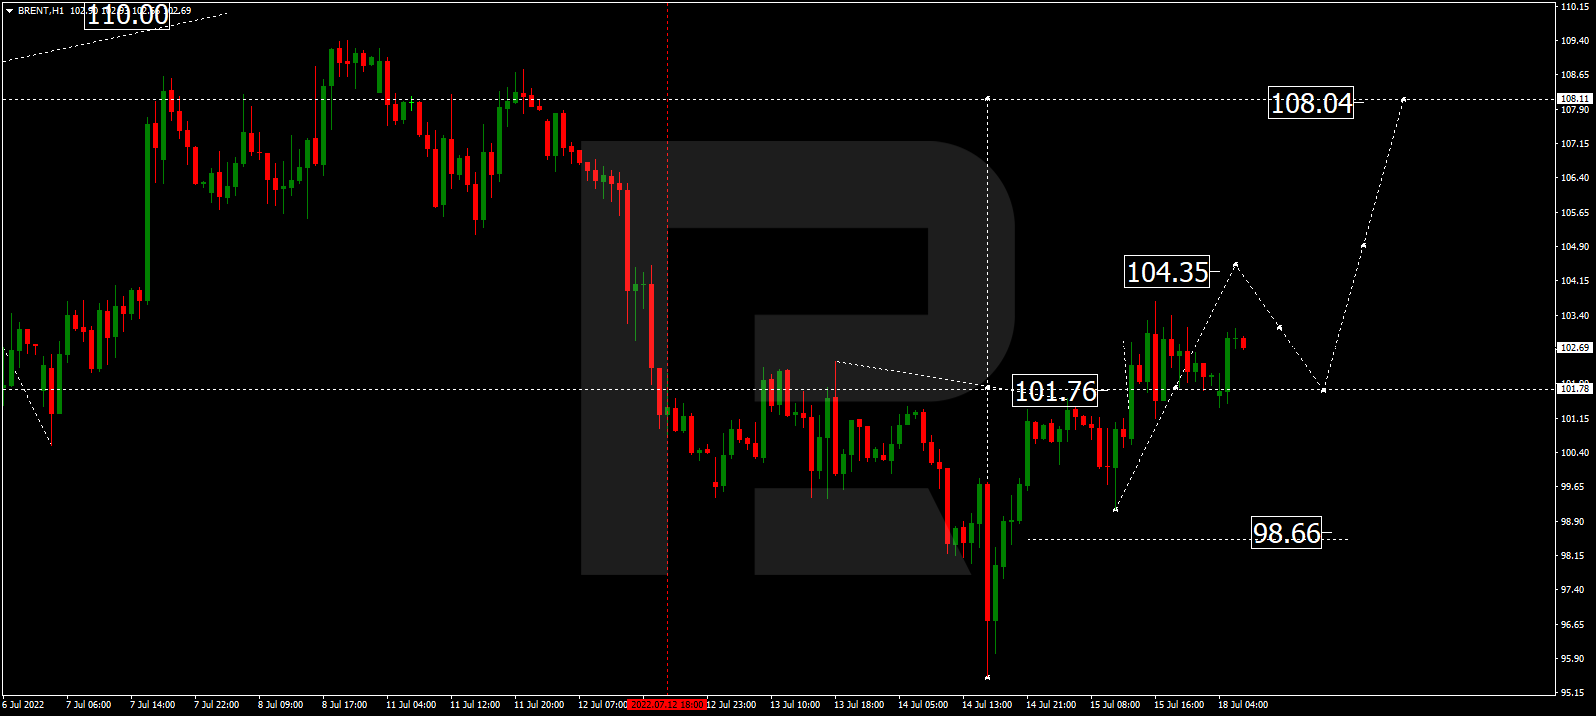
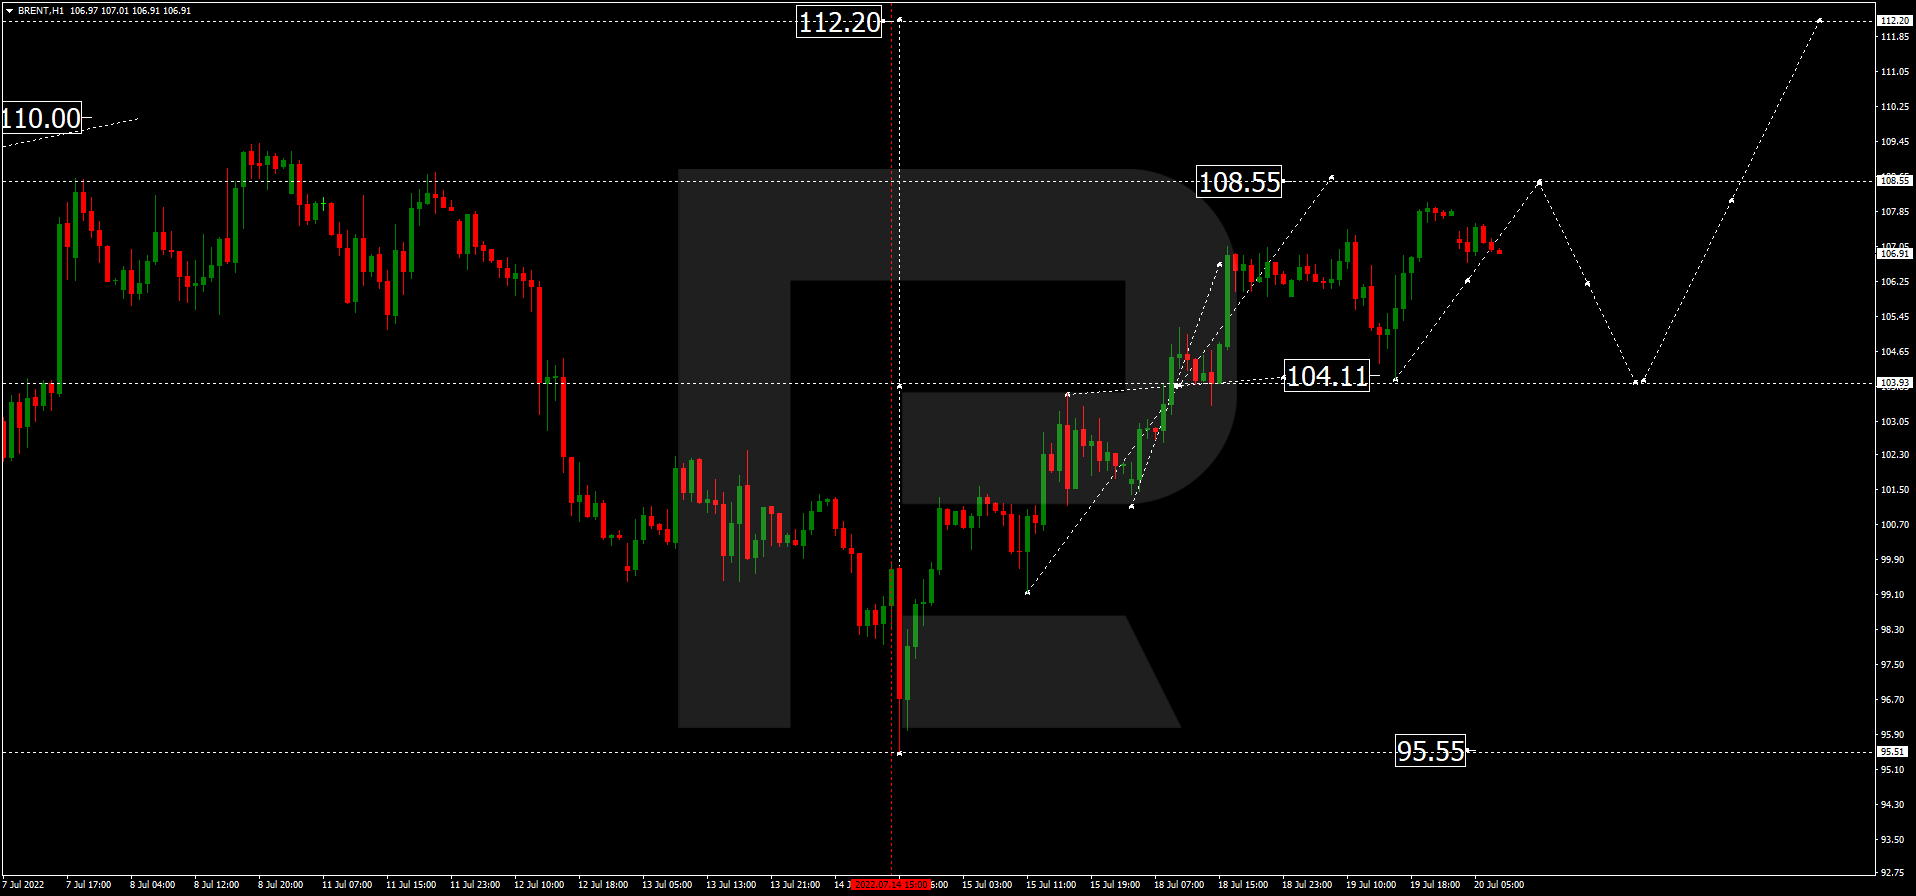
BRENT
Brent is growing towards 108.55 and may later correct down to 104.11. After that, the instrument may start another growth with the first target at 112.20.
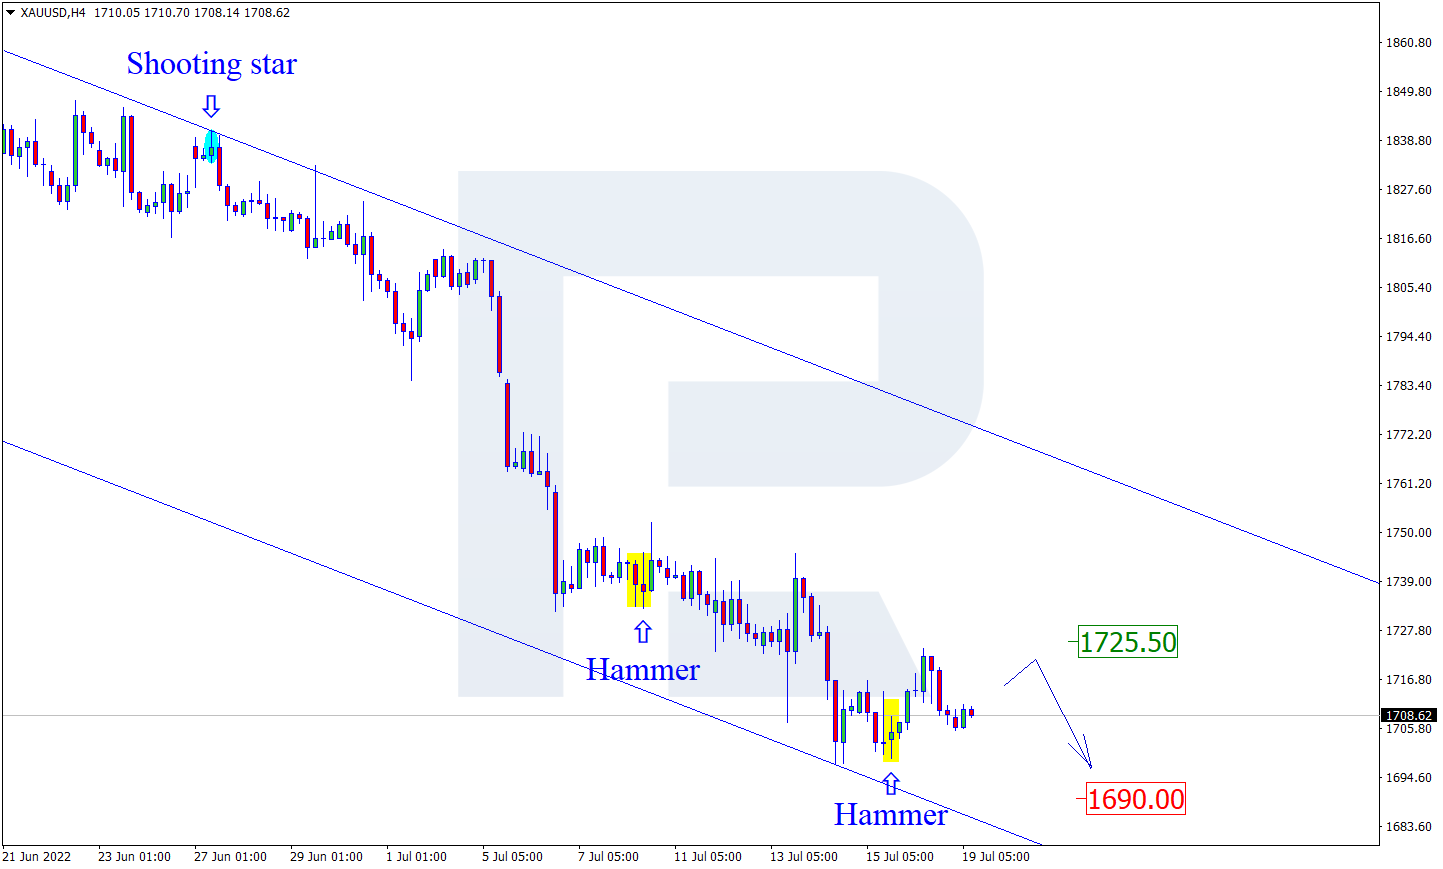
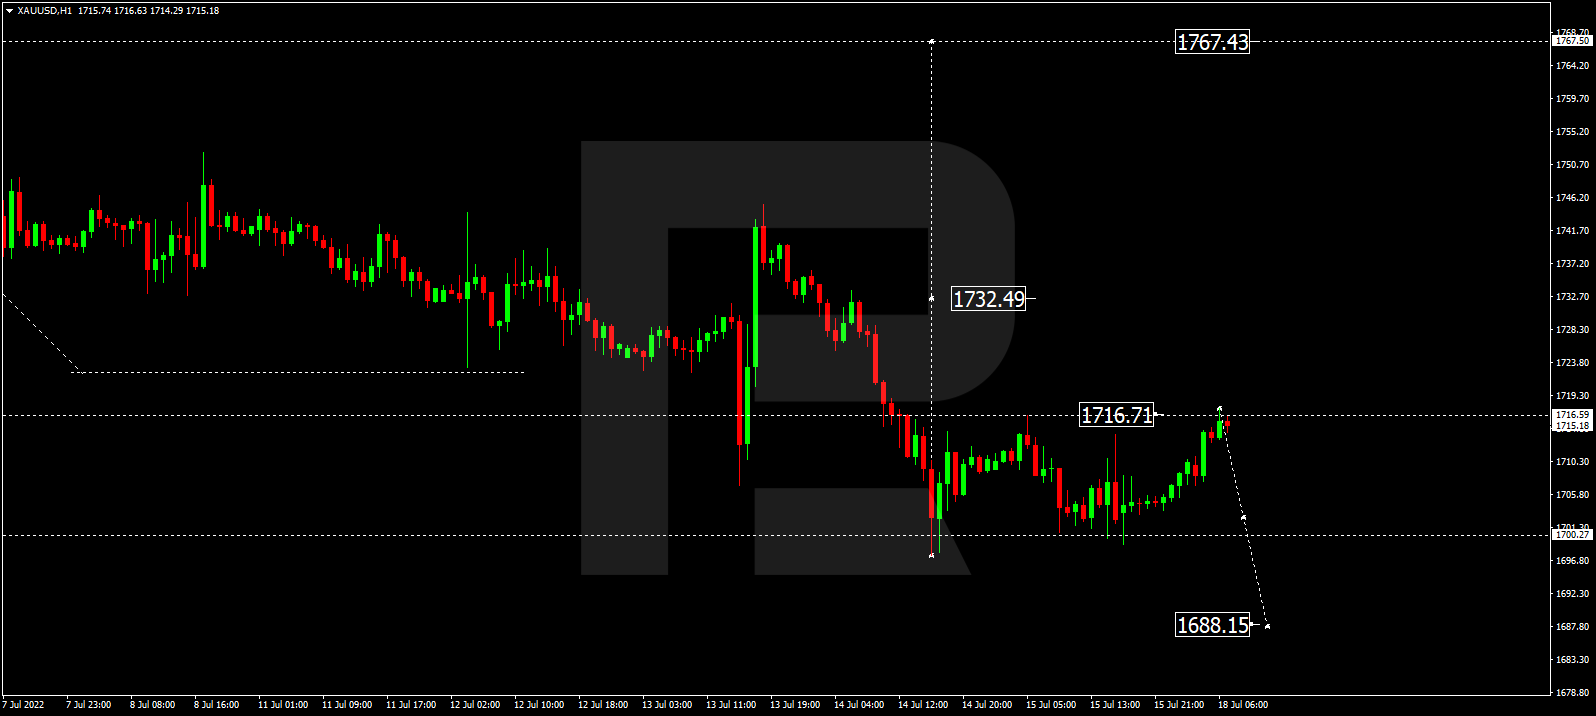
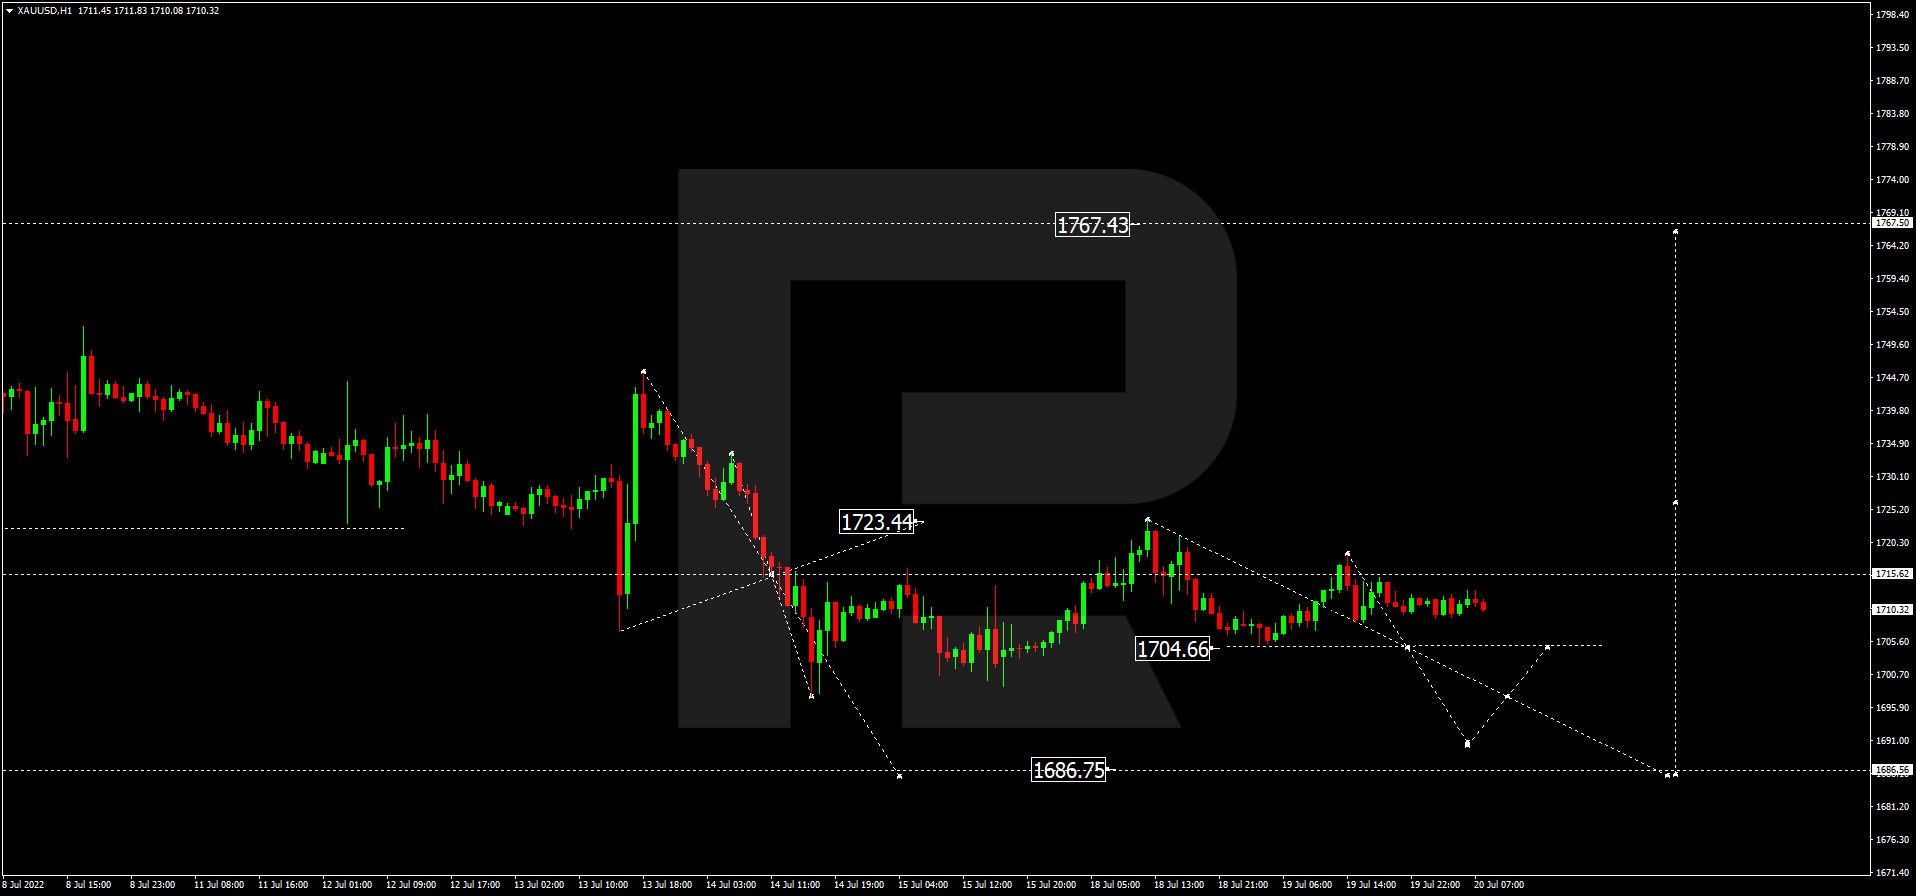
XAUUSD, “Gold vs US Dollar”
Gold continues consolidating around 1705.00. If the price breaks the range to the upside, the market may resume growing with the target at 1767.44; if to the downside – start a new decline to reach 1686.75 and then form one more ascending wave towards 1723.44 of even extend this structure to reach the above-mentioned target.
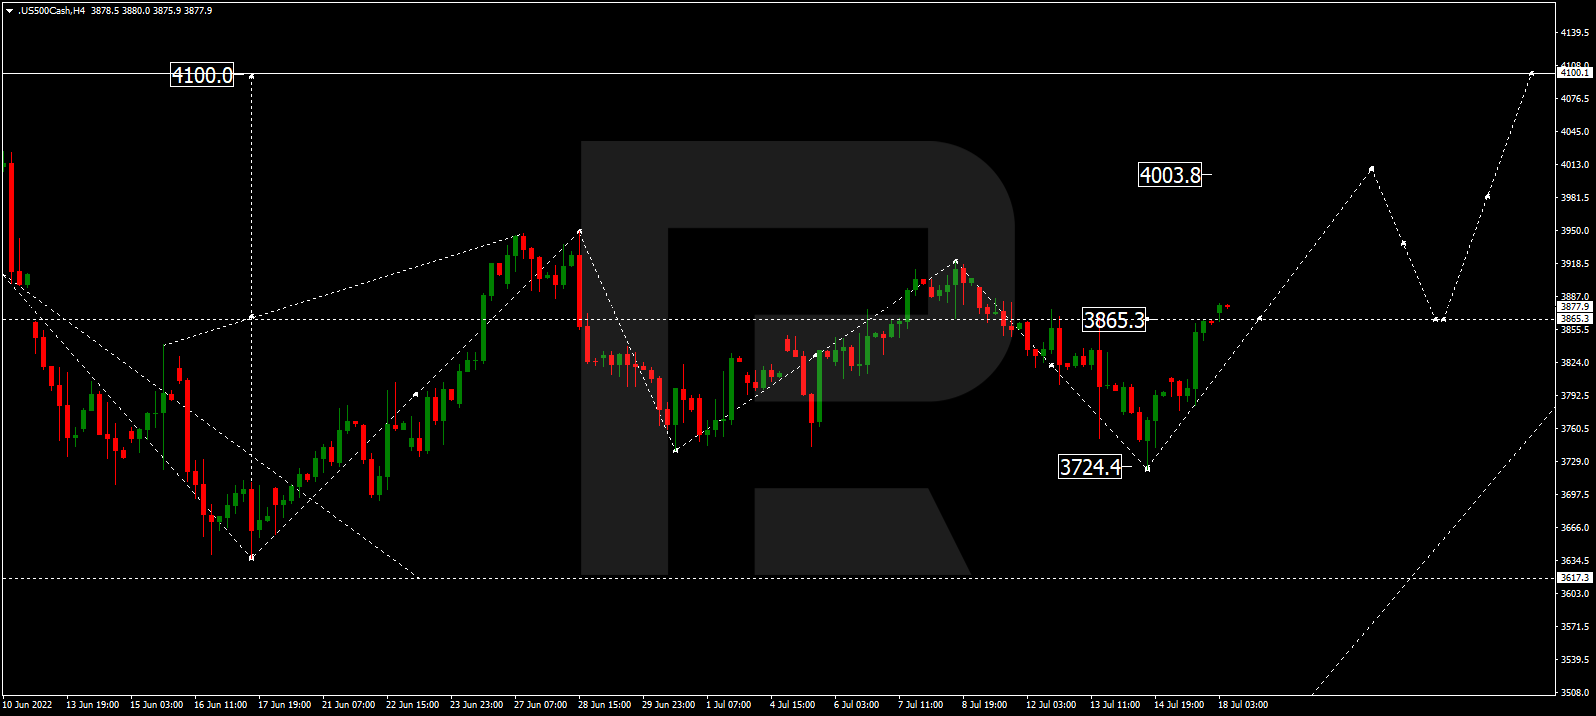
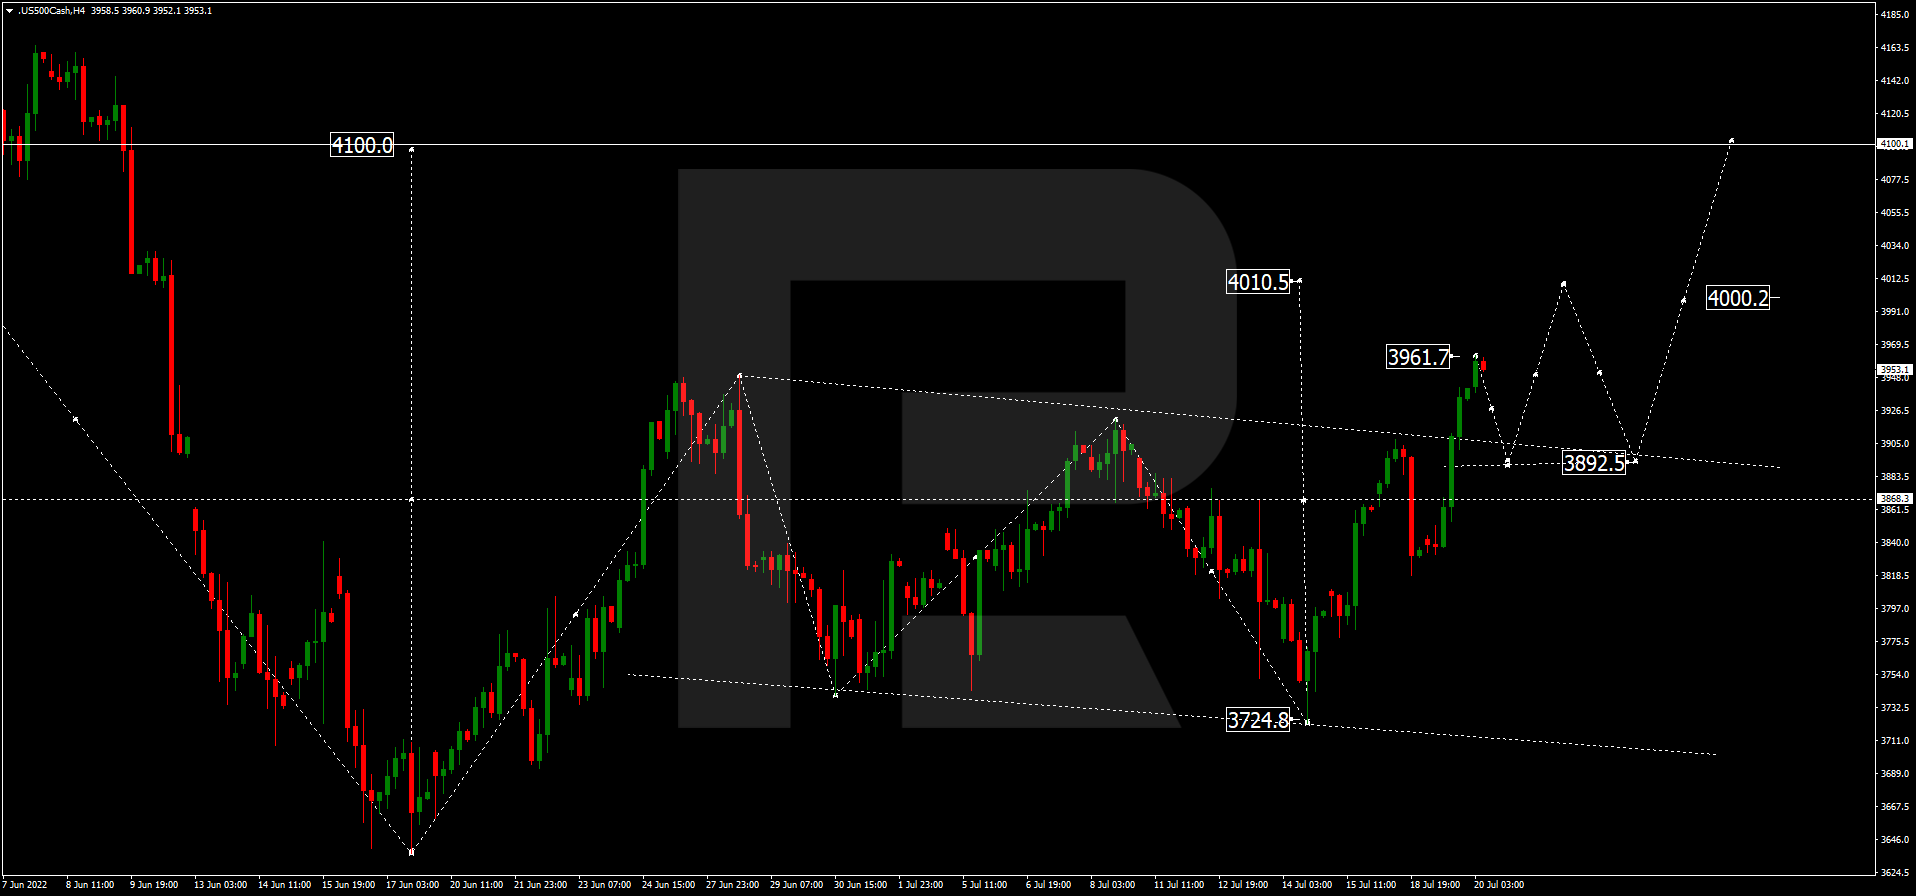
S&P 500
After breaking 3900.0, the S&P index is expected to continue growing towards 4010.5. Later, the market may resume falling to reach 3892.0 and then start another growth towards 4000.0 or even extend this structure up to 4100.0.
Article By RoboForex.com
Attention!
Forecasts presented in this section only reflect the author’s private opinion and should not be considered as guidance for trading. RoboForex LP bears no responsibility for trading results based on trading recommendations described in these analytical reviews.