By InvestMacro

Here are the latest charts and statistics for the Commitment of Traders (COT) data published by the Commodities Futures Trading Commission (CFTC).
The latest COT data is updated through Tuesday August 12th and shows a quick view of how large market participants (for-profit speculators and commercial traders) were positioned in the futures markets. All currency positions are in direct relation to the US dollar where, for example, a bet for the euro is a bet that the euro will rise versus the dollar while a bet against the euro will be a bet that the euro will decline versus the dollar.
Weekly Speculator Changes led by Brazilian Real & US Dollar Index

The COT currency market speculator bets were overall lower this week as just four out of the eleven currency markets we cover had higher positioning while the other seven markets had lower speculator contracts.
Leading the gains for the currency markets was the Brazilian Real (14,984 contracts) with the US Dollar Index (783 contracts), Bitcoin (759 contracts) and the New Zealand Dollar (146 contracts) also showing positive weeks.
The currencies seeing declines in speculator bets on the week were the Canadian Dollar (-10,657 contracts), the Japanese Yen (-7,772 contracts), the Australian Dollar (-4,345 contracts), the British Pound (-5,790 contracts), the Mexican Peso (-6,816 contracts), the Swiss Franc (-666 contracts) and with the EuroFX (-528 contracts) also registering lower bets on the week.
Brazilian Real Bets rise to 5-Week High, US Dollar Index Bets edge up
Leading the speculator changes this week for the major currency markets was the Brazilian Real, which saw a gain of almost 15,000 speculator contracts on the week. This was the second straight week of gains for the Brazilian Real and the third time out of the last four weeks that speculator bets have increased. Overall, the Real position is at +39,582 contracts, which is the best mark over the last five weeks. The Real has been at least +20,000 or above speculator contracts for the last 24 weeks in a row.
The Brazilian Real exchange rate versus the U.S. Dollar rose for a second straight week this week and continues to be in an uptrend after falling to a record low to end December. Overall, for the year of 2025, the Brazilian Real is up by over 12% while since the December bottoming, the Brazilian Real is up by over 16.65%.
Next up, the U.S. Dollar Index saw a small edge higher in their weekly speculator bets. The U.S. Dollar Index speculator positions rose by 783 contracts this week following two weeks of decreases. At the moment, the U.S. Dollar Index standing is at -6,247 contracts, and overall the USD positioning has now been in a negative or bearish level for nine consecutive weeks with a speculator strength score of just 1.8% (out of a 0 to 100 range), illustrating the current weakness of the U.S. Dollar.
In the exchange rate markets, the U.S. Dollar Index fell for a second straight week and closed the week at 97.695 exchange rate. The dollar had rebounded all the way up to the 100 level a couple of weeks ago but found resistance and got pushed back down. Overall, since the beginning of the year, the U.S. Dollar Index is down by over 12%.
British Pound Sterling led weekly market prices
The major currency market prices did not see much movement this week with no currency rising or falling by over 1%. The leader in price gains was the British Pound Sterling which was higher by 0.78% on the week. The Euro came in next with a rise of 0.50%, followed by the Brazilian Real at 0.44%. Bitcoin was higher by 0.42%, the Japanese Yen was slightly higher by 0.35%, followed by the Swiss Franc at 0.20%.
On the downside, the Australian Dollar was slightly lower at -0.23%, followed by the US Dollar Index, which saw a dip by -0.33%. The Canadian Dollar was at -0.41%, the New Zealand Dollar at -0.43%, and the biggest loser in the week was the Mexican Peso at -0.77%.
Currencies Data:

Legend: Open Interest | Speculators Current Net Position | Weekly Specs Change | Specs Strength Score compared to last 3-Years (0-100 range)
Strength Scores led by Brazilian Real & EuroFX

COT Strength Scores (a normalized measure of Speculator positions over a 3-Year range, from 0 to 100 where above 80 is Extreme-Bullish and below 20 is Extreme-Bearish) showed that the Brazilian Real (77 percent) and the EuroFX (73 percent) lead the currency markets this week. The Japanese Yen (71 percent), Mexican Peso (60 percent) and the New Zealand Dollar (59 percent) come in as the next highest in the weekly strength scores.
On the downside, the US Dollar Index (2 percent), the British Pound (14 percent) and the Australian Dollar (14 percent) come in at the lowest strength levels currently and are in Extreme-Bearish territory (below 20 percent).
3-Year Strength Statistics:
US Dollar Index (1.8 percent) vs US Dollar Index previous week (0.0 percent)
EuroFX (72.7 percent) vs EuroFX previous week (72.9 percent)
British Pound Sterling (13.8 percent) vs British Pound Sterling previous week (16.5 percent)
Japanese Yen (71.1 percent) vs Japanese Yen previous week (73.3 percent)
Swiss Franc (44.1 percent) vs Swiss Franc previous week (45.4 percent)
Canadian Dollar (48.2 percent) vs Canadian Dollar previous week (53.0 percent)
Australian Dollar (13.9 percent) vs Australian Dollar previous week (17.0 percent)
New Zealand Dollar (59.0 percent) vs New Zealand Dollar previous week (58.9 percent)
Mexican Peso (60.0 percent) vs Mexican Peso previous week (63.5 percent)
Brazilian Real (76.7 percent) vs Brazilian Real previous week (64.5 percent)
Bitcoin (37.0 percent) vs Bitcoin previous week (20.9 percent)
Bitcoin, Peso & EuroFX top the 6-Week Strength Trends

COT Strength Score Trends (or move index, calculates the 6-week changes in strength scores) showed that the Bitcoin (21 percent), the Mexican Peso (3 percent) and the EuroFX (3 percent) lead the past six weeks trends for the currencies.
The British Pound (-34 percent) leads the downside trend scores currently with the Japanese Yen (-15 percent), Australian Dollar (-13 percent) and the Canadian Dollar (-12 percent) following next with lower trend scores.
3-Year Strength Trends:
US Dollar Index (-4.6 percent) vs US Dollar Index previous week (-2.3 percent)
EuroFX (3.0 percent) vs EuroFX previous week (1.8 percent)
British Pound Sterling (-33.5 percent) vs British Pound Sterling previous week (-32.2 percent)
Japanese Yen (-14.6 percent) vs Japanese Yen previous week (-13.8 percent)
Swiss Franc (-8.5 percent) vs Swiss Franc previous week (-13.0 percent)
Canadian Dollar (-12.1 percent) vs Canadian Dollar previous week (-11.9 percent)
Australian Dollar (-12.6 percent) vs Australian Dollar previous week (-7.8 percent)
New Zealand Dollar (-10.2 percent) vs New Zealand Dollar previous week (-8.8 percent)
Mexican Peso (3.4 percent) vs Mexican Peso previous week (8.5 percent)
Brazilian Real (-10.3 percent) vs Brazilian Real previous week (-16.3 percent)
Bitcoin (21.5 percent) vs Bitcoin previous week (14.0 percent)
Individual COT Forex Markets:
US Dollar Index Futures:
 The US Dollar Index large speculator standing this week totaled a net position of -6,247 contracts in the data reported through Tuesday. This was a weekly advance of 783 contracts from the previous week which had a total of -7,030 net contracts.
This week’s current strength score (the trader positioning range over the past three years, measured from 0 to 100) shows the speculators are currently Bearish-Extreme with a score of 1.8 percent. The commercials are Bullish-Extreme with a score of 96.4 percent and the small traders (not shown in chart) are Bearish with a score of 45.7 percent.
Price Trend-Following Model: Downtrend
Our weekly trend-following model classifies the current market price position as: Downtrend.
| US DOLLAR INDEX Statistics | SPECULATORS | COMMERCIALS | SMALL TRADERS |
| – Percent of Open Interest Longs: | 41.9 | 37.4 | 13.8 |
| – Percent of Open Interest Shorts: | 62.4 | 20.5 | 10.1 |
| – Net Position: | -6,247 | 5,122 | 1,125 |
| – Gross Longs: | 12,729 | 11,370 | 4,202 |
| – Gross Shorts: | 18,976 | 6,248 | 3,077 |
| – Long to Short Ratio: | 0.7 to 1 | 1.8 to 1 | 1.4 to 1 |
| NET POSITION TREND: | | | |
| – Strength Index Score (3 Year Range Pct): | 1.8 | 96.4 | 45.7 |
| – Strength Index Reading (3 Year Range): | Bearish-Extreme | Bullish-Extreme | Bearish |
| NET POSITION MOVEMENT INDEX: | | | |
| – 6-Week Change in Strength Index: | -4.6 | 0.0 | 26.6 |
Euro Currency Futures:
 The Euro Currency large speculator standing this week totaled a net position of 115,431 contracts in the data reported through Tuesday. This was a weekly fall of -528 contracts from the previous week which had a total of 115,959 net contracts.
This week’s current strength score (the trader positioning range over the past three years, measured from 0 to 100) shows the speculators are currently Bullish with a score of 72.7 percent. The commercials are Bearish with a score of 24.3 percent and the small traders (not shown in chart) are Bullish-Extreme with a score of 83.5 percent.
Price Trend-Following Model: Uptrend
Our weekly trend-following model classifies the current market price position as: Uptrend.
| EURO Currency Statistics | SPECULATORS | COMMERCIALS | SMALL TRADERS |
| – Percent of Open Interest Longs: | 29.9 | 55.5 | 11.6 |
| – Percent of Open Interest Shorts: | 15.9 | 75.8 | 5.4 |
| – Net Position: | 115,431 | -167,063 | 51,632 |
| – Gross Longs: | 246,299 | 458,037 | 96,093 |
| – Gross Shorts: | 130,868 | 625,100 | 44,461 |
| – Long to Short Ratio: | 1.9 to 1 | 0.7 to 1 | 2.2 to 1 |
| NET POSITION TREND: | | | |
| – Strength Index Score (3 Year Range Pct): | 72.7 | 24.3 | 83.5 |
| – Strength Index Reading (3 Year Range): | Bullish | Bearish | Bullish-Extreme |
| NET POSITION MOVEMENT INDEX: | | | |
| – 6-Week Change in Strength Index: | 3.0 | -2.2 | -3.2 |
British Pound Sterling Futures:
 The British Pound Sterling large speculator standing this week totaled a net position of -39,093 contracts in the data reported through Tuesday. This was a weekly fall of -5,790 contracts from the previous week which had a total of -33,303 net contracts.
This week’s current strength score (the trader positioning range over the past three years, measured from 0 to 100) shows the speculators are currently Bearish-Extreme with a score of 13.8 percent. The commercials are Bullish with a score of 78.6 percent and the small traders (not shown in chart) are Bullish with a score of 69.7 percent.
Price Trend-Following Model: Uptrend
Our weekly trend-following model classifies the current market price position as: Uptrend.
| BRITISH POUND Statistics | SPECULATORS | COMMERCIALS | SMALL TRADERS |
| – Percent of Open Interest Longs: | 34.1 | 50.5 | 14.0 |
| – Percent of Open Interest Shorts: | 52.2 | 34.1 | 12.4 |
| – Net Position: | -39,093 | 35,517 | 3,576 |
| – Gross Longs: | 73,736 | 109,217 | 30,321 |
| – Gross Shorts: | 112,829 | 73,700 | 26,745 |
| – Long to Short Ratio: | 0.7 to 1 | 1.5 to 1 | 1.1 to 1 |
| NET POSITION TREND: | | | |
| – Strength Index Score (3 Year Range Pct): | 13.8 | 78.6 | 69.7 |
| – Strength Index Reading (3 Year Range): | Bearish-Extreme | Bullish | Bullish |
| NET POSITION MOVEMENT INDEX: | | | |
| – 6-Week Change in Strength Index: | -33.5 | 32.9 | -18.9 |
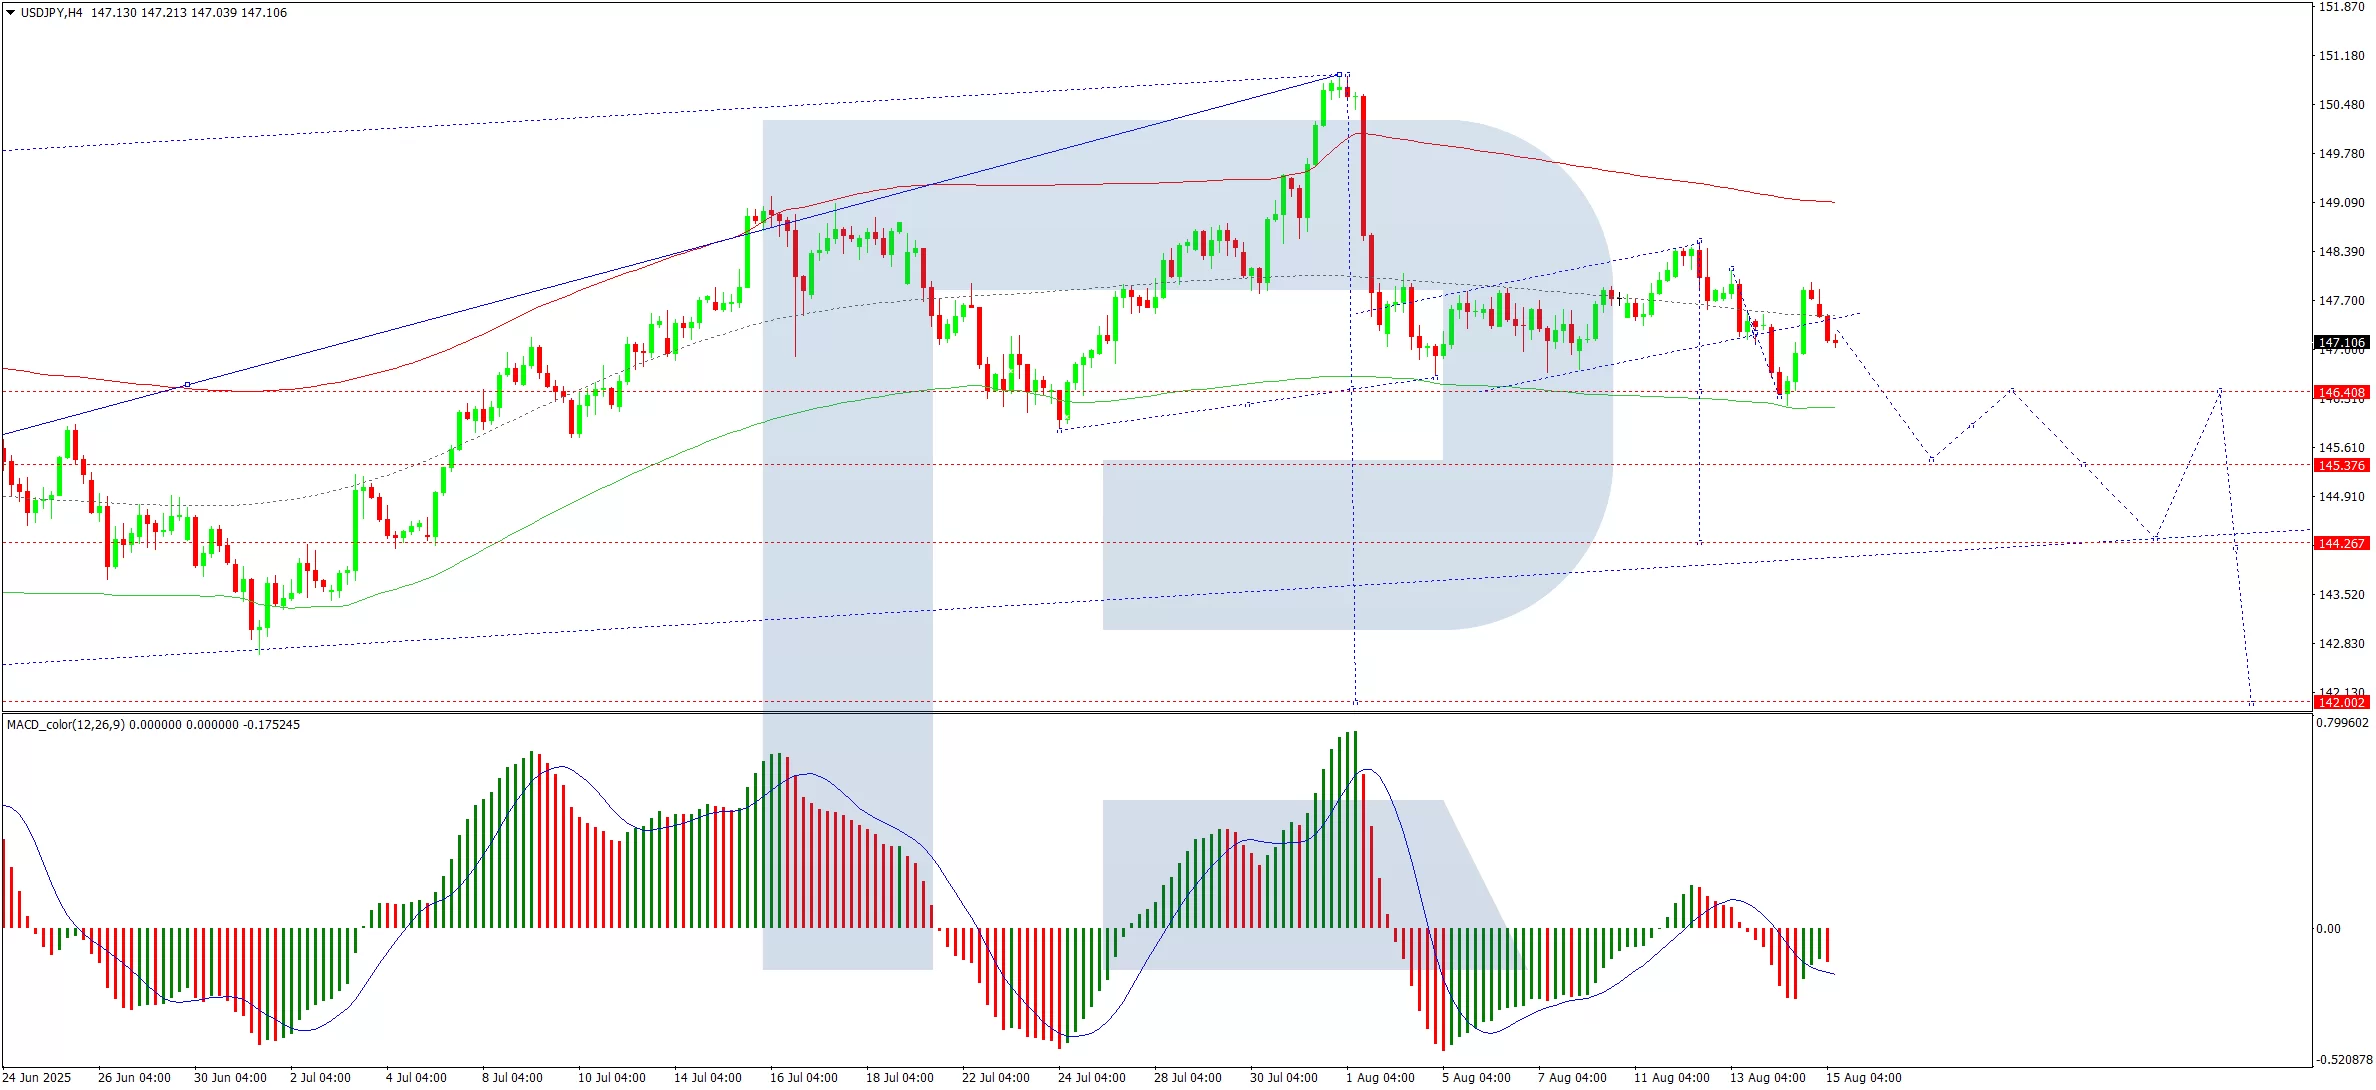
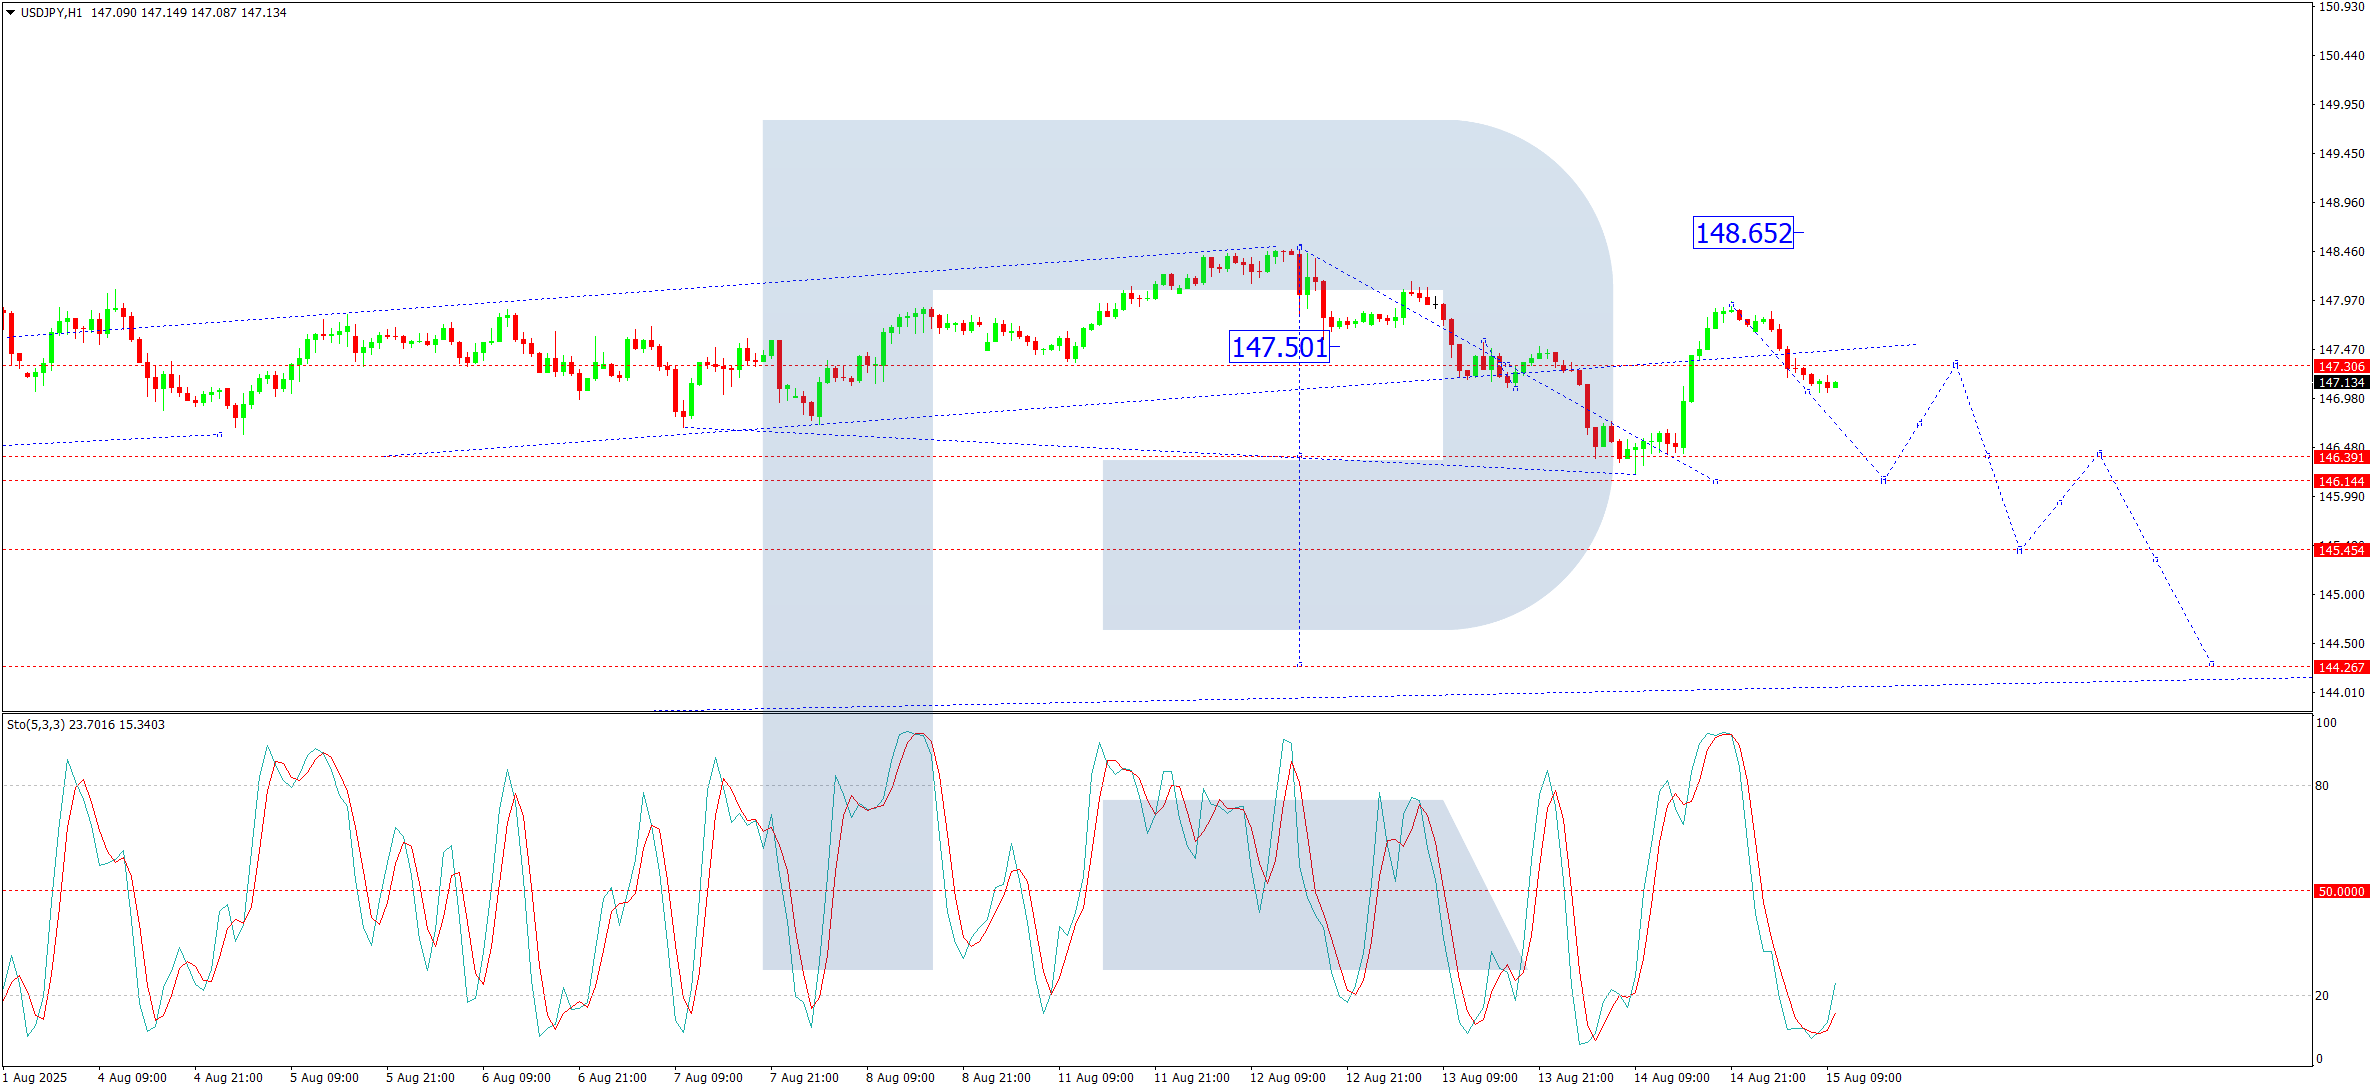
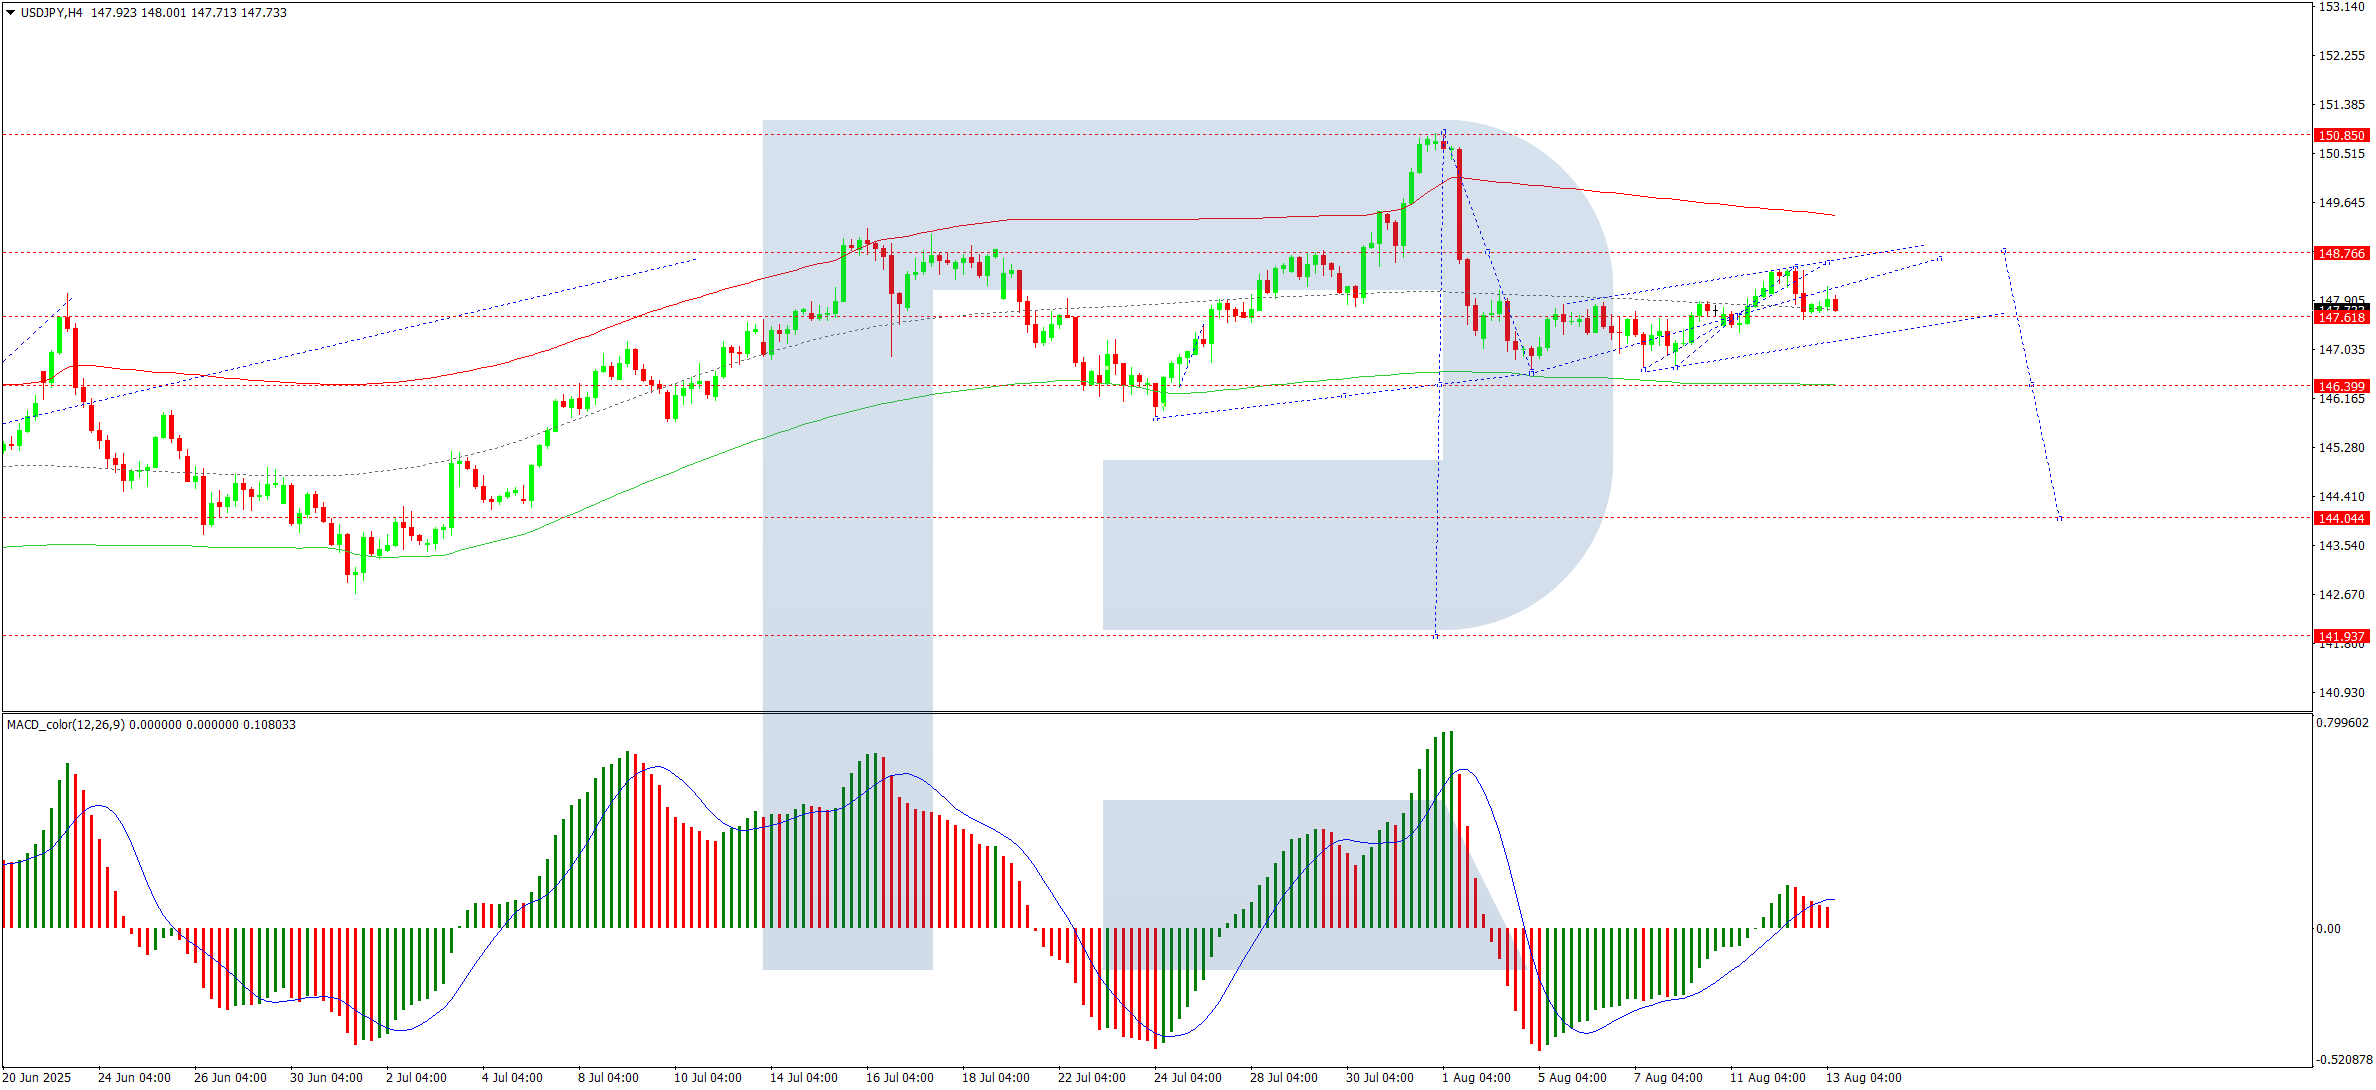
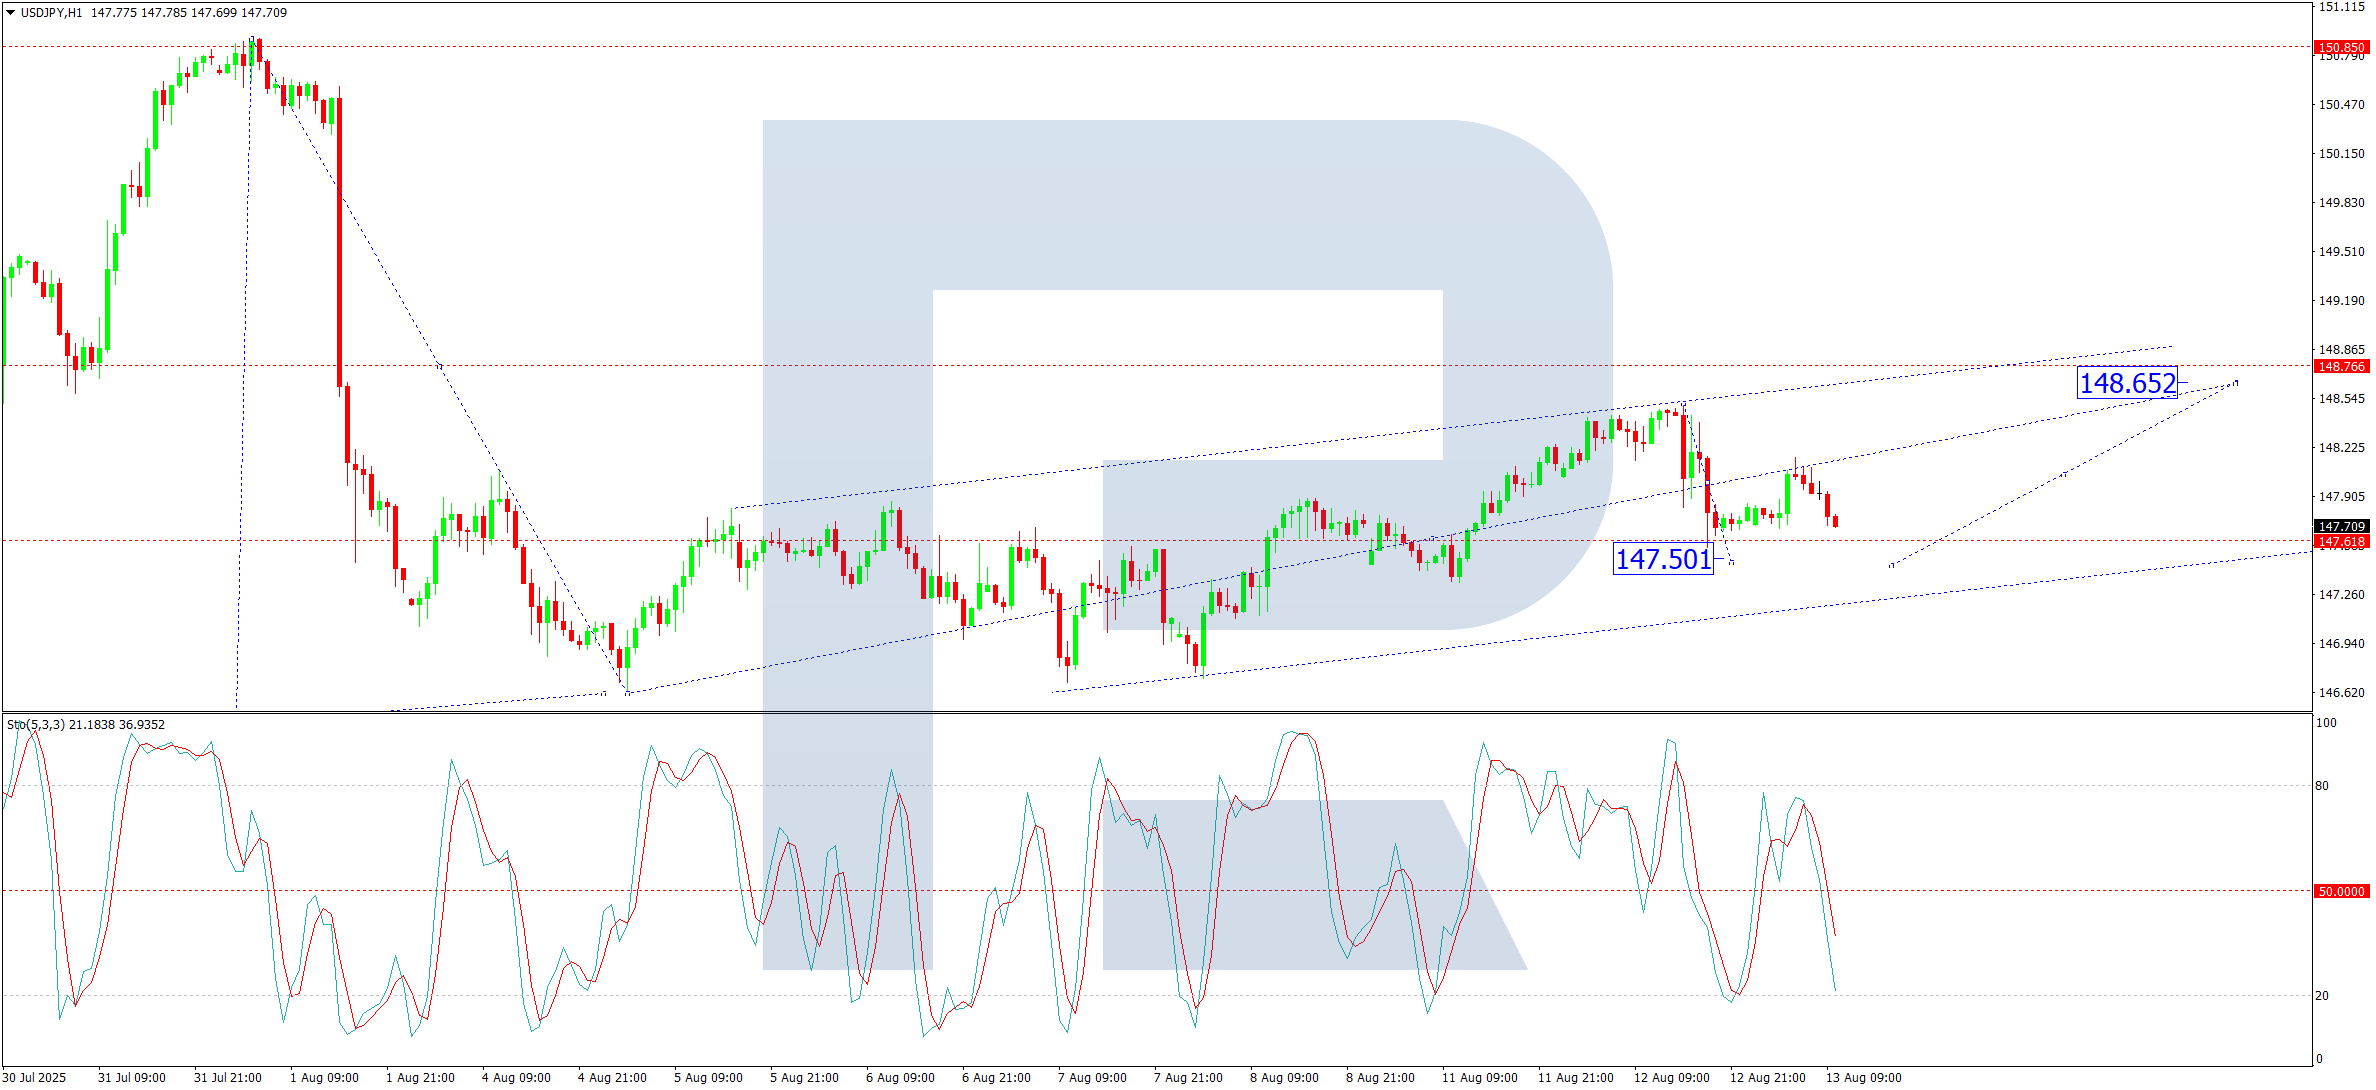
Japanese Yen Futures:
 The Japanese Yen large speculator standing this week totaled a net position of 74,234 contracts in the data reported through Tuesday. This was a weekly decrease of -7,772 contracts from the previous week which had a total of 82,006 net contracts.
This week’s current strength score (the trader positioning range over the past three years, measured from 0 to 100) shows the speculators are currently Bullish with a score of 71.1 percent. The commercials are Bearish with a score of 32.3 percent and the small traders (not shown in chart) are Bearish with a score of 43.9 percent.
Price Trend-Following Model: Strong Downtrend
Our weekly trend-following model classifies the current market price position as: Strong Downtrend.
| JAPANESE YEN Statistics | SPECULATORS | COMMERCIALS | SMALL TRADERS |
| – Percent of Open Interest Longs: | 46.9 | 41.9 | 10.0 |
| – Percent of Open Interest Shorts: | 25.8 | 63.0 | 10.1 |
| – Net Position: | 74,234 | -73,895 | -339 |
| – Gross Longs: | 164,693 | 147,170 | 35,172 |
| – Gross Shorts: | 90,459 | 221,065 | 35,511 |
| – Long to Short Ratio: | 1.8 to 1 | 0.7 to 1 | 1.0 to 1 |
| NET POSITION TREND: | | | |
| – Strength Index Score (3 Year Range Pct): | 71.1 | 32.3 | 43.9 |
| – Strength Index Reading (3 Year Range): | Bullish | Bearish | Bearish |
| NET POSITION MOVEMENT INDEX: | | | |
| – 6-Week Change in Strength Index: | -14.6 | 19.4 | -53.9 |
Swiss Franc Futures:
 The Swiss Franc large speculator standing this week totaled a net position of -28,043 contracts in the data reported through Tuesday. This was a weekly decrease of -666 contracts from the previous week which had a total of -27,377 net contracts.
This week’s current strength score (the trader positioning range over the past three years, measured from 0 to 100) shows the speculators are currently Bearish with a score of 44.1 percent. The commercials are Bullish with a score of 53.7 percent and the small traders (not shown in chart) are Bullish with a score of 56.8 percent.
Price Trend-Following Model: Uptrend
Our weekly trend-following model classifies the current market price position as: Uptrend.
| SWISS FRANC Statistics | SPECULATORS | COMMERCIALS | SMALL TRADERS |
| – Percent of Open Interest Longs: | 7.6 | 75.5 | 16.3 |
| – Percent of Open Interest Shorts: | 42.4 | 34.2 | 22.7 |
| – Net Position: | -28,043 | 33,224 | -5,181 |
| – Gross Longs: | 6,091 | 60,689 | 13,086 |
| – Gross Shorts: | 34,134 | 27,465 | 18,267 |
| – Long to Short Ratio: | 0.2 to 1 | 2.2 to 1 | 0.7 to 1 |
| NET POSITION TREND: | | | |
| – Strength Index Score (3 Year Range Pct): | 44.1 | 53.7 | 56.8 |
| – Strength Index Reading (3 Year Range): | Bearish | Bullish | Bullish |
| NET POSITION MOVEMENT INDEX: | | | |
| – 6-Week Change in Strength Index: | -8.5 | 18.7 | -31.0 |
Canadian Dollar Futures:
 The Canadian Dollar large speculator standing this week totaled a net position of -90,077 contracts in the data reported through Tuesday. This was a weekly reduction of -10,657 contracts from the previous week which had a total of -79,420 net contracts.
This week’s current strength score (the trader positioning range over the past three years, measured from 0 to 100) shows the speculators are currently Bearish with a score of 48.2 percent. The commercials are Bullish with a score of 52.8 percent and the small traders (not shown in chart) are Bearish with a score of 34.0 percent.
Price Trend-Following Model: Weak Uptrend
Our weekly trend-following model classifies the current market price position as: Weak Uptrend.
| CANADIAN DOLLAR Statistics | SPECULATORS | COMMERCIALS | SMALL TRADERS |
| – Percent of Open Interest Longs: | 9.5 | 73.6 | 10.6 |
| – Percent of Open Interest Shorts: | 50.2 | 31.3 | 12.1 |
| – Net Position: | -90,077 | 93,571 | -3,494 |
| – Gross Longs: | 20,898 | 162,833 | 23,352 |
| – Gross Shorts: | 110,975 | 69,262 | 26,846 |
| – Long to Short Ratio: | 0.2 to 1 | 2.4 to 1 | 0.9 to 1 |
| NET POSITION TREND: | | | |
| – Strength Index Score (3 Year Range Pct): | 48.2 | 52.8 | 34.0 |
| – Strength Index Reading (3 Year Range): | Bearish | Bullish | Bearish |
| NET POSITION MOVEMENT INDEX: | | | |
| – 6-Week Change in Strength Index: | -12.1 | 14.0 | -17.1 |
Australian Dollar Futures:
 The Australian Dollar large speculator standing this week totaled a net position of -87,905 contracts in the data reported through Tuesday. This was a weekly decrease of -4,345 contracts from the previous week which had a total of -83,560 net contracts.
This week’s current strength score (the trader positioning range over the past three years, measured from 0 to 100) shows the speculators are currently Bearish-Extreme with a score of 13.9 percent. The commercials are Bullish-Extreme with a score of 80.1 percent and the small traders (not shown in chart) are Bullish with a score of 58.8 percent.
Price Trend-Following Model: Uptrend
Our weekly trend-following model classifies the current market price position as: Uptrend.
| AUSTRALIAN DOLLAR Statistics | SPECULATORS | COMMERCIALS | SMALL TRADERS |
| – Percent of Open Interest Longs: | 15.0 | 66.8 | 14.1 |
| – Percent of Open Interest Shorts: | 66.3 | 17.6 | 11.9 |
| – Net Position: | -87,905 | 84,233 | 3,672 |
| – Gross Longs: | 25,631 | 114,396 | 24,097 |
| – Gross Shorts: | 113,536 | 30,163 | 20,425 |
| – Long to Short Ratio: | 0.2 to 1 | 3.8 to 1 | 1.2 to 1 |
| NET POSITION TREND: | | | |
| – Strength Index Score (3 Year Range Pct): | 13.9 | 80.1 | 58.8 |
| – Strength Index Reading (3 Year Range): | Bearish-Extreme | Bullish-Extreme | Bullish |
| NET POSITION MOVEMENT INDEX: | | | |
| – 6-Week Change in Strength Index: | -12.6 | 10.9 | -1.1 |
New Zealand Dollar Futures:
 The New Zealand Dollar large speculator standing this week totaled a net position of -4,687 contracts in the data reported through Tuesday. This was a weekly gain of 146 contracts from the previous week which had a total of -4,833 net contracts.
This week’s current strength score (the trader positioning range over the past three years, measured from 0 to 100) shows the speculators are currently Bullish with a score of 59.0 percent. The commercials are Bearish with a score of 40.7 percent and the small traders (not shown in chart) are Bearish with a score of 39.3 percent.
Price Trend-Following Model: Weak Uptrend
Our weekly trend-following model classifies the current market price position as: Weak Uptrend.
| NEW ZEALAND DOLLAR Statistics | SPECULATORS | COMMERCIALS | SMALL TRADERS |
| – Percent of Open Interest Longs: | 23.1 | 57.9 | 7.9 |
| – Percent of Open Interest Shorts: | 32.9 | 45.9 | 10.2 |
| – Net Position: | -4,687 | 5,799 | -1,112 |
| – Gross Longs: | 11,160 | 27,937 | 3,806 |
| – Gross Shorts: | 15,847 | 22,138 | 4,918 |
| – Long to Short Ratio: | 0.7 to 1 | 1.3 to 1 | 0.8 to 1 |
| NET POSITION TREND: | | | |
| – Strength Index Score (3 Year Range Pct): | 59.0 | 40.7 | 39.3 |
| – Strength Index Reading (3 Year Range): | Bullish | Bearish | Bearish |
| NET POSITION MOVEMENT INDEX: | | | |
| – 6-Week Change in Strength Index: | -10.2 | 13.0 | -34.7 |
Mexican Peso Futures:
 The Mexican Peso large speculator standing this week totaled a net position of 61,239 contracts in the data reported through Tuesday. This was a weekly lowering of -6,816 contracts from the previous week which had a total of 68,055 net contracts.
This week’s current strength score (the trader positioning range over the past three years, measured from 0 to 100) shows the speculators are currently Bullish with a score of 60.0 percent. The commercials are Bearish with a score of 40.9 percent and the small traders (not shown in chart) are Bearish with a score of 42.8 percent.
Price Trend-Following Model: Uptrend
Our weekly trend-following model classifies the current market price position as: Uptrend.
| MEXICAN PESO Statistics | SPECULATORS | COMMERCIALS | SMALL TRADERS |
| – Percent of Open Interest Longs: | 58.4 | 37.2 | 3.6 |
| – Percent of Open Interest Shorts: | 24.8 | 72.8 | 1.6 |
| – Net Position: | 61,239 | -64,848 | 3,609 |
| – Gross Longs: | 106,539 | 67,876 | 6,499 |
| – Gross Shorts: | 45,300 | 132,724 | 2,890 |
| – Long to Short Ratio: | 2.4 to 1 | 0.5 to 1 | 2.2 to 1 |
| NET POSITION TREND: | | | |
| – Strength Index Score (3 Year Range Pct): | 60.0 | 40.9 | 42.8 |
| – Strength Index Reading (3 Year Range): | Bullish | Bearish | Bearish |
| NET POSITION MOVEMENT INDEX: | | | |
| – 6-Week Change in Strength Index: | 3.4 | -2.6 | -9.0 |
Brazilian Real Futures:
 The Brazilian Real large speculator standing this week totaled a net position of 39,582 contracts in the data reported through Tuesday. This was a weekly boost of 14,984 contracts from the previous week which had a total of 24,598 net contracts.
This week’s current strength score (the trader positioning range over the past three years, measured from 0 to 100) shows the speculators are currently Bullish with a score of 76.7 percent. The commercials are Bearish with a score of 22.0 percent and the small traders (not shown in chart) are Bearish with a score of 40.5 percent.
Price Trend-Following Model: Strong Uptrend
Our weekly trend-following model classifies the current market price position as: Strong Uptrend.
| BRAZIL REAL Statistics | SPECULATORS | COMMERCIALS | SMALL TRADERS |
| – Percent of Open Interest Longs: | 57.5 | 34.7 | 4.2 |
| – Percent of Open Interest Shorts: | 19.2 | 76.4 | 0.8 |
| – Net Position: | 39,582 | -43,069 | 3,487 |
| – Gross Longs: | 59,388 | 35,788 | 4,287 |
| – Gross Shorts: | 19,806 | 78,857 | 800 |
| – Long to Short Ratio: | 3.0 to 1 | 0.5 to 1 | 5.4 to 1 |
| NET POSITION TREND: | | | |
| – Strength Index Score (3 Year Range Pct): | 76.7 | 22.0 | 40.5 |
| – Strength Index Reading (3 Year Range): | Bullish | Bearish | Bearish |
| NET POSITION MOVEMENT INDEX: | | | |
| – 6-Week Change in Strength Index: | -10.3 | 8.1 | 14.1 |
Bitcoin Futures:
 The Bitcoin large speculator standing this week totaled a net position of -742 contracts in the data reported through Tuesday. This was a weekly increase of 759 contracts from the previous week which had a total of -1,501 net contracts.
This week’s current strength score (the trader positioning range over the past three years, measured from 0 to 100) shows the speculators are currently Bearish with a score of 37.0 percent. The commercials are Bullish with a score of 59.2 percent and the small traders (not shown in chart) are Bullish with a score of 69.7 percent.
Price Trend-Following Model: Uptrend
Our weekly trend-following model classifies the current market price position as: Uptrend.
| BITCOIN Statistics | SPECULATORS | COMMERCIALS | SMALL TRADERS |
| – Percent of Open Interest Longs: | 84.2 | 4.9 | 5.8 |
| – Percent of Open Interest Shorts: | 86.8 | 4.5 | 3.6 |
| – Net Position: | -742 | 118 | 624 |
| – Gross Longs: | 23,438 | 1,371 | 1,624 |
| – Gross Shorts: | 24,180 | 1,253 | 1,000 |
| – Long to Short Ratio: | 1.0 to 1 | 1.1 to 1 | 1.6 to 1 |
| NET POSITION TREND: | | | |
| – Strength Index Score (3 Year Range Pct): | 37.0 | 59.2 | 69.7 |
| – Strength Index Reading (3 Year Range): | Bearish | Bullish | Bullish |
| NET POSITION MOVEMENT INDEX: | | | |
| – 6-Week Change in Strength Index: | 21.5 | -26.4 | 8.8 |
Article By InvestMacro – Receive our weekly COT Newsletter
*COT Report: The COT data, released weekly to the public each Friday, is updated through the most recent Tuesday (data is 3 days old) and shows a quick view of how large speculators or non-commercials (for-profit traders) were positioned in the futures markets.
The CFTC categorizes trader positions according to commercial hedgers (traders who use futures contracts for hedging as part of the business), non-commercials (large traders who speculate to realize trading profits) and nonreportable traders (usually small traders/speculators) as well as their open interest (contracts open in the market at time of reporting). See CFTC criteria here.