Archive for Forex and Currency News – Page 11

EUR/USD Set for Growth: Dollar Fears Demand Slump

By RoboForex Analytical Department

EUR/USD rose to 1.1911 on Tuesday. Pressure on the USD increased amid concerns that external demand for dollar-denominated assets could decline significantly.

The reason behind this shift was reports suggesting that Chinese regulators have advised financial institutions to reduce their holdings of US government bonds. This move could help diversify risks and mitigate the impact of uncertain US economic policies.

Investors are awaiting delayed reports on the US labour market and inflation this week. These figures could adjust expectations regarding the Federal Reserve’s future policy direction.

White House economic adviser Kevin Hassett noted that the pace of US employment growth may slow in the coming months due to weaker labour and productivity growth.

The Fed is expected to leave interest rates unchanged in March, with markets still pricing in two rate cuts for the remainder of the year.

Technical Analysis

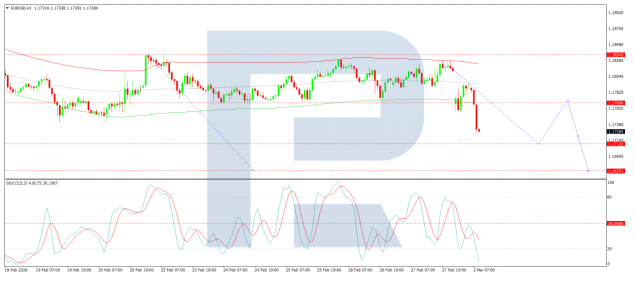
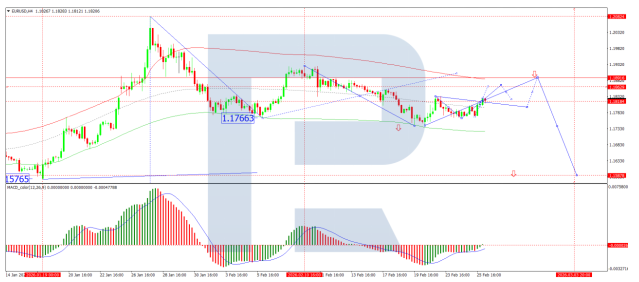
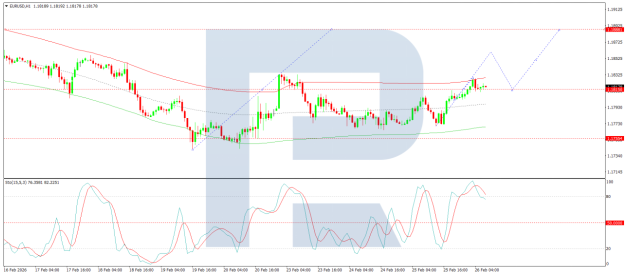
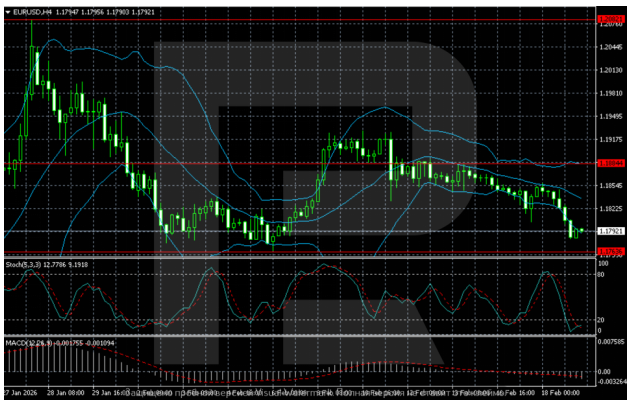
On the H4 chart for EUR/USD, after a momentum rally in late January, the pair entered a phase of correction and consolidation. The price has recovered above the 1.1760 support level and is now testing the 1.1920-1.1950 area. The Bollinger Bands are narrowing, indicating stabilisation and preparation for the next move. The medium-term structure remains moderately bullish as long as prices stay above 1.1760.

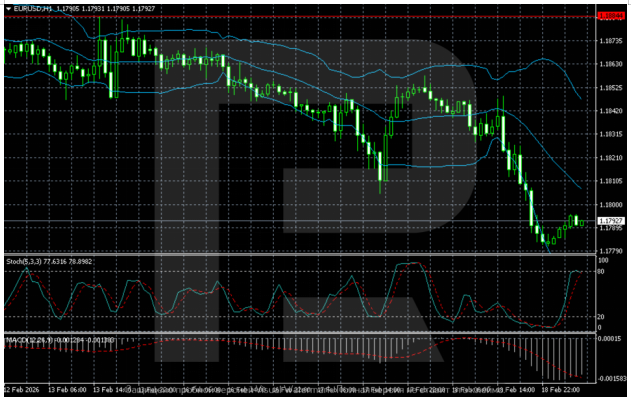
On the shorter-term H1 time frame, upward momentum remains confined to the short term. The price is moving along the upper Bollinger band after a sharp upward acceleration. It is now consolidating just below resistance at 1.1920-1.1950. Oscillators are in the overbought zone, raising the risk of a pause or shallow pullback, although the overall structure remains intact.

Conclusion

EUR/USD is poised for gains, driven by concerns about USD demand and a cautious outlook for US economic growth. While short-term fluctuations are expected, the medium-term trend remains bullish as long as key support levels hold. Investors will be closely watching upcoming data on inflation and employment, which could influence future Federal Reserve policy decisions.


Disclaimer

Any forecasts contained herein are based on the author’s particular opinion. This analysis may not be treated as trading advice. RoboForex bears no responsibility for trading results based on trading recommendations and reviews contained herein.

USD/JPY Reacts to Political News: Budget Line Will Be Soft

By RoboForex Analytical Department

USD/JPY is down to 156.73 on Monday. The Japanese yen had earlier dropped to its lowest levels in almost two weeks after a landslide victory for Japan’s ruling Liberal Democratic Party in early elections to the lower house of parliament. The coalition is led by Prime Minister Sanae Takaichi. However, demand for the yen returned shortly after.

Takaichi’s coalition won 352 of 465 seats in the House of Representatives, according to NHK. At the same time, the Liberal Democratic Party of Japan itself secured a majority of 316 seats. The vote’s outcome provided the prime minister with a clear mandate to implement an expansive fiscal policy.

Markets regarded the result as a signal in favour of a softer budget line and possible tax breaks. This increased pressure on the yen and Japanese government bonds amid fears of a rise in the debt burden. At the same time, the results supported expectations of more favourable dynamics for the stock market.

A more conservative domestic agenda is now expected to advance, including stricter immigration policies and land ownership rules. All this adds uncertainty to the assessment of medium-term consequences for the economy and financial markets.

Technical Analysis

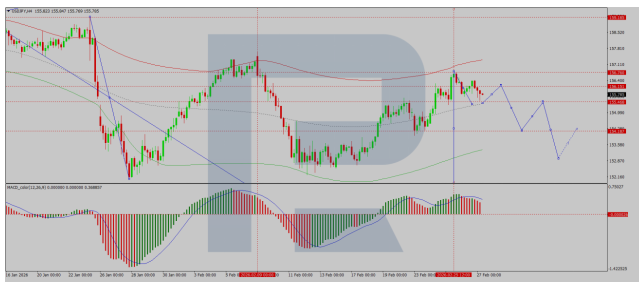
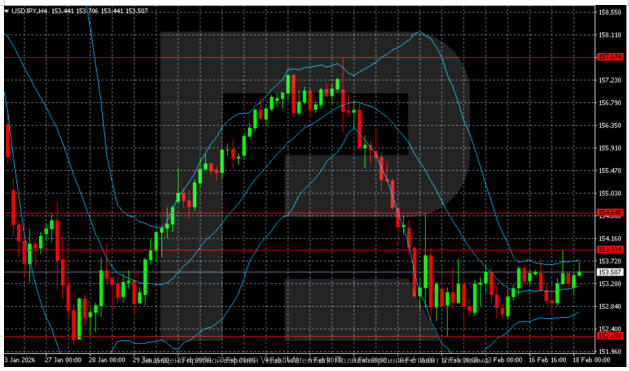
On the H4 chart for USD/JPY, following a sharp decline at the end of January, a local bottom formed in the 152.00-152.20 zone, from which the pair began to recover. This impulsive growth was accompanied by movement along the upper border of the Bollinger Bands. The price is now trading below recent highs and consolidating in the 155.80-157.70 range. Volatility has decreased, and the structure remains corrective. However, momentum weakened, and the market has entered a pause phase under resistance.

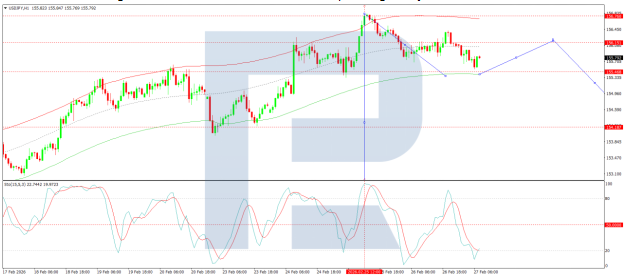
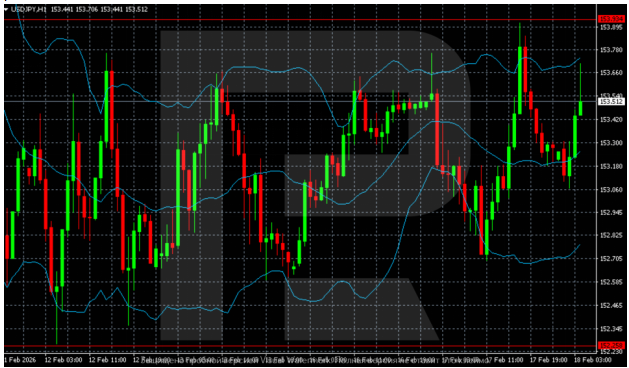
The H1 chart shows the development of lateral dynamics after growth, with the price hovering around the Bollinger Bands’ midline, and no new momentum forming. Selling pressure quickly cancelled attempts to move higher to 157.40-157.70, while support holds in the 155.50-155.80 region. The near-term trajectory appears neutral, with a balance between correction and attempts to continue the recovery.

Conclusion

In summary, USD/JPY is undergoing a corrective pullback as the market digests the political implications of Japan’s election outcome. While the landslide victory initially weakened the yen on expectations of expansive fiscal policy, a technical pause has followed. The pair is now consolidating, caught between the fundamental pressure from anticipated higher Japanese debt (bearish for JPY) and technical resistance. The near-term trajectory will depend on whether this consolidation leads to a continuation of the recovery or a deeper correction, with clarity on the new government’s fiscal measures serving as the next major catalyst.


Disclaimer

Any forecasts contained herein are based on the author’s particular opinion. This analysis may not be treated as trading advice. RoboForex bears no responsibility for trading results based on trading recommendations and reviews contained herein.

Currency Speculators boost Euro bets to highest since 2023, CAD bets go Bullish

By InvestMacro

Speculators OI FX Futures COT Chart

Here are the latest charts and statistics for the Commitment of Traders (COT) data published by the Commodities Futures Trading Commission (CFTC).

The latest COT data is updated through Tuesday February 3rd and shows a quick view of how large market participants (for-profit speculators and commercial traders) were positioned in the futures markets. All currency positions are in direct relation to the US dollar where, for example, a bet for the euro is a bet that the euro will rise versus the dollar while a bet against the euro will be a bet that the euro will decline versus the dollar.

Weekly Speculator Changes led by Euro, Australian Dollar and Canadian Dollar

Speculators Nets FX Futures COT Chart
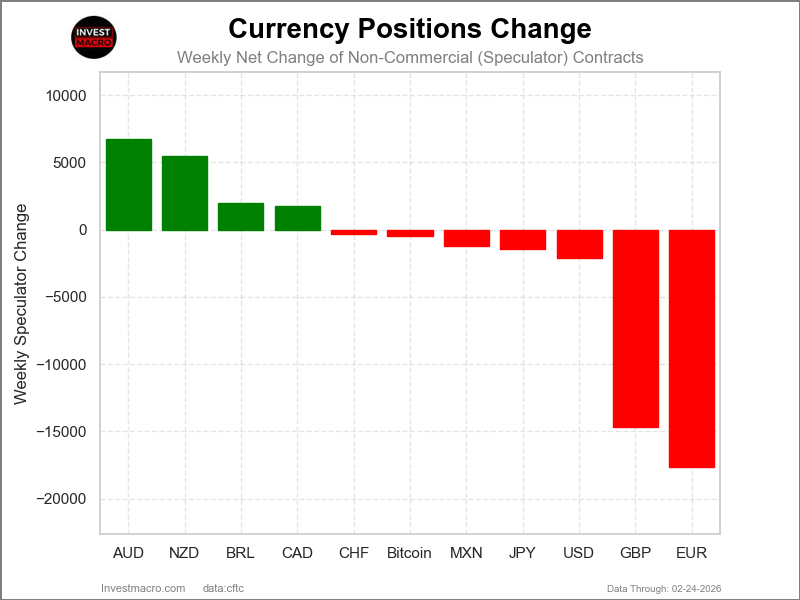
The COT currency market speculator bets were higher this week as ten out of the eleven currency markets we cover had higher positioning while the other one markets had lower speculator contracts.

Leading the gains for the currency markets was the EuroFX (31,227 contracts) with the Australian Dollar (18,972 contracts), the Canadian Dollar (18,176 contracts), the Japanese Yen (14,711 contracts), the New Zealand Dollar (13,451 contracts), the Brazilian Real (12,117 contracts), the US Dollar Index (3,553 contracts), the British Pound (2,251 contracts), the Swiss Franc (2,176 contracts) and Bitcoin (318 contracts) with also showing positive weeks.

The currency seeing declines in speculator bets on the week was the Mexican Peso with a drop by -12,522 contracts on the week.

Currency Speculators sharply boost Euro bets to highest since 2023, CAD bets go Bullish

Highlighting this week’s currency speculator changes were the strong gains in the Euro, the Australian Dollar, and the Canadian Dollar.

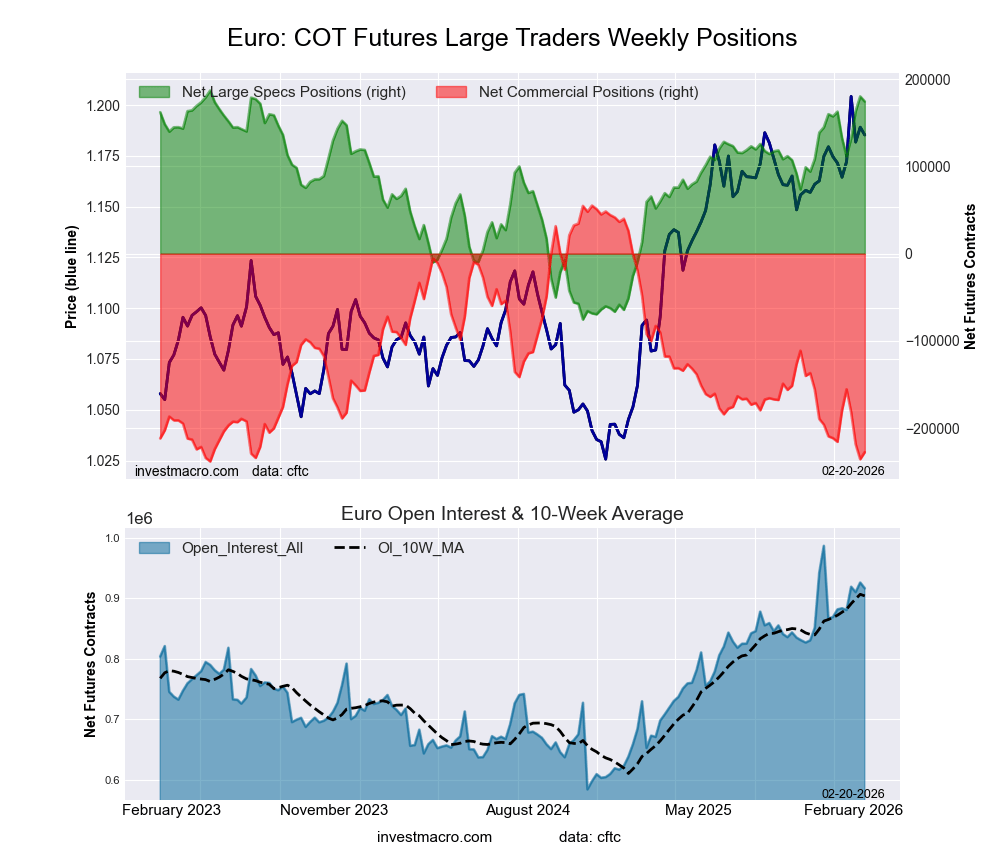
First off, the Euro jumped by over 30,000 contracts this week and this week’s gain marked the largest one-week gain since March of 2025, when speculative bets surged by over +46,000 contracts. This week’s surge follows last week’s rise by over 20,000 contracts and has now pushed the overall speculative level to a total of 163,361 net contracts, which marks the highest level for the Euro bets dating back to August 1st of 2023. The European currency’s speculative standing has now been above +100,000 net contracts for 10 consecutive weeks, and for 30 out of the last 34 weeks as well. The Euro exchange rate this week dipped slightly for a second consecutive week and closed out the week around the 1.1840 exchange level. Last week, however, the Euro hit its highest level since 2021 with a high around 1.2110 before retreating. We’ll see in the weeks to come if the Euro will threaten the 1.20 psychological threshold once again.

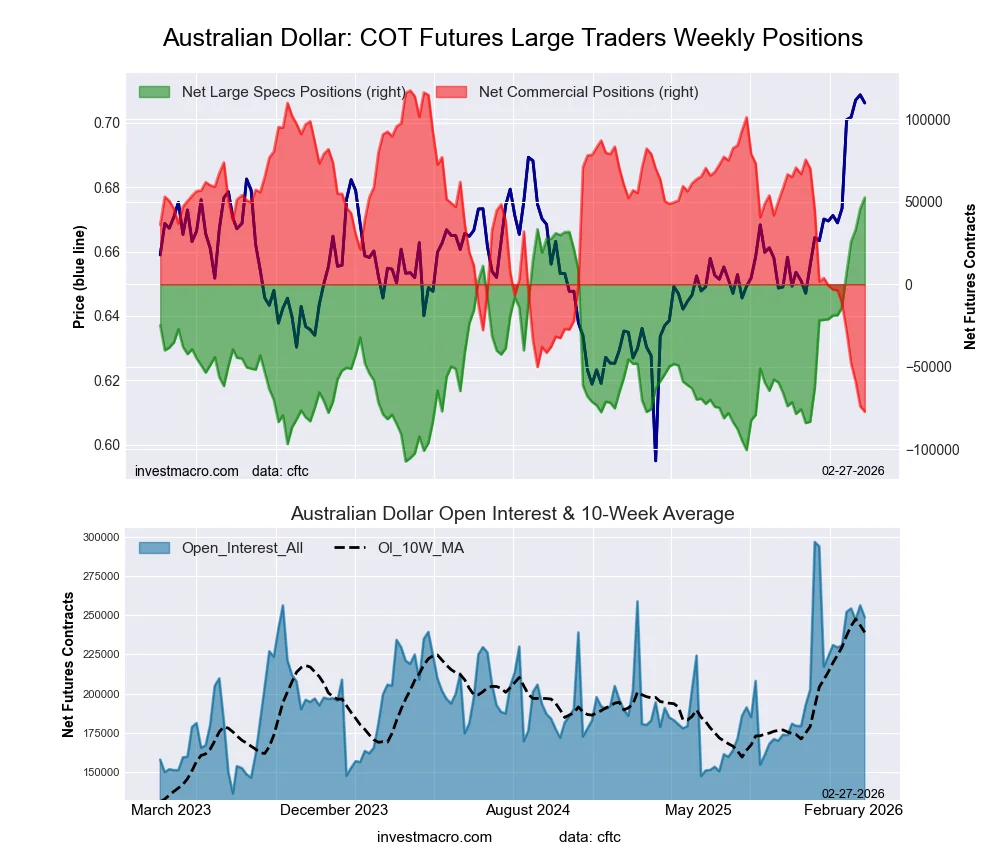
Next up, the Australian Dollar speculative bets surged higher for a second consecutive week, and are now in an overall bullish position also for a second straight week. Last week marked the first time since December of 2024 that the Australian Dollar speculative position was in bullish territory. And this week, the position grew further. The Australian Dollar exchange rate has risen for three consecutive weeks, and this week closed at the highest levels since 2023, where it closed above the 0.700 significant psychological level. The Australian Dollar is up by over 5% against the U.S. Dollar this year so far, and is higher by about 14% since the start of 2025. The weekly RSI for the Australian Dollar is currently in overbought position so we’ll see if the Aussie can hold these multi-year high levels.

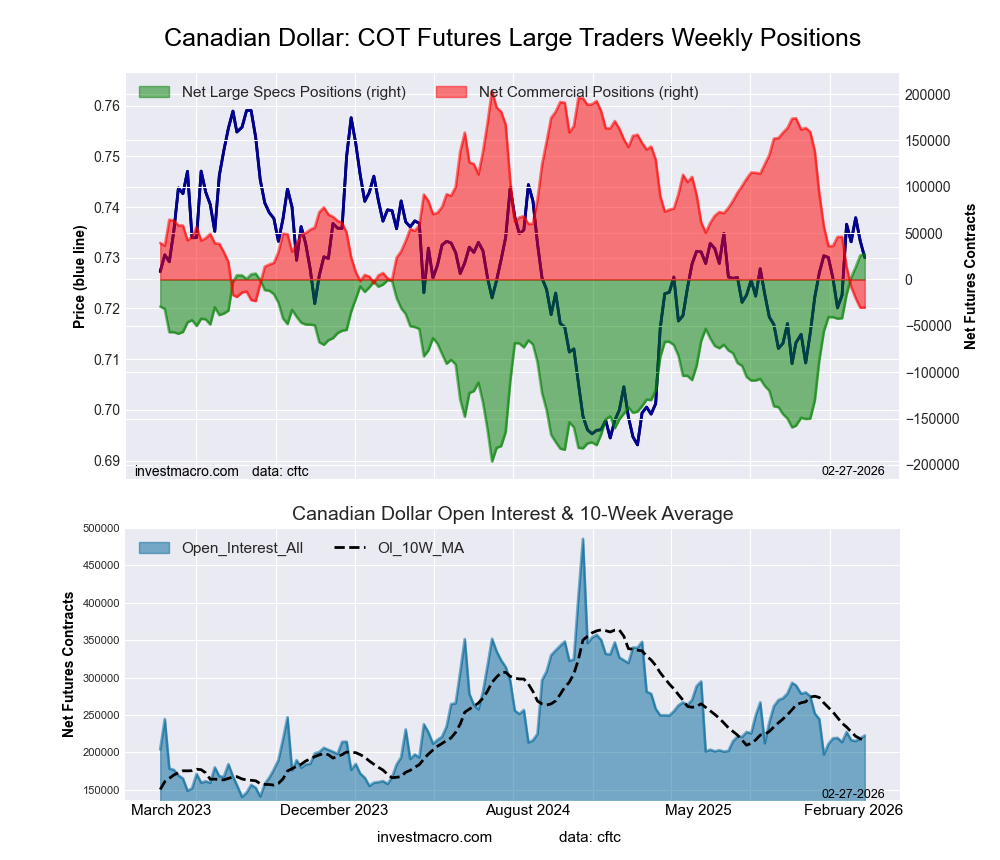
The Canadian Dollar speculator positions rose for a third consecutive week, as well as the eighth time in the last ten weeks that speculator bets have been bullish. Overall, the net standing for the Canadian Dollar speculators this week went bullish with a total of 2,130 net contracts. This is the first time the Canadian Dollar has seen a bullish net contract level since August 1st of 2023, a span of 131 straight weeks. The turnaround in the Canadian Dollar speculator positions has been fast and furious as the net position totaled a -130,600 contracts as recently as December 9th. And then eight weeks later, the net position has managed to turn bullish. In the foreign exchange markets, the Canadian Dollar trades right around its 200-week moving average at the 0.7333 exchange rate. This week, the CAD fell a little bit, but has been higher in total over the past three weeks. Time will tell if the CAD can break through its 200-weekly moving average level and can work its way back to the strong support and resistance level of 0.7500.

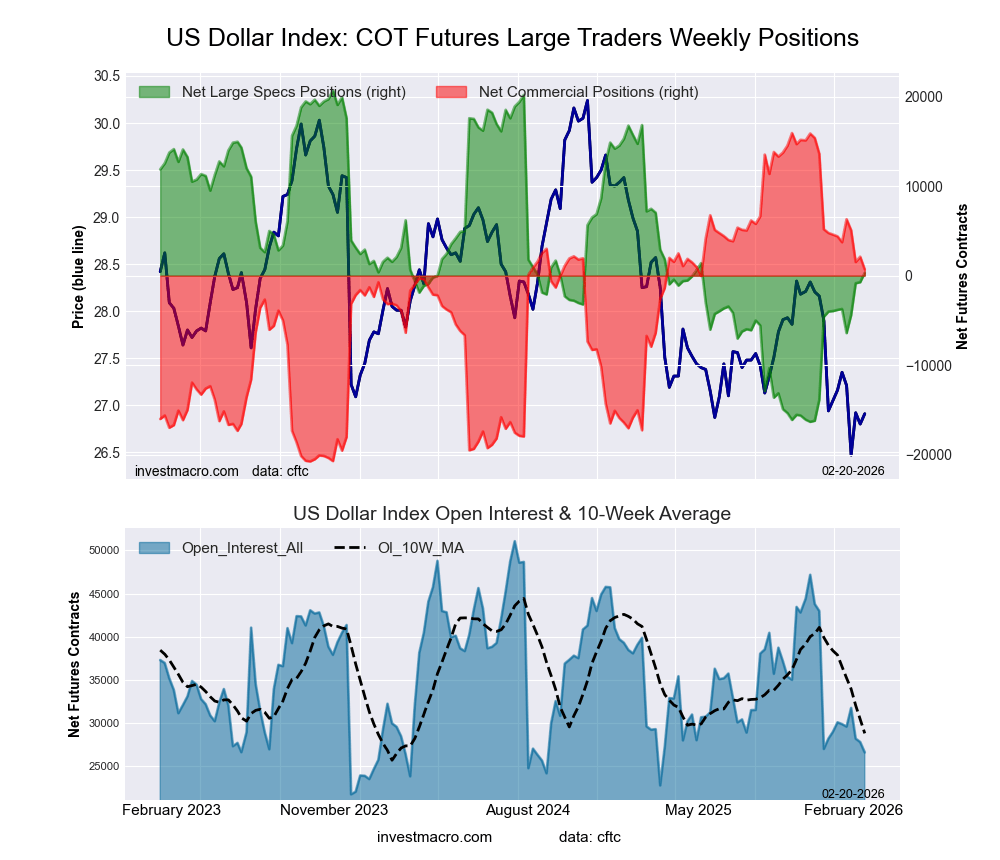
The US Dollar Index saw improving bets for the second consecutive week and for the ninth time out of the last 10 weeks. This has taken the speculator level from a total of -16,347 net contracts down to a tiny bearish level of just -852 net contracts this week. Overall, the Dollar Index has consistently been in a bearish level dating back to June 10th of 2025, a span of 34 consecutive weeks. In the foreign exchange market, the US Dollar Index saw a boost this week after falling for the previous two weeks and trades at the 97.50 level. Since the beginning of 2025, the Dollar Index has fallen by over 10%, however, prices have bounced off the 96.00 area three times since June. We’ll see if the Dollar Index can hold this level and can find its way higher or will eventually break lower.

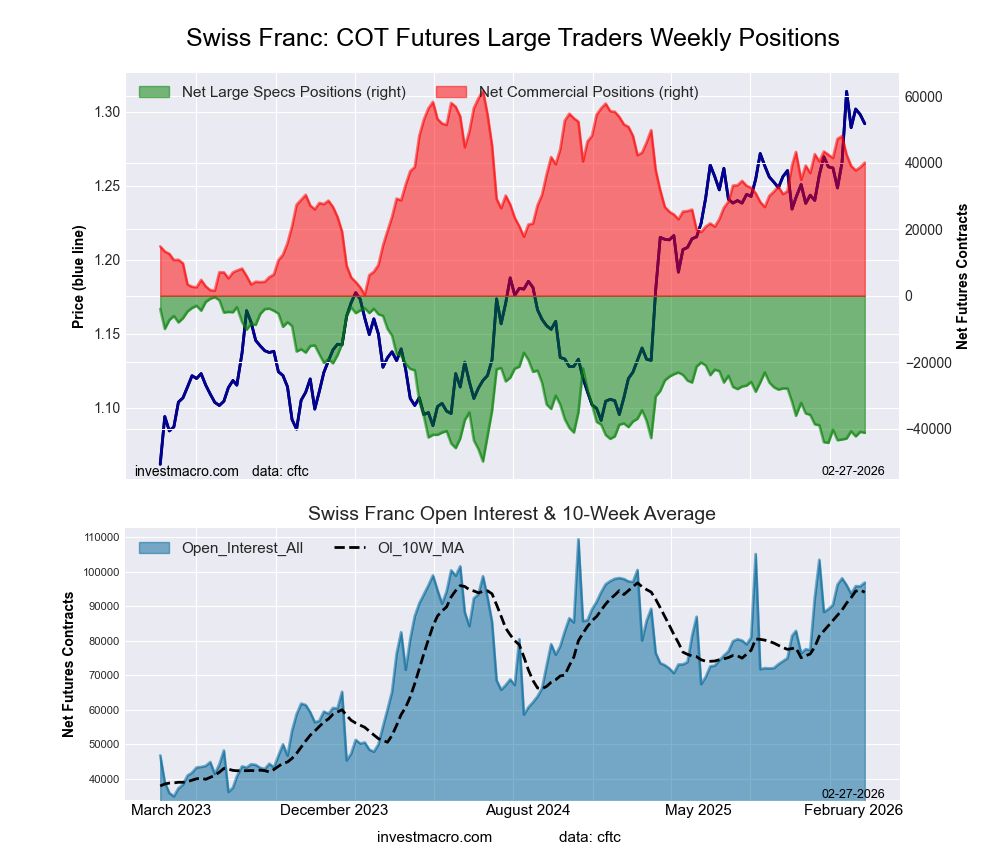
Finally, the Swiss Franc positions rose modestly for a third consecutive week and for the fourth time out of the past five weeks. Interestingly, the Swiss Franc speculator net position is highly bearish and has been in an overall bearish level dating all the way back to September of 2021 while the Swiss Franc exchange rate is at the strongest levels it has traded since 2011. The dichotomy in the speculator positions versus the strength of the currency can be explained through hedging, as there has been reports that many business entities are hedging away the historic strength of the Swiss Franc at the current time while the Franc is also a sought-after safe haven in an uncertain geopolitical time. Currently, the Swiss Franc trades at 1.2946 against the U.S. Dollar in the exchange markets. Since the beginning of 2025, the Franc is up by approximately 18% against the U.S. Dollar and looks to be threatening the 1.30 major level.

Mexican Peso leads Currency Price Returns this week

The major currency markets price performance was led by the Mexican Peso this week. The Peso was the highest riser by 1.25% over the past five days. The Brazilian Real followed that up with a 0.99% gain. The Australian Dollar was higher by 0.79%. The US Dollar Index showed a 0.60% rise. The New Zealand Dollar was virtually unchanged at a 0.04% dip, followed by the euro which fell by 0.26%. The Canadian Dollar was lower by 0.28%. The Swiss Franc fell by 0.30%. The British Pound was lower by 0.48%. The Japanese Yen was lower by over 1% with a 1.48% decrease.

Bitcoin was the biggest loser on the week with a 16.45% drop.


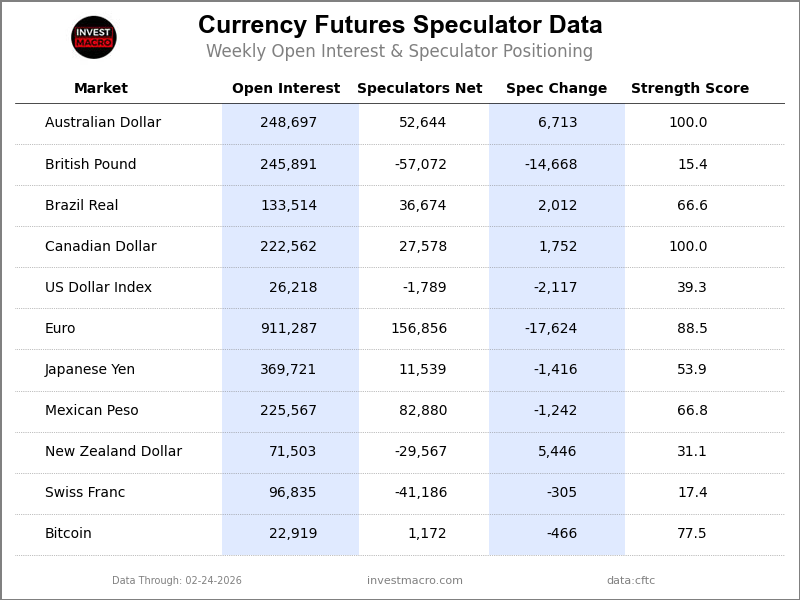
Currencies Data:

Speculators FX Futures COT Data Table
Legend: Open Interest | Speculators Current Net Position | Weekly Specs Change | Specs Strength Score compared to last 3-Years (0-100 range)


Strength Scores led by Canadian Dollar & Australian Dollar
Speculators Strength Scores FX Futures COT Chart
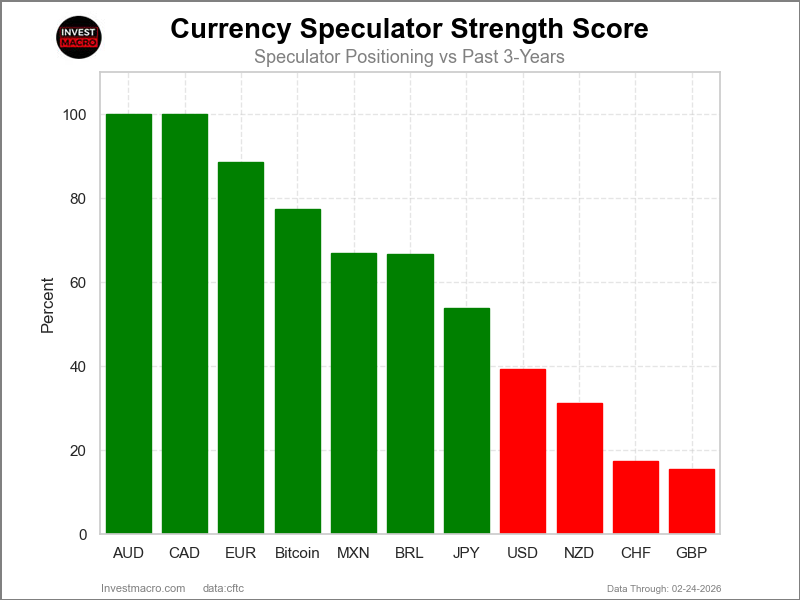
COT Strength Scores (a normalized measure of Speculator positions over a 3-Year range, from 0 to 100 where above 80 is Extreme-Bullish and below 20 is Extreme-Bearish) showed that the Canadian Dollar (98 percent) and the Australian Dollar (95 percent) lead the currency markets this week. The EuroFX (91 percent), Bitcoin (74 percent) and the Mexican Peso (73 percent) come in as the next highest in the weekly strength scores.

On the downside, the Swiss Franc (18 percent) comes in at the lowest strength levels currently and are in Extreme-Bearish territory (below 20 percent). The next lowest strength scores are the the New Zealand Dollar (26 percent), the British Pound (34 percent) and the US Dollar Index (42 percent).

3-Year Strength Statistics:
US Dollar Index (41.8 percent) vs US Dollar Index previous week (32.2 percent)
EuroFX (91.0 percent) vs EuroFX previous week (79.1 percent)
British Pound Sterling (33.7 percent) vs British Pound Sterling previous week (32.7 percent)
Japanese Yen (45.4 percent) vs Japanese Yen previous week (41.4 percent)
Swiss Franc (18.4 percent) vs Swiss Franc previous week (14.0 percent)
Canadian Dollar (97.9 percent) vs Canadian Dollar previous week (88.9 percent)
Australian Dollar (94.8 percent) vs Australian Dollar previous week (81.4 percent)
New Zealand Dollar (25.7 percent) vs New Zealand Dollar previous week (10.3 percent)
Mexican Peso (72.6 percent) vs Mexican Peso previous week (79.6 percent)
Brazilian Real (62.5 percent) vs Brazilian Real previous week (53.6 percent)
Bitcoin (74.1 percent) vs Bitcoin previous week (67.3 percent)


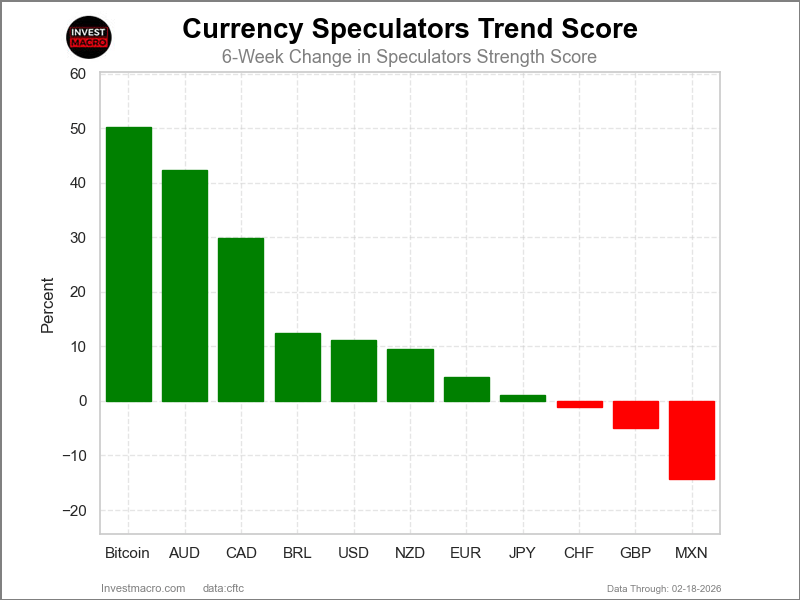
Australian Dollar & Bitcoin top the 6-Week Strength Trends

Speculators Trends FX Futures COT Chart
COT Strength Score Trends (or move index, calculates the 6-week changes in strength scores) showed that the Australian Dollar (34 percent) and the Bitcoin (32 percent) lead the past six weeks trends for the currencies. The Canadian Dollar (29 percent), the British Pound (12 percent) and the New Zealand Dollar (11 percent) are the next highest positive movers in the 3-Year trends data.

The Brazilian Real (-12 percent) leads the downside trend scores currently with the Mexican Peso (-6 percent), Japanese Yen (-6 percent) and the EuroFX (1 percent) following next with lower trend scores.

3-Year Strength Trends:
US Dollar Index (8.6 percent) vs US Dollar Index previous week (0.5 percent)
EuroFX (1.3 percent) vs EuroFX previous week (-4.9 percent)
British Pound Sterling (11.6 percent) vs British Pound Sterling previous week (13.7 percent)
Japanese Yen (-5.6 percent) vs Japanese Yen previous week (-8.5 percent)
Swiss Franc (6.6 percent) vs Swiss Franc previous week (-8.1 percent)
Canadian Dollar (28.6 percent) vs Canadian Dollar previous week (34.8 percent)
Australian Dollar (33.9 percent) vs Australian Dollar previous week (20.6 percent)
New Zealand Dollar (11.1 percent) vs New Zealand Dollar previous week (0.3 percent)
Mexican Peso (-5.9 percent) vs Mexican Peso previous week (8.9 percent)
Brazilian Real (-12.2 percent) vs Brazilian Real previous week (-21.2 percent)
Bitcoin (31.5 percent) vs Bitcoin previous week (12.4 percent)


Individual COT Forex Markets:

US Dollar Index Futures:

US Dollar Index Forex Futures COT ChartThe US Dollar Index large speculator standing this week recorded a net position of -852 contracts in the data reported through Tuesday. This was a weekly gain of 3,553 contracts from the previous week which had a total of -4,405 net contracts.

This week’s current strength score (the trader positioning range over the past three years, measured from 0 to 100) shows the speculators are currently Bearish with a score of 41.8 percent. The commercials are Bullish with a score of 60.7 percent and the small traders (not shown in chart) are Bearish with a score of 23.3 percent.

Price Trend-Following Model: Strong Downtrend

Our weekly trend-following model classifies the current market price position as: Strong Downtrend.

US DOLLAR INDEX StatisticsSPECULATORSCOMMERCIALSSMALL TRADERS
– Percent of Open Interest Longs:58.925.77.8
– Percent of Open Interest Shorts:61.920.310.2
– Net Position:-8521,529-677
– Gross Longs:16,6107,2392,188
– Gross Shorts:17,4625,7102,865
– Long to Short Ratio:1.0 to 11.3 to 10.8 to 1
NET POSITION TREND:
– Strength Index Score (3 Year Range Pct):41.860.723.3
– Strength Index Reading (3 Year Range):BearishBullishBearish
NET POSITION MOVEMENT INDEX:
– 6-Week Change in Strength Index:8.6-8.81.2


Euro Currency Futures:

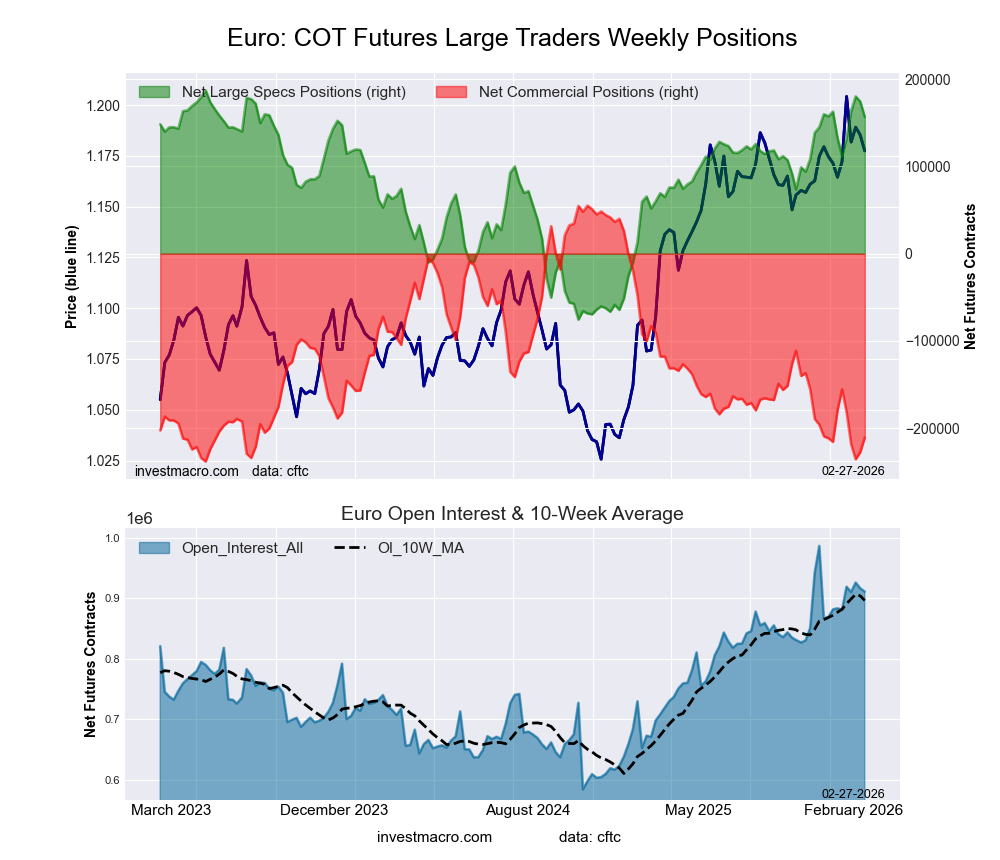
Euro Currency Futures COT ChartThe Euro Currency large speculator standing this week recorded a net position of 163,361 contracts in the data reported through Tuesday. This was a weekly lift of 31,227 contracts from the previous week which had a total of 132,134 net contracts.

This week’s current strength score (the trader positioning range over the past three years, measured from 0 to 100) shows the speculators are currently Bullish-Extreme with a score of 91.0 percent. The commercials are Bearish-Extreme with a score of 6.7 percent and the small traders (not shown in chart) are Bullish-Extreme with a score of 91.0 percent.

Price Trend-Following Model: Strong Uptrend

Our weekly trend-following model classifies the current market price position as: Strong Uptrend.

EURO Currency StatisticsSPECULATORSCOMMERCIALSSMALL TRADERS
– Percent of Open Interest Longs:33.253.110.2
– Percent of Open Interest Shorts:15.377.24.2
– Net Position:163,361-218,54155,180
– Gross Longs:302,301483,91193,181
– Gross Shorts:138,940702,45238,001
– Long to Short Ratio:2.2 to 10.7 to 12.5 to 1
NET POSITION TREND:
– Strength Index Score (3 Year Range Pct):91.06.791.0
– Strength Index Reading (3 Year Range):Bullish-ExtremeBearish-ExtremeBullish-Extreme
NET POSITION MOVEMENT INDEX:
– 6-Week Change in Strength Index:1.3-3.111.8


British Pound Sterling Futures:

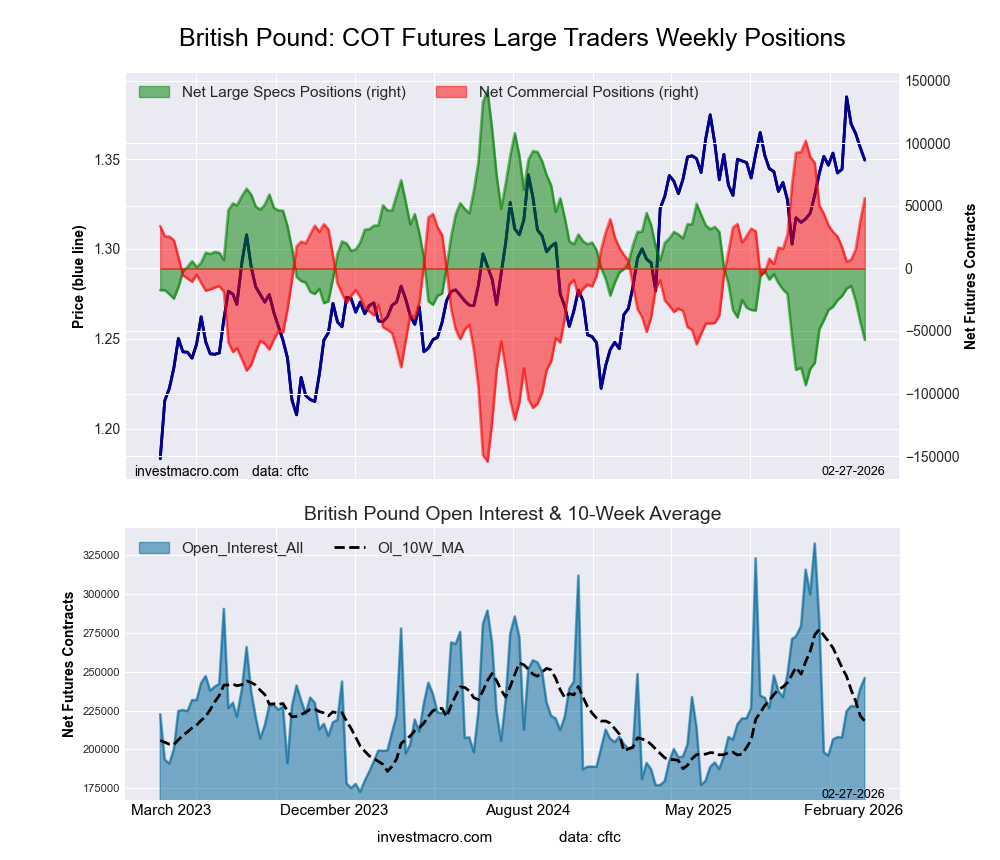
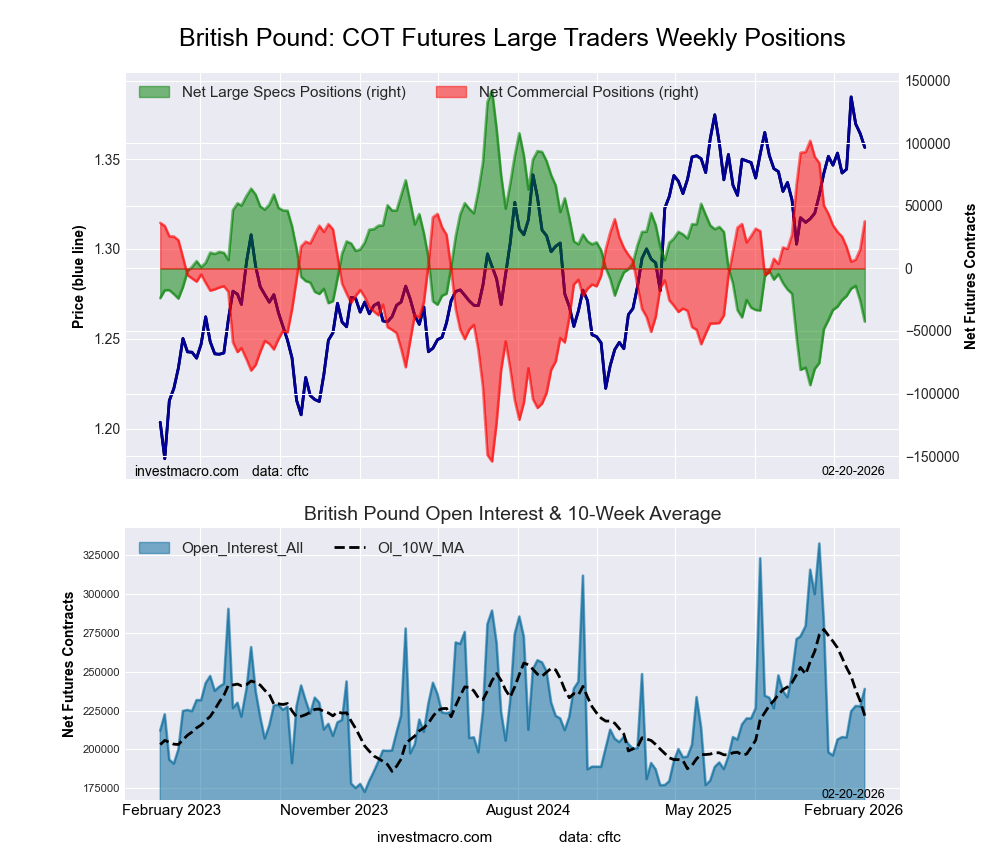
British Pound Sterling Futures COT ChartThe British Pound Sterling large speculator standing this week recorded a net position of -13,911 contracts in the data reported through Tuesday. This was a weekly boost of 2,251 contracts from the previous week which had a total of -16,162 net contracts.

This week’s current strength score (the trader positioning range over the past three years, measured from 0 to 100) shows the speculators are currently Bearish with a score of 33.7 percent. The commercials are Bullish with a score of 63.0 percent and the small traders (not shown in chart) are Bullish with a score of 71.0 percent.

Price Trend-Following Model: Strong Uptrend

Our weekly trend-following model classifies the current market price position as: Strong Uptrend.

BRITISH POUND StatisticsSPECULATORSCOMMERCIALSSMALL TRADERS
– Percent of Open Interest Longs:41.642.115.0
– Percent of Open Interest Shorts:47.739.012.0
– Net Position:-13,9117,0646,847
– Gross Longs:94,89396,00434,151
– Gross Shorts:108,80488,94027,304
– Long to Short Ratio:0.9 to 11.1 to 11.3 to 1
NET POSITION TREND:
– Strength Index Score (3 Year Range Pct):33.763.071.0
– Strength Index Reading (3 Year Range):BearishBullishBullish
NET POSITION MOVEMENT INDEX:
– 6-Week Change in Strength Index:11.6-14.324.2


Japanese Yen Futures:

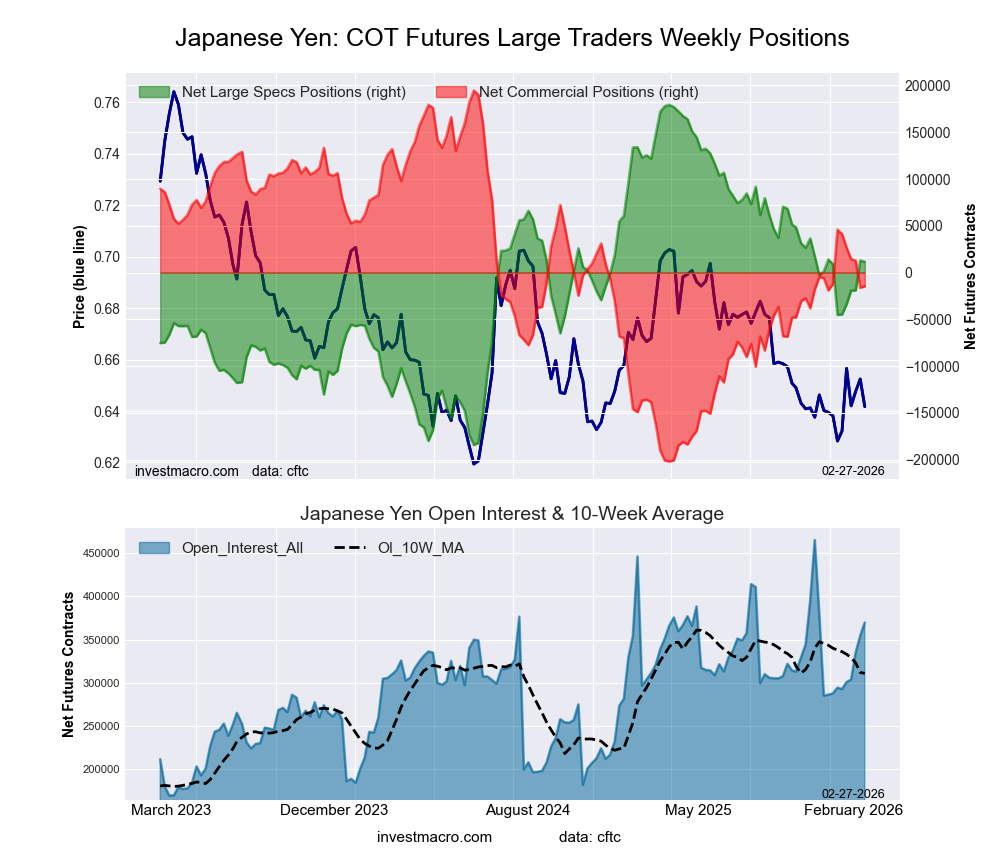
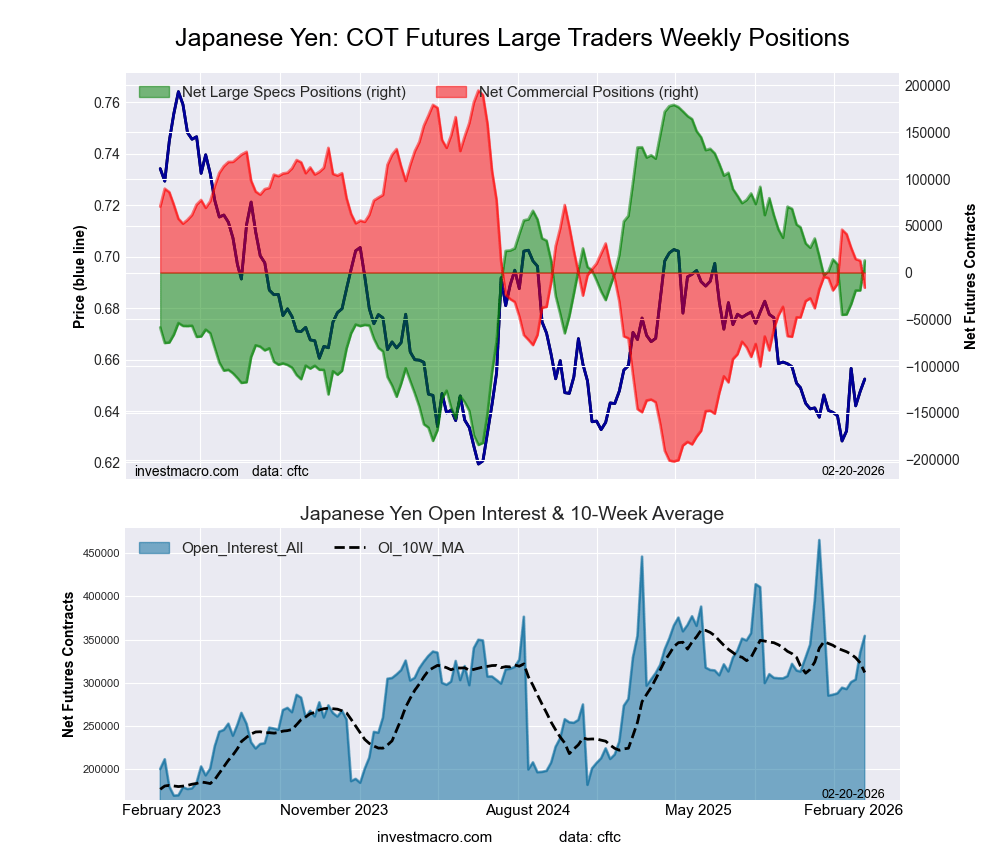
Japanese Yen Forex Futures COT ChartThe Japanese Yen large speculator standing this week recorded a net position of -19,222 contracts in the data reported through Tuesday. This was a weekly rise of 14,711 contracts from the previous week which had a total of -33,933 net contracts.

This week’s current strength score (the trader positioning range over the past three years, measured from 0 to 100) shows the speculators are currently Bearish with a score of 45.4 percent. The commercials are Bullish with a score of 54.6 percent and the small traders (not shown in chart) are Bearish with a score of 49.3 percent.

Price Trend-Following Model: Downtrend

Our weekly trend-following model classifies the current market price position as: Downtrend.

JAPANESE YEN StatisticsSPECULATORSCOMMERCIALSSMALL TRADERS
– Percent of Open Interest Longs:37.740.412.9
– Percent of Open Interest Shorts:44.035.611.3
– Net Position:-19,22214,4174,805
– Gross Longs:114,428122,66539,140
– Gross Shorts:133,650108,24834,335
– Long to Short Ratio:0.9 to 11.1 to 11.1 to 1
NET POSITION TREND:
– Strength Index Score (3 Year Range Pct):45.454.649.3
– Strength Index Reading (3 Year Range):BearishBullishBearish
NET POSITION MOVEMENT INDEX:
– 6-Week Change in Strength Index:-5.65.10.3


Swiss Franc Futures:

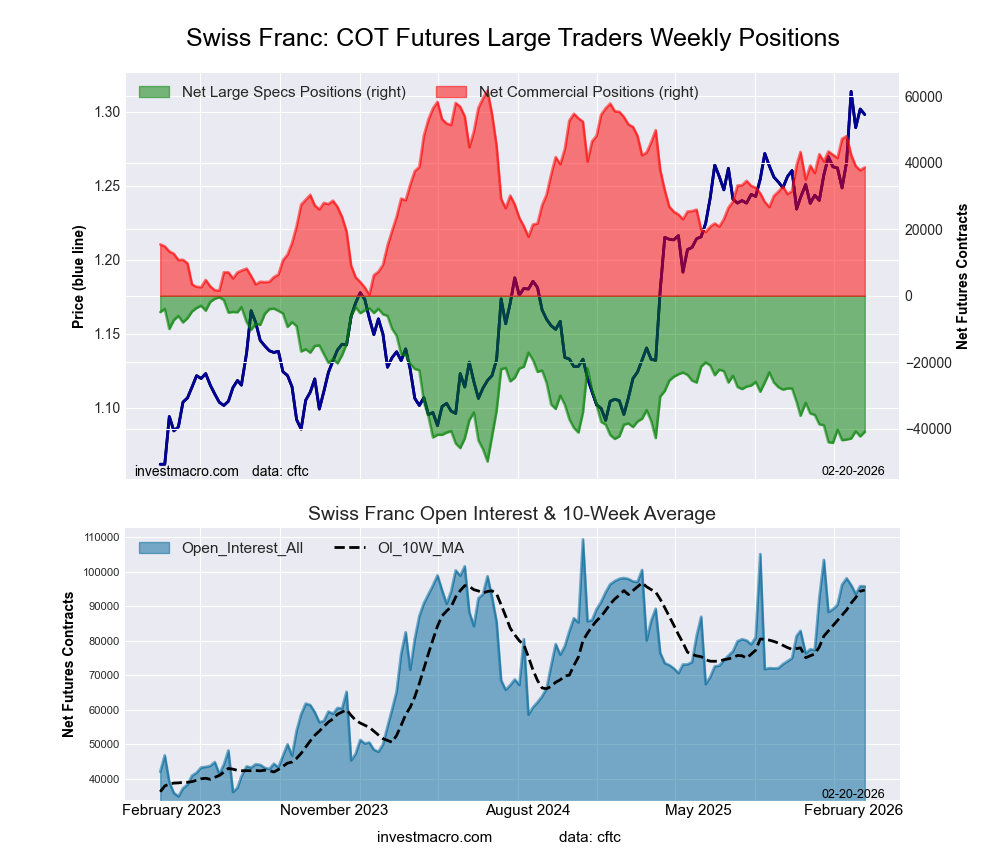
Swiss Franc Forex Futures COT ChartThe Swiss Franc large speculator standing this week recorded a net position of -40,717 contracts in the data reported through Tuesday. This was a weekly advance of 2,176 contracts from the previous week which had a total of -42,893 net contracts.

This week’s current strength score (the trader positioning range over the past three years, measured from 0 to 100) shows the speculators are currently Bearish-Extreme with a score of 18.4 percent. The commercials are Bullish with a score of 63.1 percent and the small traders (not shown in chart) are Bullish-Extreme with a score of 86.0 percent.

Price Trend-Following Model: Strong Uptrend

Our weekly trend-following model classifies the current market price position as: Strong Uptrend.

SWISS FRANC StatisticsSPECULATORSCOMMERCIALSSMALL TRADERS
– Percent of Open Interest Longs:10.469.919.1
– Percent of Open Interest Shorts:53.928.217.3
– Net Position:-40,71739,0121,705
– Gross Longs:9,68765,42417,858
– Gross Shorts:50,40426,41216,153
– Long to Short Ratio:0.2 to 12.5 to 11.1 to 1
NET POSITION TREND:
– Strength Index Score (3 Year Range Pct):18.463.186.0
– Strength Index Reading (3 Year Range):Bearish-ExtremeBullishBullish-Extreme
NET POSITION MOVEMENT INDEX:
– 6-Week Change in Strength Index:6.6-7.14.5


Canadian Dollar Futures:

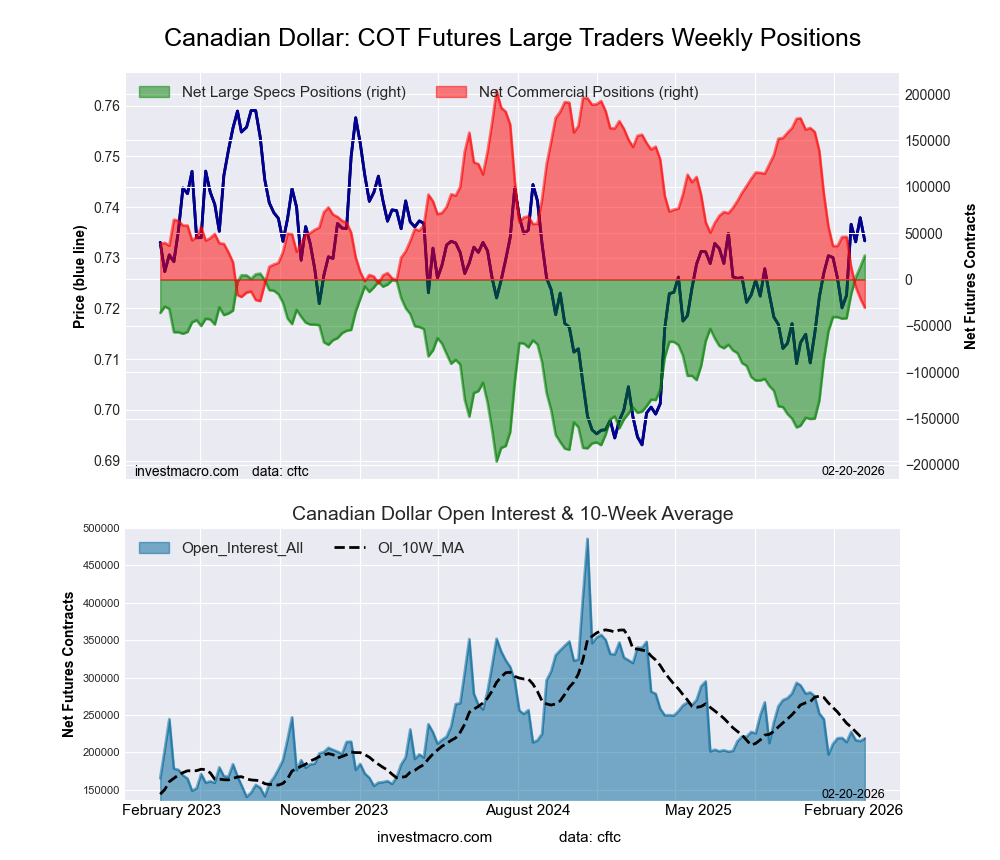
Canadian Dollar Forex Futures COT ChartThe Canadian Dollar large speculator standing this week recorded a net position of 2,130 contracts in the data reported through Tuesday. This was a weekly gain of 18,176 contracts from the previous week which had a total of -16,046 net contracts.

This week’s current strength score (the trader positioning range over the past three years, measured from 0 to 100) shows the speculators are currently Bullish-Extreme with a score of 97.9 percent. The commercials are Bearish-Extreme with a score of 6.8 percent and the small traders (not shown in chart) are Bullish with a score of 61.5 percent.

Price Trend-Following Model: Strong Uptrend

Our weekly trend-following model classifies the current market price position as: Strong Uptrend.

CANADIAN DOLLAR StatisticsSPECULATORSCOMMERCIALSSMALL TRADERS
– Percent of Open Interest Longs:35.848.114.4
– Percent of Open Interest Shorts:34.851.811.8
– Net Position:2,130-7,9165,786
– Gross Longs:77,397104,11931,230
– Gross Shorts:75,267112,03525,444
– Long to Short Ratio:1.0 to 10.9 to 11.2 to 1
NET POSITION TREND:
– Strength Index Score (3 Year Range Pct):97.96.861.5
– Strength Index Reading (3 Year Range):Bullish-ExtremeBearish-ExtremeBullish
NET POSITION MOVEMENT INDEX:
– 6-Week Change in Strength Index:28.6-28.720.1


Australian Dollar Futures:

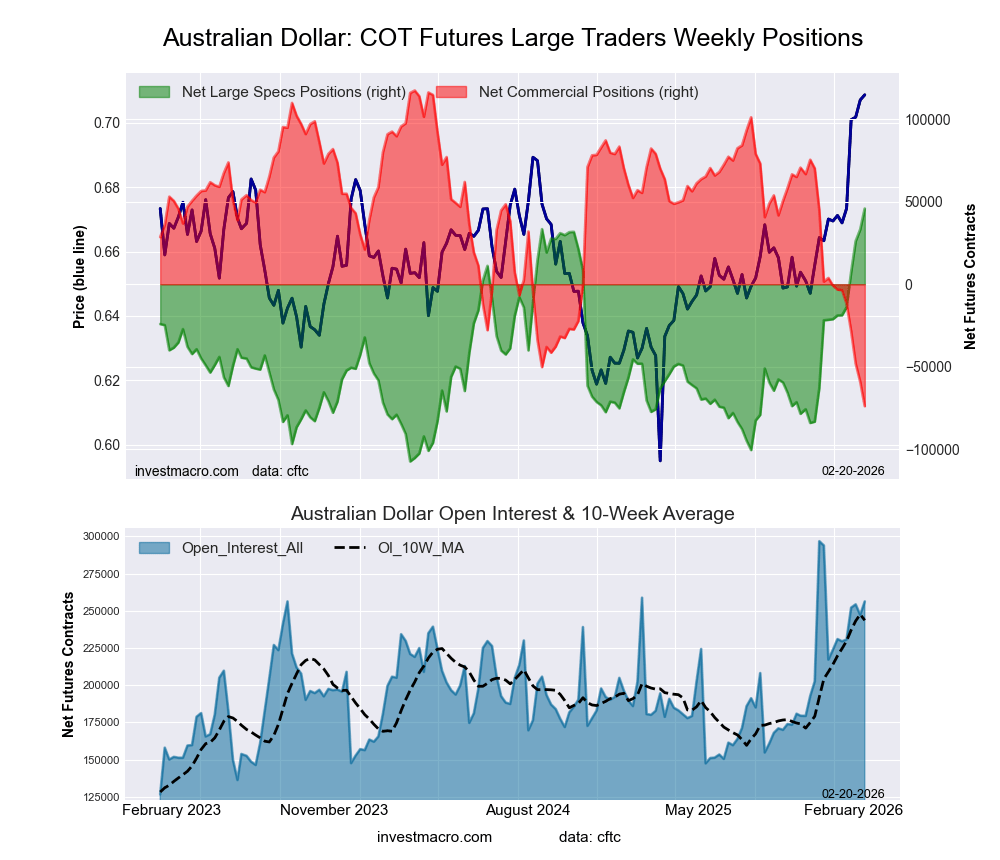
Australian Dollar Forex Futures COT ChartThe Australian Dollar large speculator standing this week recorded a net position of 26,118 contracts in the data reported through Tuesday. This was a weekly boost of 18,972 contracts from the previous week which had a total of 7,146 net contracts.

This week’s current strength score (the trader positioning range over the past three years, measured from 0 to 100) shows the speculators are currently Bullish-Extreme with a score of 94.8 percent. The commercials are Bearish-Extreme with a score of 1.3 percent and the small traders (not shown in chart) are Bullish-Extreme with a score of 91.3 percent.

Price Trend-Following Model: Strong Uptrend

Our weekly trend-following model classifies the current market price position as: Strong Uptrend.

AUSTRALIAN DOLLAR StatisticsSPECULATORSCOMMERCIALSSMALL TRADERS
– Percent of Open Interest Longs:46.736.416.3
– Percent of Open Interest Shorts:36.455.37.7
– Net Position:26,118-48,06021,942
– Gross Longs:118,75192,58241,430
– Gross Shorts:92,633140,64219,488
– Long to Short Ratio:1.3 to 10.7 to 12.1 to 1
NET POSITION TREND:
– Strength Index Score (3 Year Range Pct):94.81.391.3
– Strength Index Reading (3 Year Range):Bullish-ExtremeBearish-ExtremeBullish-Extreme
NET POSITION MOVEMENT INDEX:
– 6-Week Change in Strength Index:33.9-30.99.3


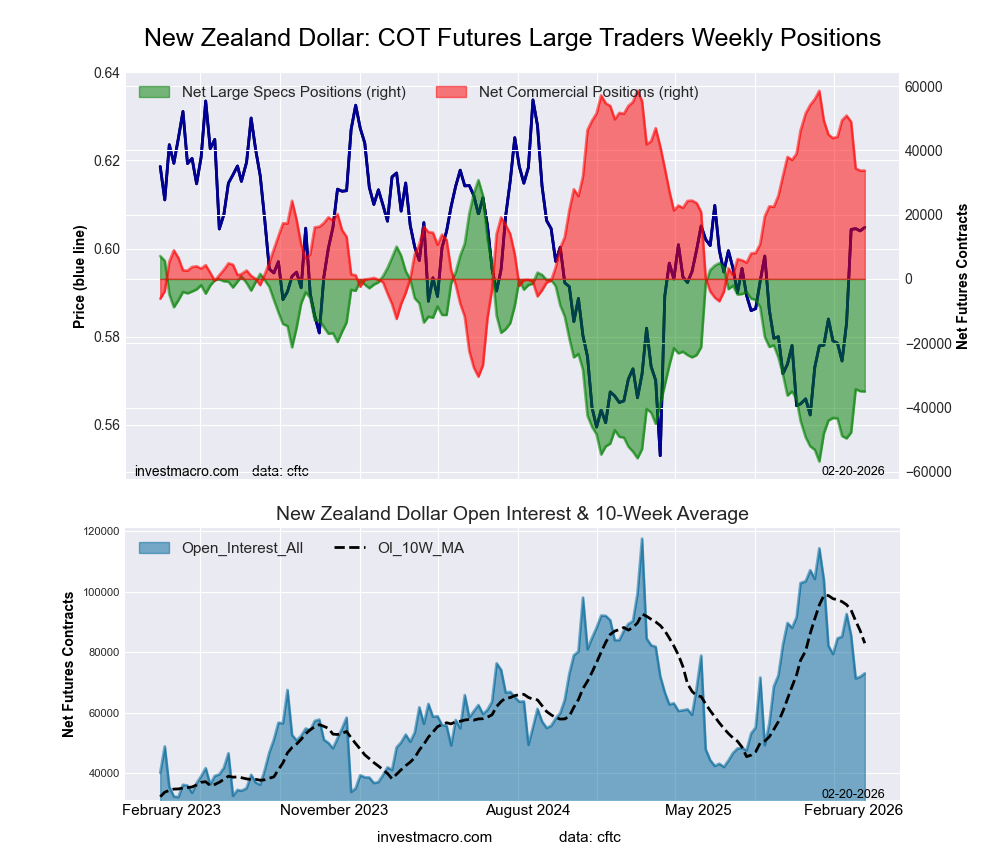
New Zealand Dollar Futures:

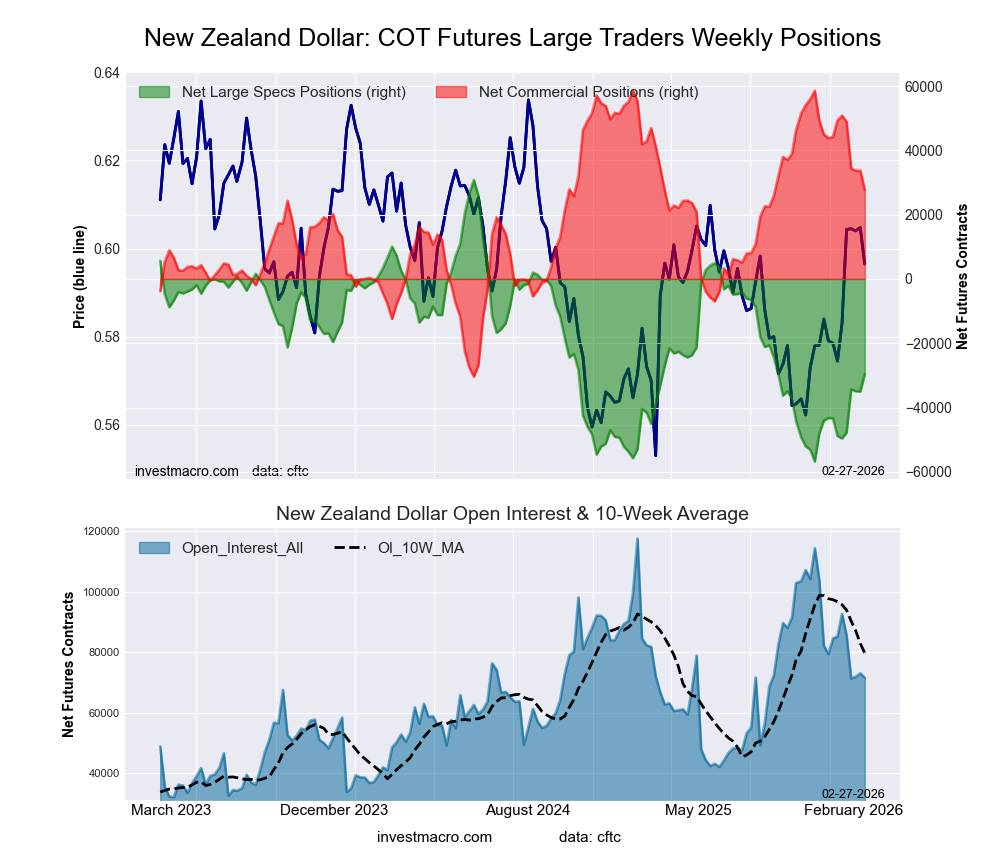
New Zealand Dollar Forex Futures COT ChartThe New Zealand Dollar large speculator standing this week recorded a net position of -34,294 contracts in the data reported through Tuesday. This was a weekly gain of 13,451 contracts from the previous week which had a total of -47,745 net contracts.

This week’s current strength score (the trader positioning range over the past three years, measured from 0 to 100) shows the speculators are currently Bearish with a score of 25.7 percent. The commercials are Bullish with a score of 72.8 percent and the small traders (not shown in chart) are Bullish with a score of 51.3 percent.

Price Trend-Following Model: Strong Uptrend

Our weekly trend-following model classifies the current market price position as: Strong Uptrend.

NEW ZEALAND DOLLAR StatisticsSPECULATORSCOMMERCIALSSMALL TRADERS
– Percent of Open Interest Longs:16.776.65.6
– Percent of Open Interest Shorts:64.828.45.7
– Net Position:-34,29434,376-82
– Gross Longs:11,88354,5963,988
– Gross Shorts:46,17720,2204,070
– Long to Short Ratio:0.3 to 12.7 to 11.0 to 1
NET POSITION TREND:
– Strength Index Score (3 Year Range Pct):25.772.851.3
– Strength Index Reading (3 Year Range):BearishBullishBullish
NET POSITION MOVEMENT INDEX:
– 6-Week Change in Strength Index:11.1-11.910.5


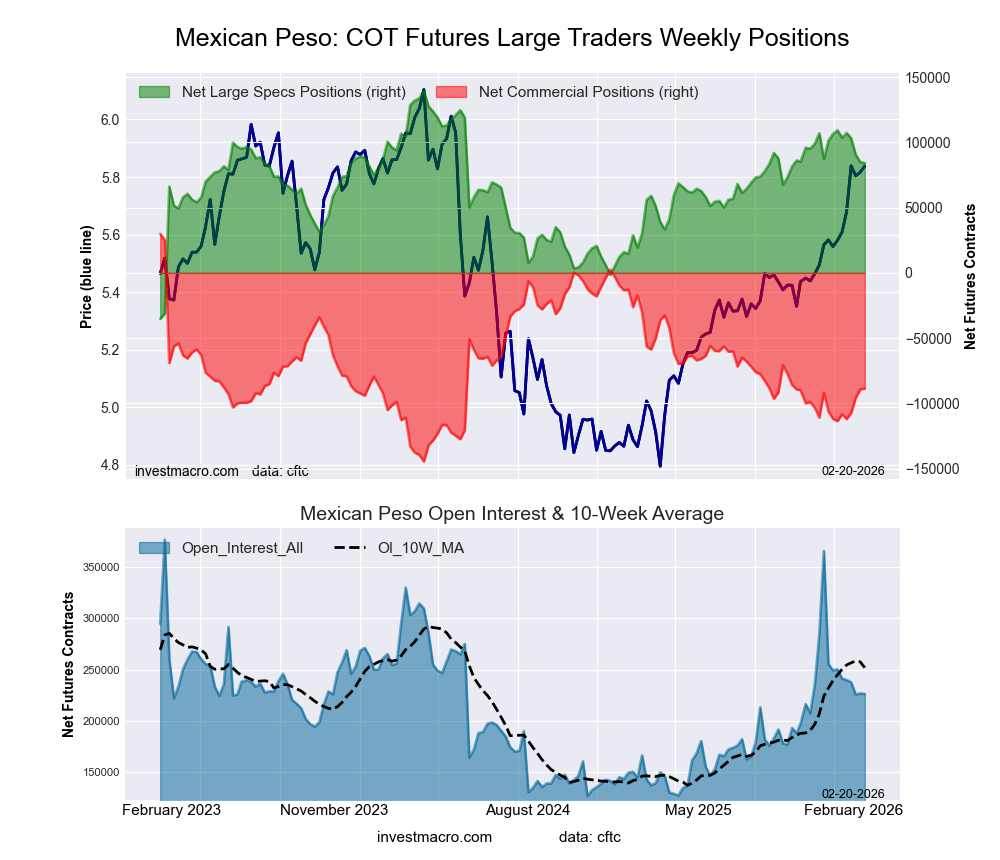
Mexican Peso Futures:

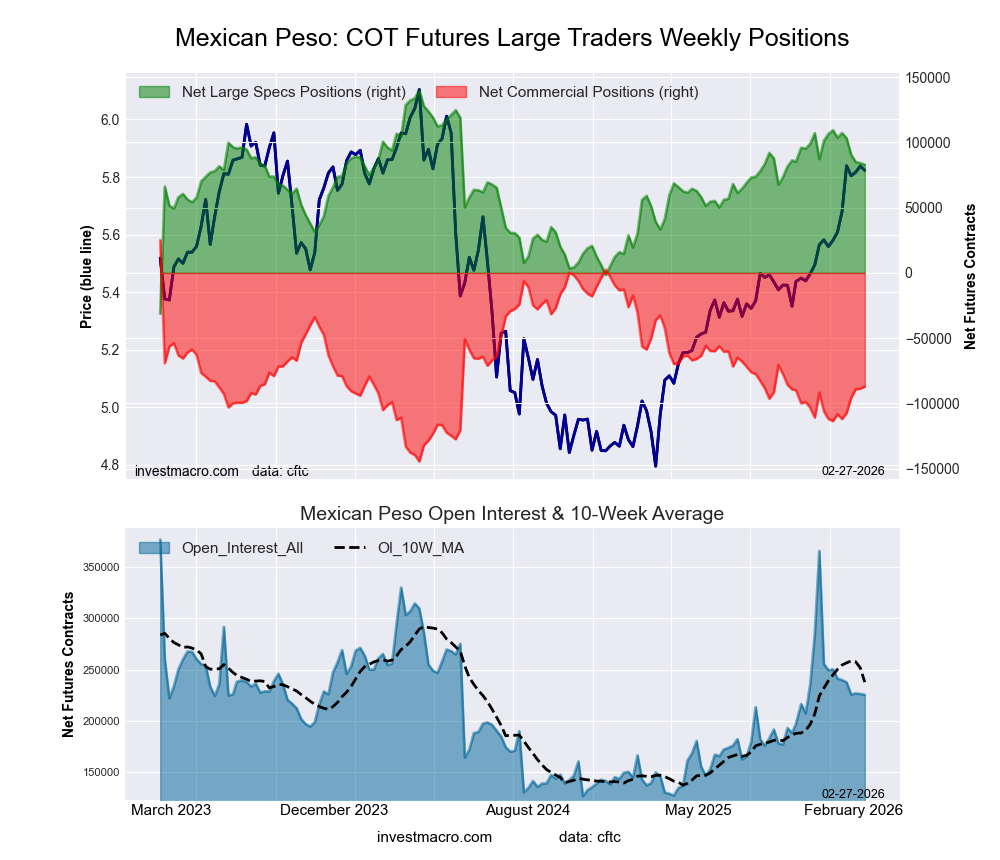
Mexican Peso Futures COT ChartThe Mexican Peso large speculator standing this week recorded a net position of 90,592 contracts in the data reported through Tuesday. This was a weekly lowering of -12,522 contracts from the previous week which had a total of 103,114 net contracts.

This week’s current strength score (the trader positioning range over the past three years, measured from 0 to 100) shows the speculators are currently Bullish with a score of 72.6 percent. The commercials are Bearish with a score of 27.3 percent and the small traders (not shown in chart) are Bullish with a score of 51.7 percent.

Price Trend-Following Model: Strong Uptrend

Our weekly trend-following model classifies the current market price position as: Strong Uptrend.

MEXICAN PESO StatisticsSPECULATORSCOMMERCIALSSMALL TRADERS
– Percent of Open Interest Longs:58.637.33.4
– Percent of Open Interest Shorts:18.579.71.1
– Net Position:90,592-95,8035,211
– Gross Longs:132,39284,2247,660
– Gross Shorts:41,800180,0272,449
– Long to Short Ratio:3.2 to 10.5 to 13.1 to 1
NET POSITION TREND:
– Strength Index Score (3 Year Range Pct):72.627.351.7
– Strength Index Reading (3 Year Range):BullishBearishBullish
NET POSITION MOVEMENT INDEX:
– 6-Week Change in Strength Index:-5.95.71.9


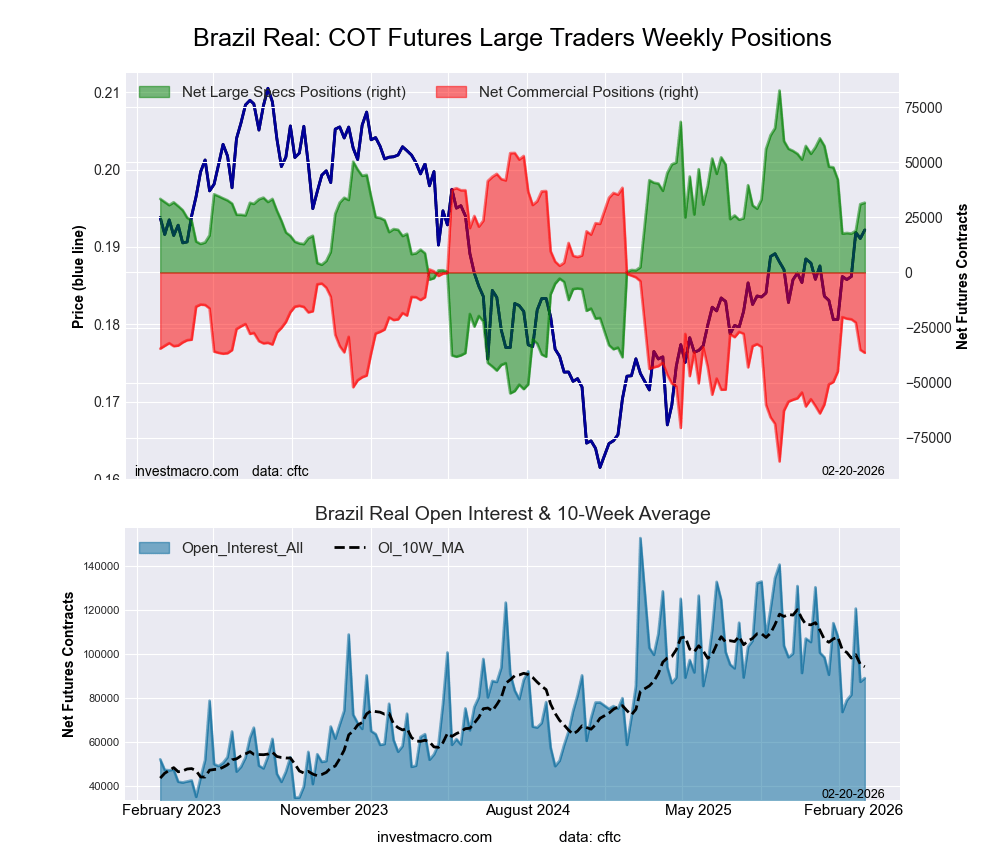
Brazilian Real Futures:

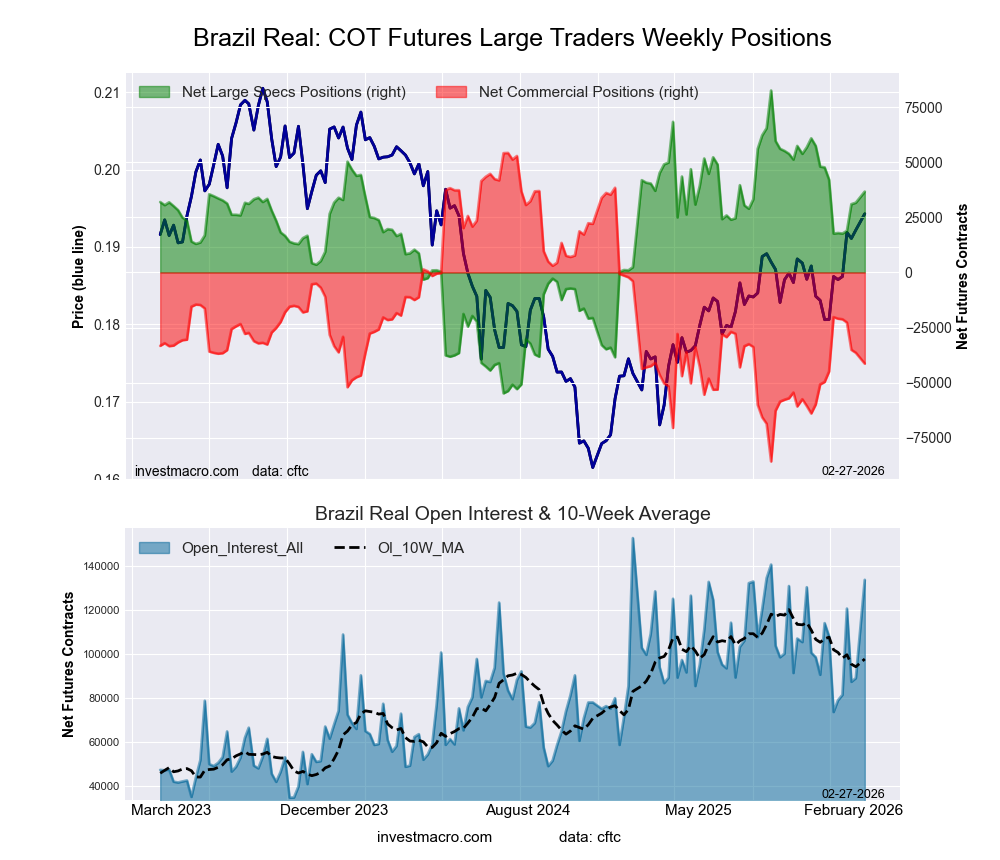
Brazil Real Futures COT ChartThe Brazilian Real large speculator standing this week recorded a net position of 30,962 contracts in the data reported through Tuesday. This was a weekly lift of 12,117 contracts from the previous week which had a total of 18,845 net contracts.

This week’s current strength score (the trader positioning range over the past three years, measured from 0 to 100) shows the speculators are currently Bullish with a score of 62.5 percent. The commercials are Bearish with a score of 36.2 percent and the small traders (not shown in chart) are Bearish with a score of 44.4 percent.

Price Trend-Following Model: Strong Uptrend

Our weekly trend-following model classifies the current market price position as: Strong Uptrend.

BRAZIL REAL StatisticsSPECULATORSCOMMERCIALSSMALL TRADERS
– Percent of Open Interest Longs:65.528.05.9
– Percent of Open Interest Shorts:30.168.21.1
– Net Position:30,962-35,1334,171
– Gross Longs:57,23224,4215,163
– Gross Shorts:26,27059,554992
– Long to Short Ratio:2.2 to 10.4 to 15.2 to 1
NET POSITION TREND:
– Strength Index Score (3 Year Range Pct):62.536.244.4
– Strength Index Reading (3 Year Range):BullishBearishBearish
NET POSITION MOVEMENT INDEX:
– 6-Week Change in Strength Index:-12.210.411.9


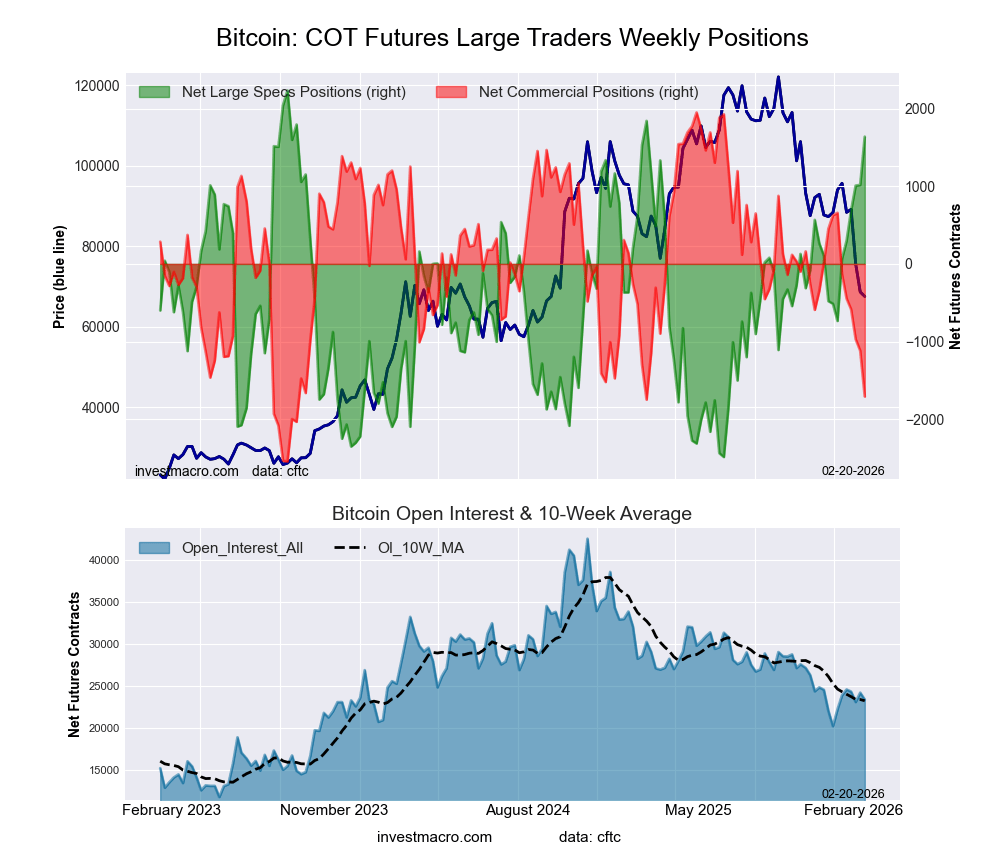
Bitcoin Futures:

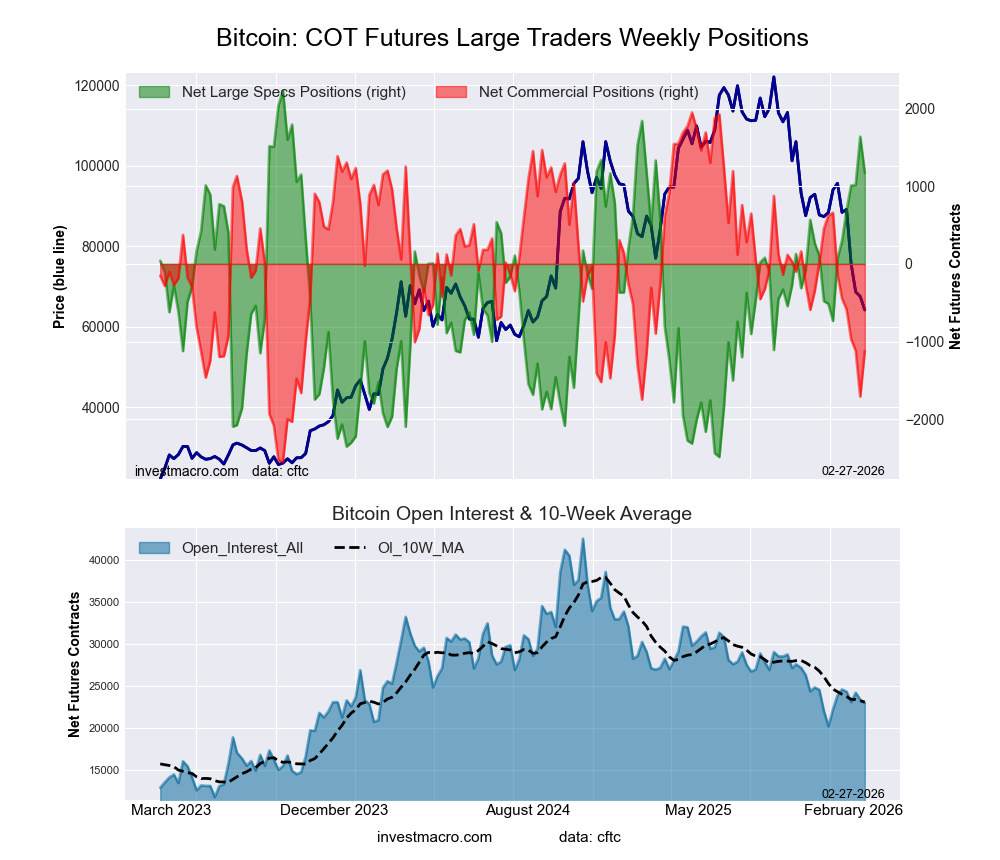
Bitcoin Crypto Futures COT ChartThe Bitcoin large speculator standing this week recorded a net position of 1,008 contracts in the data reported through Tuesday. This was a weekly lift of 318 contracts from the previous week which had a total of 690 net contracts.

This week’s current strength score (the trader positioning range over the past three years, measured from 0 to 100) shows the speculators are currently Bullish with a score of 74.1 percent. The commercials are Bearish with a score of 35.1 percent and the small traders (not shown in chart) are Bearish with a score of 35.3 percent.

Price Trend-Following Model: Strong Downtrend

Our weekly trend-following model classifies the current market price position as: Strong Downtrend.

BITCOIN StatisticsSPECULATORSCOMMERCIALSSMALL TRADERS
– Percent of Open Interest Longs:82.22.35.0
– Percent of Open Interest Shorts:77.86.55.2
– Net Position:1,008-968-40
– Gross Longs:18,9395211,151
– Gross Shorts:17,9311,4891,191
– Long to Short Ratio:1.1 to 10.3 to 11.0 to 1
NET POSITION TREND:
– Strength Index Score (3 Year Range Pct):74.135.135.3
– Strength Index Reading (3 Year Range):BullishBearishBearish
NET POSITION MOVEMENT INDEX:
– 6-Week Change in Strength Index:31.5-31.6-3.4


Article By InvestMacroReceive our weekly COT Newsletter

*COT Report: The COT data, released weekly to the public each Friday, is updated through the most recent Tuesday (data is 3 days old) and shows a quick view of how large speculators or non-commercials (for-profit traders) were positioned in the futures markets.

The CFTC categorizes trader positions according to commercial hedgers (traders who use futures contracts for hedging as part of the business), non-commercials (large traders who speculate to realize trading profits) and nonreportable traders (usually small traders/speculators) as well as their open interest (contracts open in the market at time of reporting). See CFTC criteria here.

GBP/USD Under Local Pressure: Focus on Bank of England Signals

By RoboForex Analytical Department

GBP/USD fell to 1.3627 on Thursday. Investors are awaiting the outcome of today’s Bank of England meeting.

UK interest rates are expected to decline throughout the year. However, the regulator is unlikely to provide clear signals about the timing and scale of easing, as it needs to wait for a clearer picture of inflation.

Additional pressure on the US dollar stems from the delay in the publication of key US labour market data due to the partial government shutdown. This increases uncertainty about the Fed’s future policy.

By the end of the year, global markets are pricing in around 35 basis points of Bank of England easing – one 25 bp cut and a second cut priced with a probability of around 40%.

Political risks remain in the UK. Investor attention is focused on the by-elections in Gorton and Denton County on 26 February, alongside the May local elections. Pollsters show a rise in support for the Reform UK party. It is ahead of both Prime Minister Keir Starmer’s Labour Party and Kemi Badenoch’s Conservatives, despite the general election not being scheduled until 2029.

Technical Analysis

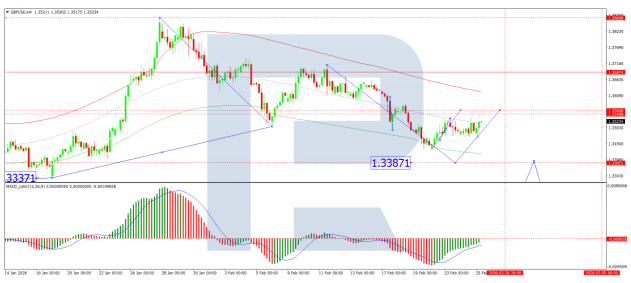
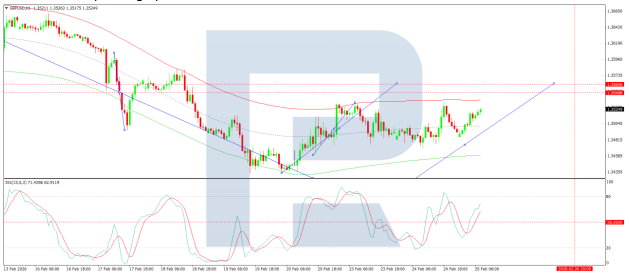
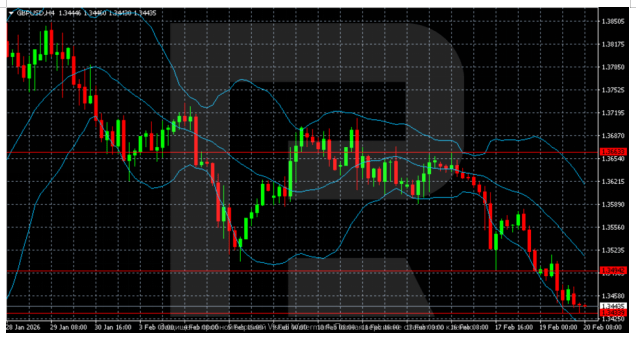
On the H4 chart, after a sharp rally in the second half of January and a fresh high in the 1.3850–1.3880 zone, GBP/USD entered a correction phase. The price has turned down from the upper end of the Bollinger Bands and is now testing the 1.3620–1.3650 support area. Upward momentum has weakened, leaving the structure short-term neutral-to-bearish. At the same time, the broader upward context has not yet been breached.

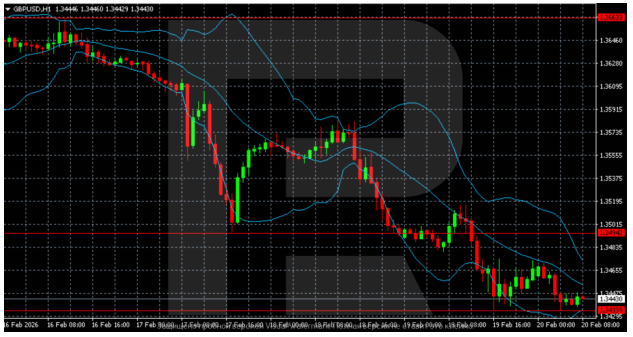
On the lower H1 chart, a descending corrective channel has formed. The price is consistently posting lower lows and remains near the lower Bollinger Bands. Selling pressure persists, with the nearest support at 1.3520–1.3550. To stabilise, the market would need a return above the 1.3660–1.3700 zone.

Conclusion

In summary, GBP/USD is experiencing a tactical pullback driven by pre-BoE caution and delayed US data, which is creating a temporary dollar squeeze. The technical correction appears orderly and is testing key support within a larger bullish structure. The near-term trajectory hinges almost entirely on the Bank of England’s tone today: any dovish hints could extend the correction towards 1.3520, while a neutral or hawkish hold could trigger a recovery attempt. Political uncertainty in the UK adds a layer of medium-term risk, but for now, the primary focus remains on monetary policy signals and the defence of the 1.3620 support zone.


Disclaimer

Any forecasts contained herein are based on the author’s particular opinion. This analysis may not be treated as trading advice. RoboForex bears no responsibility for trading results based on trading recommendations and reviews contained herein.

USDJPY Realises Correction: BOJ Policy Weighs on Yen

By RoboForex Analytical Department

USDJPY rose to 154.98 on Monday, with the yen continuing to fall. Pressure on the currency increased after statements by Japanese Prime Minister Sanae Takaichi. Over the weekend, the politician noted that a weak yen could be a significant advantage for export industries, indicating that Takaichi continues to favour a softer exchange rate. She later clarified that her comments concerned the need to build an economy resistant to currency fluctuations.

On Friday, the yen lost about 1% against the dollar after US President Donald Trump nominated Kevin Warsh as the next Fed chairman. The market regarded this choice as more “hawkish”, supporting the dollar and adding to the pressure on the yen.

An additional factor of uncertainty remains the upcoming extraordinary vote in the lower house of parliament on 8 February. Takaichi’s ruling party is expected to strengthen its position and advance expansive fiscal policies, increasing the risk of higher borrowing. Against this background, both Japanese government bonds and the yen were under pressure last month.

Expectations of fiscal stimulus and discussion of tax breaks increase the burden on public finances and restrain demand for the national currency.

Technical Analysis

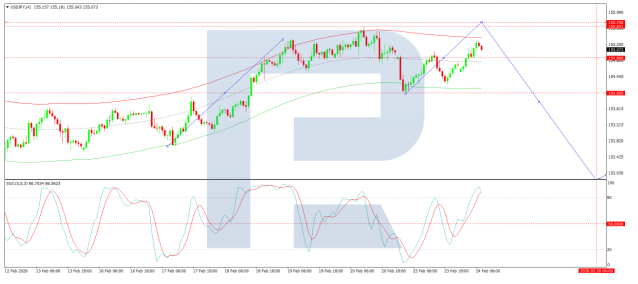
On the H4 chart, a corrective rebound follows after a sharp drop from the 158.50–159.00 area. The price recovered from a low in the 152.00 zone and is testing the 155.50 area, but remains below medium-term resistance. The structure still looks corrective inside the broader downward phase until the quotes settle above 156.50–157.00.

The H1 chart shows that after a sharp decline, the pair entered a recovery phase and has been sequentially updating local maxima. The price climbed above the 153.26–153.88 zone and is trading along the upper end of the Bollinger Bands, indicating continued near-term momentum. A slowdown is observed near the 155.50–155.60 level, with a possible pause or pullback within the ongoing correction.

Conclusion

In summary, the USDJPY rebound is primarily a technical correction within a broader bearish context for the yen. The move is exacerbated by political commentary favouring a weaker currency and reinforced by a hawkish Fed appointment. While near-term momentum persists, the pair faces significant resistance ahead. The fundamental backdrop of anticipated expansive fiscal policy in Japan continues to apply structural pressure on the yen, suggesting the current recovery may be limited in scope before the larger downtrend potentially resumes.


Disclaimer

Any forecasts contained herein are based on the author’s particular opinion. This analysis may not be treated as trading advice. RoboForex bears no responsibility for trading results based on trading recommendations and reviews contained herein.

Australian Dollar Speculator bets go bullish for 1st time in 59 Weeks

By InvestMacro

Speculators OI FX Futures COT Chart

Here are the latest charts and statistics for the Commitment of Traders (COT) data published by the Commodities Futures Trading Commission (CFTC).

The latest COT data is updated through Tuesday January 27th and shows a quick view of how large market participants (for-profit speculators and commercial traders) were positioned in the futures markets. All currency positions are in direct relation to the US dollar where, for example, a bet for the euro is a bet that the euro will rise versus the dollar while a bet against the euro will be a bet that the euro will decline versus the dollar.

Weekly Speculator Changes led by Canadian Dollar, Australian Dollar & Euro

Speculators Nets FX Futures COT Chart
The COT currency market speculator bets were overall decisively higher this week as ten out of the eleven currency markets we cover had higher positioning while the other one markets had lower speculator contracts.

Leading the gains for the currency markets was the Canadian Dollar (25,739 contracts) with the Australian Dollar (21,157 contracts), the EuroFX (20,439 contracts), the Japanese Yen (10,896 contracts), the British Pound (5,818 contracts), the US Dollar Index (2,013 contracts), the New Zealand Dollar (1,865 contracts), the Brazilian Real (1,204 contracts), Bitcoin (392 contracts),  and with the Swiss Franc (314 contracts) also showing positive weeks.

The only currency seeing a decline in speculator bets on the week was the Mexican Peso with a decrease of -4,039 contracts.

NZD leads Price Performance Returns for FX this week

In the currency markets this week, the New Zealand Dollar saw the biggest rise on the week with a 1.25% gain in the past five days. The Swiss Franc was higher by 1.12%, followed by the Australian Dollar which rose by 1.01%. The Japanese Yen came in next with a 0.67% rise, followed by the Canadian Dollar which increased by 0.60% on the week, while the Brazilian Real was up by 0.59%. The British Pound also saw a small gain this week with a 0.34% rise, and the Euro rounds out the gainers with a 0.27% increase.

On the downside, the US Dollar Index was virtually unchanged with a small decline of -0.22%, followed by the Mexican Peso which fell by -0.59%. Bitcoin was the biggest loser on the week with a -6.27% drop.

FX COT Data Roundup: Australian Dollar Speculator bets go bullish for 1st time in 59 Weeks

Highlighting this week’s currency speculated data was strong rises in speculative bets for the Canadian Dollar, the Australian Dollar and the Euro.

– The Canadian Dollar speculative bets surged the most this week by over 25,000 contracts. This is the second straight week of increases, as well as the seventh time out of the last nine weeks that bets have improved. Overall, the CAD speculator data have been highly negative, with bets being in bearish territory for the past 130 consecutive weeks, dating back to August 1st of 2023. But there has been a sharp turnaround since the end of 2025 as the bearish bets have fallen from a -130,600 on December 9th to this week’s speculative standing at just -16,046 contracts. This is the least bearish position for the Canadian Dollar speculators since February of 2024. In the exchange rate markets, the CAD trades right around the exchange rate of 0.7373 to close out this week. This roughly coincides with the 200-weekly moving average and a close above the 200-weekly moving average would be the first time the Canadian Dollar has been above this measure since August of 2022.

– The Australian Dollar speculative bets jumped by over 21,000 contracts this week and rose for the ninth consecutive week. In these past nine weeks, the speculator bets have increased by a total of 91,322 net contracts. The positive trend in speculator bets has now pushed the Australian Dollar net standing into a bullish position at 7,146 net contracts which marks the first bullish level for the Australian Dollar in the past 59 weeks, dating back to December 10th of 2024. In the exchange rate markets, the Australian Dollar has had two strong consecutive weekly gains, and this week the AUD touched its highest level (vs the USD) since January of 2023. Overall, the Australian Dollar exchange rate versus the USD has now been above its 200-weekly moving average for the past six weeks, which is the first time it has been multiple weeks over the 200-moving average since 2022.

– The Euro currency speculator position saw a rebound by over 20,000 net contracts this week after falling sharply in the previous two weeks. This week’s gain brings the overall net position level back to 132,134 net contracts, which is right around the average of the past 10 weeks. Overall, this is a strong, bullish position for speculators looking for the euro currency to continue to rise higher. Euro bets have now been in a consecutive net bullish position for 47 straight weeks, dating back to March 11th of 2025. And to illustrate the strength of the speculator sentiment, the Euro position has now been over the +100,000 net contract level for 29 out of the last 33 weeks. In the foreign exchange markets this week, the Euro briefly touched its highest level since June of 2021 at over the 1.2100 exchange rate. However, the Euro faltered to end the week with a few down days in a row and closed out trading at the 1.1893 exchange rate versus the US Dollar. Since the beginning of 2025, the Euro was now higher by approximately 16.5% and is up by just about 1% this month, ending January 31st.

– The US Dollar Index speculative bets rose this week after a decline last week, and have actually been higher in eight out of the last nine weeks. Overall, the US Dollar Index speculative positions have now been in a negative net standing for 33 consecutive weeks, dating back to June of 2025. In the exchange rate markets, the Dollar fell by a modest amount this week. And despite touching its lowest level since 2022 around the 95.36 exchange rate, the Dollar Index rallied at the end of the week to close out around the 96.86 price level. Likely helping the US Dollar strength on Friday was a steep sell-off in the precious metals markets to close out the week while also affecting the USD (and going forward) was the announcement of a nomination of a new Federal Reserve Chairman in Kevin Warsh.


Currencies Data:

Speculators FX Futures COT Data Table
Legend: Open Interest | Speculators Current Net Position | Weekly Specs Change | Specs Strength Score compared to last 3-Years (0-100 range)


Strength Scores led by Canadian Dollar & Australian Dollar

Speculators Strength Scores FX Futures COT Chart
COT Strength Scores (a normalized measure of Speculator positions over a 3-Year range, from 0 to 100 where above 80 is Extreme-Bullish and below 20 is Extreme-Bearish) showed that the Canadian Dollar (89 percent) and the Australian Dollar (81 percent) lead the currency markets this week. The Mexican Peso (80 percent), EuroFX (79 percent) and Bitcoin (67 percent) come in as the next highest in the weekly strength scores.

On the downside, the New Zealand Dollar (10 percent) and the Swiss Franc (14 percent) come in at the lowest strength levels currently and are in Extreme-Bearish territory (below 20 percent). The next lowest strength scores are the US Dollar Index (32 percent) and the British Pound (33 percent).

3-Year Strength Statistics:
US Dollar Index (32.2 percent) vs US Dollar Index previous week (26.8 percent)
EuroFX (79.1 percent) vs EuroFX previous week (71.3 percent)
British Pound Sterling (32.7 percent) vs British Pound Sterling previous week (30.3 percent)
Japanese Yen (41.4 percent) vs Japanese Yen previous week (38.4 percent)
Swiss Franc (14.0 percent) vs Swiss Franc previous week (13.3 percent)
Canadian Dollar (88.9 percent) vs Canadian Dollar previous week (76.2 percent)
Australian Dollar (81.4 percent) vs Australian Dollar previous week (66.4 percent)
New Zealand Dollar (10.3 percent) vs New Zealand Dollar previous week (8.2 percent)
Mexican Peso (80.1 percent) vs Mexican Peso previous week (82.3 percent)
Brazilian Real (53.6 percent) vs Brazilian Real previous week (52.8 percent)
Bitcoin (67.3 percent) vs Bitcoin previous week (59.0 percent)


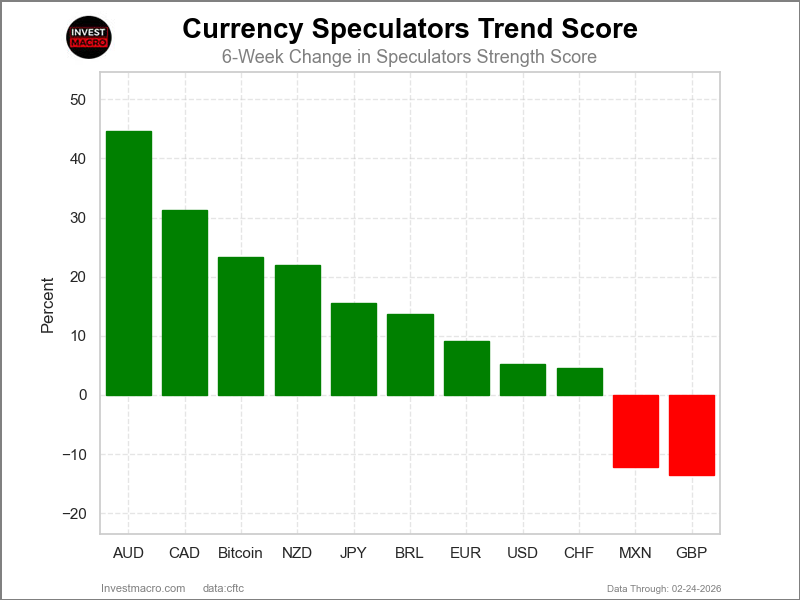
Canadian Dollar & Australian Dollar top the 6-Week Strength Trends
Speculators Trends FX Futures COT Chart
COT Strength Score Trends (or move index, calculates the 6-week changes in strength scores) showed that the Canadian Dollar (35 percent) and the Australian Dollar (21 percent) lead the past six weeks trends for the currencies. The British Pound (14 percent), Bitcoin (12 percent) and the Mexican Peso (9 percent) are the next highest positive movers in the 3-Year trends data.

The Brazilian Real (-21 percent) leads the downside trend scores currently with the Japanese Yen (-9 percent), Swiss Franc (-8 percent) and the EuroFX (-5 percent) following next with lower trend scores.

3-Year Strength Trends:
US Dollar Index (0.5 percent) vs US Dollar Index previous week (20.1 percent)
EuroFX (-4.9 percent) vs EuroFX previous week (-10.3 percent)
British Pound Sterling (13.7 percent) vs British Pound Sterling previous week (22.7 percent)
Japanese Yen (-8.5 percent) vs Japanese Yen previous week (-17.1 percent)
Swiss Franc (-8.1 percent) vs Swiss Franc previous week (-9.3 percent)
Canadian Dollar (34.8 percent) vs Canadian Dollar previous week (43.8 percent)
Australian Dollar (20.6 percent) vs Australian Dollar previous week (34.7 percent)
New Zealand Dollar (0.3 percent) vs New Zealand Dollar previous week (8.2 percent)
Mexican Peso (8.7 percent) vs Mexican Peso previous week (0.1 percent)
Brazilian Real (-21.2 percent) vs Brazilian Real previous week (-29.0 percent)
Bitcoin (12.4 percent) vs Bitcoin previous week (0.7 percent)


Individual COT Forex Markets:

US Dollar Index Futures:
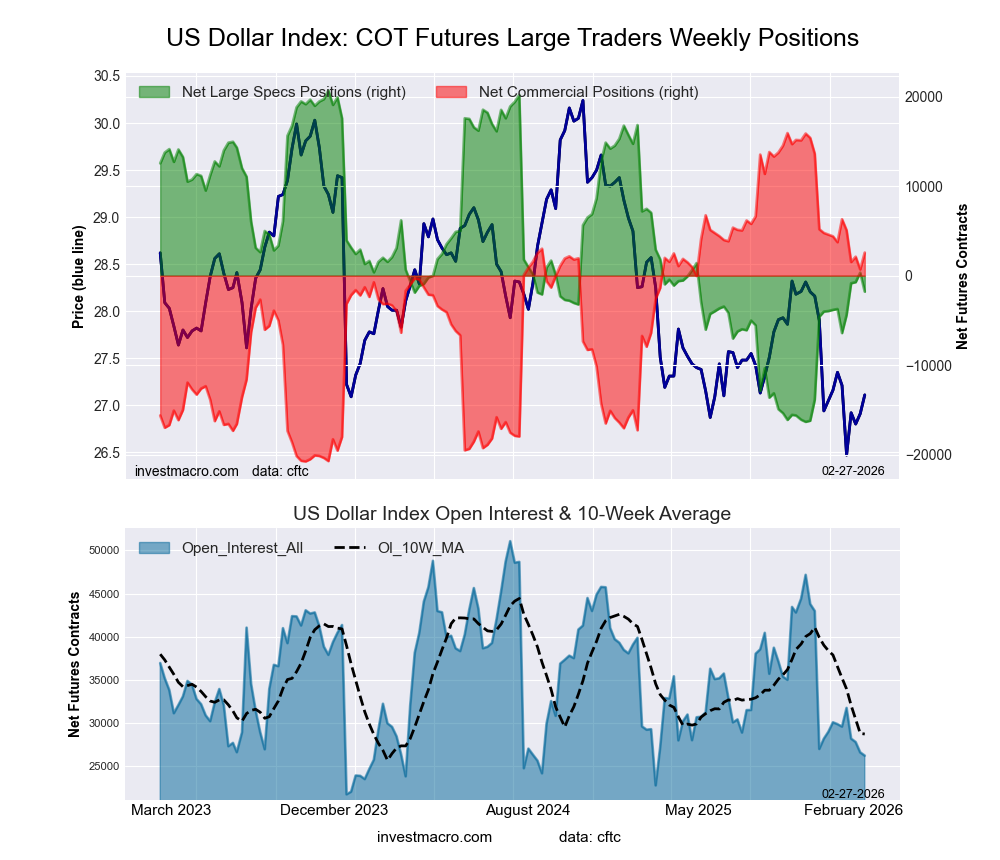
US Dollar Index Forex Futures COT ChartThe US Dollar Index large speculator standing this week equaled a net position of -4,405 contracts in the data reported through Tuesday. This was a weekly lift of 2,013 contracts from the previous week which had a total of -6,418 net contracts.

This week’s current strength score (the trader positioning range over the past three years, measured from 0 to 100) shows the speculators are currently Bearish with a score of 32.2 percent. The commercials are Bullish with a score of 70.4 percent and the small traders (not shown in chart) are Bearish with a score of 23.2 percent.

Price Trend-Following Model: Strong Downtrend

Our weekly trend-following model classifies the current market price position as: Strong Downtrend.

US DOLLAR INDEX StatisticsSPECULATORSCOMMERCIALSSMALL TRADERS
– Percent of Open Interest Longs:56.528.98.9
– Percent of Open Interest Shorts:70.412.811.1
– Net Position:-4,4055,087-682
– Gross Longs:17,9459,1632,838
– Gross Shorts:22,3504,0763,520
– Long to Short Ratio:0.8 to 12.2 to 10.8 to 1
NET POSITION TREND:
– Strength Index Score (3 Year Range Pct):32.270.423.2
– Strength Index Reading (3 Year Range):BearishBullishBearish
NET POSITION MOVEMENT INDEX:
– 6-Week Change in Strength Index:0.5-0.3-1.3


Euro Currency Futures:

Euro Currency Futures COT ChartThe Euro Currency large speculator standing this week equaled a net position of 132,134 contracts in the data reported through Tuesday. This was a weekly gain of 20,439 contracts from the previous week which had a total of 111,695 net contracts.

This week’s current strength score (the trader positioning range over the past three years, measured from 0 to 100) shows the speculators are currently Bullish with a score of 79.1 percent. The commercials are Bearish-Extreme with a score of 19.3 percent and the small traders (not shown in chart) are Bullish with a score of 78.9 percent.

Price Trend-Following Model: Strong Uptrend

Our weekly trend-following model classifies the current market price position as: Strong Uptrend.

EURO Currency StatisticsSPECULATORSCOMMERCIALSSMALL TRADERS
– Percent of Open Interest Longs:31.654.410.2
– Percent of Open Interest Shorts:17.274.14.9
– Net Position:132,134-181,60449,470
– Gross Longs:290,336499,73294,116
– Gross Shorts:158,202681,33644,646
– Long to Short Ratio:1.8 to 10.7 to 12.1 to 1
NET POSITION TREND:
– Strength Index Score (3 Year Range Pct):79.119.378.9
– Strength Index Reading (3 Year Range):BullishBearish-ExtremeBullish
NET POSITION MOVEMENT INDEX:
– 6-Week Change in Strength Index:-4.94.9-3.6


British Pound Sterling Futures:

British Pound Sterling Futures COT ChartThe British Pound Sterling large speculator standing this week equaled a net position of -16,162 contracts in the data reported through Tuesday. This was a weekly rise of 5,818 contracts from the previous week which had a total of -21,980 net contracts.

This week’s current strength score (the trader positioning range over the past three years, measured from 0 to 100) shows the speculators are currently Bearish with a score of 32.7 percent. The commercials are Bullish with a score of 62.3 percent and the small traders (not shown in chart) are Bullish-Extreme with a score of 81.1 percent.

Price Trend-Following Model: Strong Uptrend

Our weekly trend-following model classifies the current market price position as: Strong Uptrend.

BRITISH POUND StatisticsSPECULATORSCOMMERCIALSSMALL TRADERS
– Percent of Open Interest Longs:39.143.316.3
– Percent of Open Interest Shorts:46.340.911.5
– Net Position:-16,1625,46410,698
– Gross Longs:87,78697,21636,620
– Gross Shorts:103,94891,75225,922
– Long to Short Ratio:0.8 to 11.1 to 11.4 to 1
NET POSITION TREND:
– Strength Index Score (3 Year Range Pct):32.762.381.1
– Strength Index Reading (3 Year Range):BearishBullishBullish-Extreme
NET POSITION MOVEMENT INDEX:
– 6-Week Change in Strength Index:13.7-17.532.8


Japanese Yen Futures:

Japanese Yen Forex Futures COT ChartThe Japanese Yen large speculator standing this week equaled a net position of -33,933 contracts in the data reported through Tuesday. This was a weekly boost of 10,896 contracts from the previous week which had a total of -44,829 net contracts.

This week’s current strength score (the trader positioning range over the past three years, measured from 0 to 100) shows the speculators are currently Bearish with a score of 41.4 percent. The commercials are Bullish with a score of 57.7 percent and the small traders (not shown in chart) are Bullish with a score of 55.5 percent.

Price Trend-Following Model: Downtrend

Our weekly trend-following model classifies the current market price position as: Downtrend.

JAPANESE YEN StatisticsSPECULATORSCOMMERCIALSSMALL TRADERS
– Percent of Open Interest Longs:34.741.614.2
– Percent of Open Interest Shorts:46.032.711.8
– Net Position:-33,93326,7097,224
– Gross Longs:104,460125,15742,786
– Gross Shorts:138,39398,44835,562
– Long to Short Ratio:0.8 to 11.3 to 11.2 to 1
NET POSITION TREND:
– Strength Index Score (3 Year Range Pct):41.457.755.5
– Strength Index Reading (3 Year Range):BearishBullishBullish
NET POSITION MOVEMENT INDEX:
– 6-Week Change in Strength Index:-8.57.9-1.2


Swiss Franc Futures:

Swiss Franc Forex Futures COT ChartThe Swiss Franc large speculator standing this week equaled a net position of -42,893 contracts in the data reported through Tuesday. This was a weekly lift of 314 contracts from the previous week which had a total of -43,207 net contracts.

This week’s current strength score (the trader positioning range over the past three years, measured from 0 to 100) shows the speculators are currently Bearish-Extreme with a score of 14.0 percent. The commercials are Bullish with a score of 68.6 percent and the small traders (not shown in chart) are Bullish-Extreme with a score of 80.8 percent.

Price Trend-Following Model: Strong Uptrend

Our weekly trend-following model classifies the current market price position as: Strong Uptrend.

SWISS FRANC StatisticsSPECULATORSCOMMERCIALSSMALL TRADERS
– Percent of Open Interest Longs:10.170.519.3
– Percent of Open Interest Shorts:54.726.418.8
– Net Position:-42,89342,406487
– Gross Longs:9,72467,80518,510
– Gross Shorts:52,61725,39918,023
– Long to Short Ratio:0.2 to 12.7 to 11.0 to 1
NET POSITION TREND:
– Strength Index Score (3 Year Range Pct):14.068.680.8
– Strength Index Reading (3 Year Range):Bearish-ExtremeBullishBullish-Extreme
NET POSITION MOVEMENT INDEX:
– 6-Week Change in Strength Index:-8.13.38.3


Canadian Dollar Futures:

Canadian Dollar Forex Futures COT ChartThe Canadian Dollar large speculator standing this week equaled a net position of -16,046 contracts in the data reported through Tuesday. This was a weekly advance of 25,739 contracts from the previous week which had a total of -41,785 net contracts.

This week’s current strength score (the trader positioning range over the past three years, measured from 0 to 100) shows the speculators are currently Bullish-Extreme with a score of 88.9 percent. The commercials are Bearish-Extreme with a score of 16.3 percent and the small traders (not shown in chart) are Bullish with a score of 51.8 percent.

Price Trend-Following Model: Strong Uptrend

Our weekly trend-following model classifies the current market price position as: Strong Uptrend.

CANADIAN DOLLAR StatisticsSPECULATORSCOMMERCIALSSMALL TRADERS
– Percent of Open Interest Longs:34.052.212.6
– Percent of Open Interest Shorts:41.046.111.5
– Net Position:-16,04613,7342,312
– Gross Longs:77,169118,53928,551
– Gross Shorts:93,215104,80526,239
– Long to Short Ratio:0.8 to 11.1 to 11.1 to 1
NET POSITION TREND:
– Strength Index Score (3 Year Range Pct):88.916.351.8
– Strength Index Reading (3 Year Range):Bullish-ExtremeBearish-ExtremeBullish
NET POSITION MOVEMENT INDEX:
– 6-Week Change in Strength Index:34.8-34.622.1


Australian Dollar Futures:

Australian Dollar Forex Futures COT ChartThe Australian Dollar large speculator standing this week equaled a net position of 7,146 contracts in the data reported through Tuesday. This was a weekly boost of 21,157 contracts from the previous week which had a total of -14,011 net contracts.

This week’s current strength score (the trader positioning range over the past three years, measured from 0 to 100) shows the speculators are currently Bullish-Extreme with a score of 81.4 percent. The commercials are Bearish-Extreme with a score of 13.1 percent and the small traders (not shown in chart) are Bullish-Extreme with a score of 89.6 percent.

Price Trend-Following Model: Strong Uptrend

Our weekly trend-following model classifies the current market price position as: Strong Uptrend.

AUSTRALIAN DOLLAR StatisticsSPECULATORSCOMMERCIALSSMALL TRADERS
– Percent of Open Interest Longs:43.639.716.1
– Percent of Open Interest Shorts:40.750.97.7
– Net Position:7,146-28,30921,163
– Gross Longs:109,806100,02640,630
– Gross Shorts:102,660128,33519,467
– Long to Short Ratio:1.1 to 10.8 to 12.1 to 1
NET POSITION TREND:
– Strength Index Score (3 Year Range Pct):81.413.189.6
– Strength Index Reading (3 Year Range):Bullish-ExtremeBearish-ExtremeBullish-Extreme
NET POSITION MOVEMENT INDEX:
– 6-Week Change in Strength Index:20.6-17.81.9


New Zealand Dollar Futures:

New Zealand Dollar Forex Futures COT ChartThe New Zealand Dollar large speculator standing this week equaled a net position of -47,745 contracts in the data reported through Tuesday. This was a weekly increase of 1,865 contracts from the previous week which had a total of -49,610 net contracts.

This week’s current strength score (the trader positioning range over the past three years, measured from 0 to 100) shows the speculators are currently Bearish-Extreme with a score of 10.3 percent. The commercials are Bullish-Extreme with a score of 89.1 percent and the small traders (not shown in chart) are Bearish with a score of 37.7 percent.

Price Trend-Following Model: Strong Uptrend

Our weekly trend-following model classifies the current market price position as: Strong Uptrend.

NEW ZEALAND DOLLAR StatisticsSPECULATORSCOMMERCIALSSMALL TRADERS
– Percent of Open Interest Longs:14.180.84.3
– Percent of Open Interest Shorts:69.923.65.6
– Net Position:-47,74548,868-1,123
– Gross Longs:12,07469,0853,655
– Gross Shorts:59,81920,2174,778
– Long to Short Ratio:0.2 to 13.4 to 10.8 to 1
NET POSITION TREND:
– Strength Index Score (3 Year Range Pct):10.389.137.7
– Strength Index Reading (3 Year Range):Bearish-ExtremeBullish-ExtremeBearish
NET POSITION MOVEMENT INDEX:
– 6-Week Change in Strength Index:0.3-0.41.2


Mexican Peso Futures:

Mexican Peso Futures COT ChartThe Mexican Peso large speculator standing this week equaled a net position of 103,114 contracts in the data reported through Tuesday. This was a weekly fall of -4,039 contracts from the previous week which had a total of 107,153 net contracts.

This week’s current strength score (the trader positioning range over the past three years, measured from 0 to 100) shows the speculators are currently Bullish-Extreme with a score of 80.1 percent. The commercials are Bearish with a score of 20.1 percent and the small traders (not shown in chart) are Bearish with a score of 46.2 percent.

Price Trend-Following Model: Strong Uptrend

Our weekly trend-following model classifies the current market price position as: Strong Uptrend.

MEXICAN PESO StatisticsSPECULATORSCOMMERCIALSSMALL TRADERS
– Percent of Open Interest Longs:62.733.63.1
– Percent of Open Interest Shorts:19.378.71.3
– Net Position:103,114-107,3494,235
– Gross Longs:149,09479,8277,389
– Gross Shorts:45,980187,1763,154
– Long to Short Ratio:3.2 to 10.4 to 12.3 to 1
NET POSITION TREND:
– Strength Index Score (3 Year Range Pct):80.120.146.2
– Strength Index Reading (3 Year Range):Bullish-ExtremeBearishBearish
NET POSITION MOVEMENT INDEX:
– 6-Week Change in Strength Index:8.7-8.5-2.2


Brazilian Real Futures:

Brazil Real Futures COT ChartThe Brazilian Real large speculator standing this week equaled a net position of 18,845 contracts in the data reported through Tuesday. This was a weekly advance of 1,204 contracts from the previous week which had a total of 17,641 net contracts.

This week’s current strength score (the trader positioning range over the past three years, measured from 0 to 100) shows the speculators are currently Bullish with a score of 53.6 percent. The commercials are Bearish with a score of 45.0 percent and the small traders (not shown in chart) are Bearish with a score of 42.7 percent.

Price Trend-Following Model: Weak Downtrend

Our weekly trend-following model classifies the current market price position as: Weak Downtrend.

BRAZIL REAL StatisticsSPECULATORSCOMMERCIALSSMALL TRADERS
– Percent of Open Interest Longs:46.541.94.1
– Percent of Open Interest Shorts:30.960.70.9
– Net Position:18,845-22,7263,881
– Gross Longs:56,02750,4354,917
– Gross Shorts:37,18273,1611,036
– Long to Short Ratio:1.5 to 10.7 to 14.7 to 1
NET POSITION TREND:
– Strength Index Score (3 Year Range Pct):53.645.042.7
– Strength Index Reading (3 Year Range):BullishBearishBearish
NET POSITION MOVEMENT INDEX:
– 6-Week Change in Strength Index:-21.220.15.9


Bitcoin Futures:

Bitcoin Crypto Futures COT ChartThe Bitcoin large speculator standing this week equaled a net position of 690 contracts in the data reported through Tuesday. This was a weekly lift of 392 contracts from the previous week which had a total of 298 net contracts.

This week’s current strength score (the trader positioning range over the past three years, measured from 0 to 100) shows the speculators are currently Bullish with a score of 67.3 percent. The commercials are Bearish with a score of 43.6 percent and the small traders (not shown in chart) are Bearish with a score of 31.9 percent.

Price Trend-Following Model: Downtrend

Our weekly trend-following model classifies the current market price position as: Downtrend.

BITCOIN StatisticsSPECULATORSCOMMERCIALSSMALL TRADERS
– Percent of Open Interest Longs:74.43.65.0
– Percent of Open Interest Shorts:71.56.05.4
– Net Position:690-585-105
– Gross Longs:18,0548751,206
– Gross Shorts:17,3641,4601,311
– Long to Short Ratio:1.0 to 10.6 to 10.9 to 1
NET POSITION TREND:
– Strength Index Score (3 Year Range Pct):67.343.631.9
– Strength Index Reading (3 Year Range):BullishBearishBearish
NET POSITION MOVEMENT INDEX:
– 6-Week Change in Strength Index:12.4-13.41.0


Article By InvestMacroReceive our weekly COT Newsletter

*COT Report: The COT data, released weekly to the public each Friday, is updated through the most recent Tuesday (data is 3 days old) and shows a quick view of how large speculators or non-commercials (for-profit traders) were positioned in the futures markets.

The CFTC categorizes trader positions according to commercial hedgers (traders who use futures contracts for hedging as part of the business), non-commercials (large traders who speculate to realize trading profits) and nonreportable traders (usually small traders/speculators) as well as their open interest (contracts open in the market at time of reporting). See CFTC criteria here.

EUR/USD Moves Away from High but Remains Strong

By RoboForex Analytical Department

EUR/USD fell to 1.1919 on Friday.  Despite this movement, the week ends with the US dollar experiencing its second consecutive decline. Pressure on the USD is driven by heightened geopolitical tensions and uncertainty about economic policy in Washington, which is reducing investor confidence in the dollar.

The focus is on recent statements by US President Donald Trump. He threatened tariffs against countries supplying oil to Cuba and also warned Iran of possible military strikes if it refused to sign a nuclear agreement. An additional source of uncertainty was Trump’s promise to announce the candidacy of a new Fed chair on Friday morning, following sustained pressure on Jerome Powell to cut rates more aggressively.

In parallel, the White House and Senate Democrats reached a preliminary agreement that avoids a government shutdown. This partially reduced short-term fiscal risks.

Earlier in the week, the dollar fell to levels not seen in almost four years after Trump expressed no concern about its weakening. Later, the US currency was supported by statements from US Treasury Secretary Scott Bessent, who remains committed to a strong dollar policy.

Technical Analysis

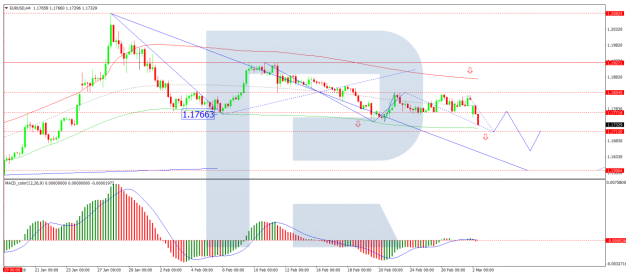
On the H4 chart, EUR/USD has formed a wave of growth towards 1.2080. A repeated breakdown of this resistance level may signal a continuation of the uptrend. At this stage, the pair is continuing the correction wave towards the support level of 1.1875. Technically, the correction scenario is confirmed by the MACD indicator, with its histogram and signal line both above zero, forming a downward wave. Upon completion of the correction, we anticipate the uptrend continuing towards 1.2045 and subsequently to 1.2200, with possible corrections along the way.

On the H1 chart, the pair is forming a correction after testing the resistance level. A rebound from the support level of 1.1860 would signal the formation of a new growth wave. The Stochastic oscillator’s signal lines are pointing towards level 80, suggesting the uptrend may continue. Subsequently, the target for growth may be 1.2045.

Conclusion

In summary, while the EUR/USD pair has experienced a corrective pullback, the fundamental backdrop of geopolitical tensions and policy uncertainty continues to weigh on the US dollar, underpinning the euro’s relative strength. Technically, the correction appears poised to complete near key support levels, with indicators on both the H4 and H1 timeframes suggesting a high probability of resuming the prevailing upward trend. The overall bias remains bullish for a potential test of higher resistance zones.


Disclaimer

Any forecasts contained herein are based on the author’s particular opinion. This analysis may not be treated as trading advice. RoboForex bears no responsibility for trading results based on trading recommendations and reviews contained herein.

EUR/USD Updates Four-Year High: Everything Works Against the US Dollar

By RoboForex Analytical Department

EUR/USD reached 1.2000 on Wednesday after rising to 1.2082 the previous evening, marking a strong four-day rally. The pressure on the US dollar has intensified following comments from US President Donald Trump. He stated that he was not concerned about the weakening of the dollar, viewing its fall as moderate. The market interpreted this as a signal that the administration might be willing to tolerate a weaker dollar to enhance export competitiveness.

An additional blow to the dollar came from rising political uncertainty in Washington, with Trump making fresh statements about Greenland and continuing to criticise the US Federal Reserve’s independence.

Further compounding the dollar’s decline is growing speculation about a potential joint US-Japan currency intervention to support the yen, which has boosted demand for JPY.

Investors’ focus is on the Federal Reserve’s decision, due later tonight. The Fed is widely expected to maintain its current interest rate, but much attention is on potential signals regarding the timing of future rate cuts. Current expectations suggest two 25-basis-point cuts by the end of the year.

Technical Analysis

On the H4 chart, EUR/USD has formed an upward wave towards 1.2080. A breakout above this resistance level would signal a continuation of the bullish trend. For now, the pair is in a corrective phase, with support around 1.1935. The correction is confirmed by the MACD indicator, which shows the histogram and signal line above zero and forming a downward wave. After the correction, the upward trend may resume towards 1.2100 and potentially 1.2200, though corrections could occur during the rise.

On the H1 chart, after testing resistance, EUR/USD is forming a correction. A rebound from support at 1.1935 would signal a continuation of the bullish wave. The Stochastic indicator’s signal lines are approaching the 20 level, suggesting that the correction may continue before resuming the upward trend. The next target for growth could be 1.2100.

Conclusion

The EUR/USD pair continues to show bullish momentum, supported by a weaker US dollar and rising geopolitical tensions. The ongoing correction might offer buying opportunities, with further growth likely towards 1.2100 and 1.2200, depending on the Fed’s upcoming decision and global market dynamics.


Disclaimer

Any forecasts contained herein are based on the author’s particular opinion. This analysis may not be treated as trading advice. RoboForex bears no responsibility for trading results based on trading recommendations and reviews contained herein.

USD/JPY on Pause: Yen Slows After Sharp Rally

By RoboForex Analytical Department

USD/JPY settled at 154.29 on Tuesday, with the yen pausing its rally after a notable surge of nearly 3.2% in the previous two sessions. This move was driven by growing concerns about a possible coordinated currency intervention between Japan and the US.

The market was boosted by news that the Federal Reserve Bank of New York had requested USD/JPY levels from dealers on Friday. At the same time, Japanese officials confirmed that they were in close communication with the US on currency policy and potential market actions.

However, Bank of Japan (BoJ) data suggested that the sharp yen appreciation on Friday was unlikely to be due to direct intervention. This speculation intensified the market’s reaction and speculative positioning.

The yen continued to receive support from the broader weakness of the US dollar, driven by rising geopolitical risks and trade uncertainties, as well as expectations that US President Donald Trump might replace Fed Chairman Jerome Powell with a softer candidate, further pressuring the US currency.

Technical Analysis

On the H4 chart, USD/JPY has formed a correction wave following the previous decline. A continuation of the growth wave to the 155.00 level is possible today. After this rise, a rebound from the resistance level is expected, with the first target for a further decline at 153.00, followed by 152.00. This scenario is confirmed by the MACD indicator, as the histogram is below zero and rising, with the signal line likely to cross the histogram and turn upwards soon.

On the H1 chart, USD/JPY is testing the 153.80 mark and forming a growth wave. If the price tests the 155.00 level and rebounds, further declines could be expected, with the first support at 153.00 USD. The Stochastic oscillator supports this, as its signal lines continue to decline towards the 50.0 level. A break of this level would signal a continuation of the downward trend.

Conclusion

USD/JPY has paused its rapid ascent amid speculation of potential currency intervention. Despite a weaker US dollar and geopolitical risks, the yen’s recent strength is being tested. Technically, while the immediate outlook points to a possible short-term rise to 155.00, a rebound and subsequent decline towards 153.00 could be on the horizon, depending on how market sentiment evolves.


Disclaimer

Any forecasts contained herein are based on the author’s particular opinion. This analysis may not be treated as trading advice. RoboForex bears no responsibility for trading results based on trading recommendations and reviews contained herein.

Currency Speculators boost Australian Dollar bets to 58-Week High

By InvestMacro

Speculators OI FX Futures COT Chart

Here are the latest charts and statistics for the Commitment of Traders (COT) data published by the Commodities Futures Trading Commission (CFTC).

The latest COT data is updated through Tuesday January 20th and shows a quick view of how large market participants (for-profit speculators and commercial traders) were positioned in the futures markets. All currency positions are in direct relation to the US dollar where, for example, a bet for the euro is a bet that the euro will rise versus the dollar while a bet against the euro will be a bet that the euro will decline versus the dollar.

Weekly Speculator Changes led by Australian Dollar & Mexican Peso

Speculators Nets FX Futures COT Chart
The COT currency market speculator bets were overall higher this week as seven out of the eleven currency markets we cover had higher positioning while the other four markets had lower speculator contracts.

Leading the gains for the currency markets was the Australian Dollar (4,835 contracts) with the Mexican Peso (3,595 contracts), the British Pound (3,290 contracts), the Canadian Dollar (465 contracts), the Japanese Yen (335 contracts), Bitcoin (229 contracts) and the Swiss Franc (185 contracts) also recording positive weeks.

The currencies seeing declines in speculator bets on the week were the EuroFX (-20,961 contracts), the US Dollar Index (-2,688 contracts), the New Zealand Dollar (-759 contracts) and with the Brazilian Real (-233 contracts) also registering lower bets on the week.

Highlighting the Currency Market Speculator Positions this week were the AUD, MXN, Euro & Dollar Index

The Australian Dollar speculative bets lead off the highlights this week as the AUD bets rose for an eighth consecutive week. Over this eight-week span, the Aussie Dollar speculative net position has improved by over 70,000 contracts. Despite that improvement, the Australian Dollar net position remains in bearish territory at -14,011 net positions at this time. This is actually the best standing for the Australian dollar speculative bets since all the way back to December of 2024, a span of 58 consecutive weeks that this currency has been in a bearish net position. The Australian Dollar, in the currency markets, has been on the rise and jumped this week by over 3%. It is now up by over 12% since January of 2025. Currently trading around 0.6887, the AUD is at its highest level since September of 2024 and with further upside momentum, we could see a challenge of the 0.70 significant psychological level soon.

Coming up next is the Mexican Peso, which saw speculator bets rise this week for the fourth time in the past five weeks, and for the tenth time over the past 14 weeks. The Peso has been in an overall bullish position for approximately one year now, dating back to January 21st of 2025. Peso positions have been gaining steadily over the past 52 weeks and have now been above the +100,000 net contract level for five consecutive weeks and for six out of the last seven weeks, indicating the strong sentiment for the MXN at this time. The Peso exchange rate is on a strong uptrend at the moment versus the US Dollar, and has seen a strong monthly gain to start the new year with gains in eight out of the last nine weeks. The MXN is now at the highest price level  since June of 2024 and is up by over 20% in the last 52 weeks.

The Euro common currency’s speculative bets fell sharply for a second consecutive week, and have now declined by over -50,000 contracts in just the past two weeks. However, the Euro has been in a super strong position and indicates a likely profit-taking dip as the net speculative contracts have been above the +100,000 net contract level for 28 out of the last 32 weeks, including for the last eight consecutive weeks. The Euro currency closed out this week above the 1.18 level in the forex market after hitting support last week and rebounding off of the 1.1620 area. What a difference a year makes as last January, the Euro currency was trading around just 1.0250. And since then, the currency has risen by about 15%. Time will tell if the Euro can break above the 1.1865 resistance area that has stopped its ascent multiple times since June.

The US Dollar Index position dropped this week by over -2,500 contracts after seeing seven straight weeks of gains previously. The US Dollar Index net positions have now been in an overall bearish level for the past 32 consecutive weeks, dating back to June of 2025. The Dollar Index price has been on a strong downtrend for the past year and this week closed under the 97.50 level with an almost 2% drop on the week.  Compared to last January, when this currency was trading around the 1.09 to 1.10 levels, USD Index is now currently lower by approximately 11%.

Currency Markets 5-Day Price Performance led by NZD & AUD

The best returning currency this week was the New Zealand Dollar which showed a 3.36% gain, while the Australian Dollar came in at a similar 3.13% rise over these past five days. The Swiss Franc was higher by 2.74%, followed by the British Pound with a 1.92% gain and the Euro with a 1.91% gain. The Brazilian Real was higher by 1.60%, while the Canadian Dollar was up by 1.59%. The Mexican Peso rose by 1.4%, and the Japanese Yen showed an increase by 1.45%.

On the downside, the US Dollar Index dropped by -1.90% over these past five days while Bitcoin saw the biggest decline with a -6.23% drop.

The leaders over the past 30 days are the Mexican Peso, with a gain of approximately 4% over that time, with a 3.8% rise, followed by the Australian Dollar, which is up by 3.45%. The Peso and the Australian Dollar also lead the past 90 days percent changes, with the Peso up by 5.7% over that time and the Australian Dollar higher by 4.26%.


Currencies Data:

Speculators FX Futures COT Data Table
Legend: Open Interest | Speculators Current Net Position | Weekly Specs Change | Specs Strength Score compared to last 3-Years (0-100 range)


Strength Scores led by Mexican Peso & Canadian Dollar

Speculators Strength Scores FX Futures COT Chart
COT Strength Scores (a normalized measure of Speculator positions over a 3-Year range, from 0 to 100 where above 80 is Extreme-Bullish and below 20 is Extreme-Bearish) showed that the Mexican Peso (82 percent) and the Canadian Dollar (76 percent) lead the currency markets this week. The EuroFX (71 percent), Australian Dollar (66 percent) and Bitcoin (59 percent) come in as the next highest in the weekly strength scores.

On the downside, the New Zealand Dollar (8 percent) and the Swiss Franc (13 percent) come in at the lowest strength levels currently and are in Extreme-Bearish territory (below 20 percent). The next lowest strength scores are the US Dollar Index (27 percent) and the British Pound (30 percent).

3-Year Strength Statistics:
US Dollar Index (26.8 percent) vs US Dollar Index previous week (34.1 percent)
EuroFX (71.3 percent) vs EuroFX previous week (79.3 percent)
British Pound Sterling (30.3 percent) vs British Pound Sterling previous week (28.9 percent)
Japanese Yen (38.4 percent) vs Japanese Yen previous week (38.3 percent)
Swiss Franc (13.3 percent) vs Swiss Franc previous week (13.0 percent)
Canadian Dollar (76.2 percent) vs Canadian Dollar previous week (76.0 percent)
Australian Dollar (66.4 percent) vs Australian Dollar previous week (62.9 percent)
New Zealand Dollar (8.2 percent) vs New Zealand Dollar previous week (9.1 percent)
Mexican Peso (82.4 percent) vs Mexican Peso previous week (80.5 percent)
Brazilian Real (52.8 percent) vs Brazilian Real previous week (52.9 percent)
Bitcoin (59.0 percent) vs Bitcoin previous week (54.2 percent)


Canadian Dollar & Australian Dollar top the 6-Week Strength Trends

Speculators Trends FX Futures COT Chart
COT Strength Score Trends (or move index, calculates the 6-week changes in strength scores) showed that the Canadian Dollar (44 percent) and the Australian Dollar (35 percent) lead the past six weeks trends for the currencies. The British Pound (23 percent), the US Dollar Index (20 percent) and the New Zealand Dollar (8 percent) are the next highest positive movers in the 3-Year trends data.

The Brazilian Real (-29 percent) leads the downside trend scores currently with the Japanese Yen (-17 percent), EuroFX (-10 percent) and the Swiss Franc (-9 percent) following next with lower trend scores.

3-Year Strength Trends:
US Dollar Index (20.1 percent) vs US Dollar Index previous week (33.7 percent)
EuroFX (-10.3 percent) vs EuroFX previous week (9.2 percent)
British Pound Sterling (22.7 percent) vs British Pound Sterling previous week (23.3 percent)
Japanese Yen (-17.1 percent) vs Japanese Yen previous week (-22.4 percent)
Swiss Franc (-9.3 percent) vs Swiss Franc previous week (-15.4 percent)
Canadian Dollar (43.8 percent) vs Canadian Dollar previous week (53.2 percent)
Australian Dollar (34.7 percent) vs Australian Dollar previous week (45.8 percent)
New Zealand Dollar (8.2 percent) vs New Zealand Dollar previous week (4.9 percent)
Mexican Peso (0.1 percent) vs Mexican Peso previous week (2.5 percent)
Brazilian Real (-29.0 percent) vs Brazilian Real previous week (-31.3 percent)
Bitcoin (0.7 percent) vs Bitcoin previous week (-10.6 percent)


Individual COT Forex Markets:

US Dollar Index Futures:

US Dollar Index Forex Futures COT ChartThe US Dollar Index large speculator standing this week came in at a net position of -6,418 contracts in the data reported through Tuesday. This was a weekly decline of -2,688 contracts from the previous week which had a total of -3,730 net contracts.

This week’s current strength score (the trader positioning range over the past three years, measured from 0 to 100) shows the speculators are currently Bearish with a score of 26.8 percent. The commercials are Bullish with a score of 73.8 percent and the small traders (not shown in chart) are Bearish with a score of 35.1 percent.

Price Trend-Following Model: Strong Downtrend

Our weekly trend-following model classifies the current market price position as: Strong Downtrend.

US DOLLAR INDEX StatisticsSPECULATORSCOMMERCIALSSMALL TRADERS
– Percent of Open Interest Longs:54.130.59.3
– Percent of Open Interest Shorts:75.89.29.0
– Net Position:-6,4186,305113
– Gross Longs:16,0039,0232,762
– Gross Shorts:22,4212,7182,649
– Long to Short Ratio:0.7 to 13.3 to 11.0 to 1
NET POSITION TREND:
– Strength Index Score (3 Year Range Pct):26.873.835.1
– Strength Index Reading (3 Year Range):BearishBullishBearish
NET POSITION MOVEMENT INDEX:
– 6-Week Change in Strength Index:20.1-19.9-2.0


Euro Currency Futures:

Euro Currency Futures COT ChartThe Euro Currency large speculator standing this week came in at a net position of 111,695 contracts in the data reported through Tuesday. This was a weekly fall of -20,961 contracts from the previous week which had a total of 132,656 net contracts.

This week’s current strength score (the trader positioning range over the past three years, measured from 0 to 100) shows the speculators are currently Bullish with a score of 71.3 percent. The commercials are Bearish with a score of 28.2 percent and the small traders (not shown in chart) are Bullish with a score of 67.2 percent.

Price Trend-Following Model: Strong Uptrend

Our weekly trend-following model classifies the current market price position as: Strong Uptrend.

EURO Currency StatisticsSPECULATORSCOMMERCIALSSMALL TRADERS
– Percent of Open Interest Longs:31.255.410.6
– Percent of Open Interest Shorts:18.673.15.6
– Net Position:111,695-155,59643,901
– Gross Longs:275,235488,16692,941
– Gross Shorts:163,540643,76249,040
– Long to Short Ratio:1.7 to 10.8 to 11.9 to 1
NET POSITION TREND:
– Strength Index Score (3 Year Range Pct):71.328.267.2
– Strength Index Reading (3 Year Range):BullishBearishBullish
NET POSITION MOVEMENT INDEX:
– 6-Week Change in Strength Index:-10.311.6-14.6


British Pound Sterling Futures:

British Pound Sterling Futures COT ChartThe British Pound Sterling large speculator standing this week came in at a net position of -21,980 contracts in the data reported through Tuesday. This was a weekly lift of 3,290 contracts from the previous week which had a total of -25,270 net contracts.

This week’s current strength score (the trader positioning range over the past three years, measured from 0 to 100) shows the speculators are currently Bearish with a score of 30.3 percent. The commercials are Bullish with a score of 66.9 percent and the small traders (not shown in chart) are Bullish with a score of 66.0 percent.

Price Trend-Following Model: Strong Uptrend

Our weekly trend-following model classifies the current market price position as: Strong Uptrend.

BRITISH POUND StatisticsSPECULATORSCOMMERCIALSSMALL TRADERS
– Percent of Open Interest Longs:39.243.816.0
– Percent of Open Interest Shorts:49.835.613.7
– Net Position:-21,98017,0824,898
– Gross Longs:81,33291,02333,243
– Gross Shorts:103,31273,94128,345
– Long to Short Ratio:0.8 to 11.2 to 11.2 to 1
NET POSITION TREND:
– Strength Index Score (3 Year Range Pct):30.366.966.0
– Strength Index Reading (3 Year Range):BearishBullishBullish
NET POSITION MOVEMENT INDEX:
– 6-Week Change in Strength Index:22.7-26.235.5


Japanese Yen Futures:

Japanese Yen Forex Futures COT ChartThe Japanese Yen large speculator standing this week came in at a net position of -44,829 contracts in the data reported through Tuesday. This was a weekly boost of 335 contracts from the previous week which had a total of -45,164 net contracts.

This week’s current strength score (the trader positioning range over the past three years, measured from 0 to 100) shows the speculators are currently Bearish with a score of 38.4 percent. The commercials are Bullish with a score of 61.3 percent and the small traders (not shown in chart) are Bearish with a score of 46.4 percent.

Price Trend-Following Model: Downtrend

Our weekly trend-following model classifies the current market price position as: Downtrend.

JAPANESE YEN StatisticsSPECULATORSCOMMERCIALSSMALL TRADERS
– Percent of Open Interest Longs:36.639.514.7
– Percent of Open Interest Shorts:51.925.413.5
– Net Position:-44,82941,1403,689
– Gross Longs:107,139115,58343,047
– Gross Shorts:151,96874,44339,358
– Long to Short Ratio:0.7 to 11.6 to 11.1 to 1
NET POSITION TREND:
– Strength Index Score (3 Year Range Pct):38.461.346.4
– Strength Index Reading (3 Year Range):BearishBullishBearish
NET POSITION MOVEMENT INDEX:
– 6-Week Change in Strength Index:-17.114.97.9


Swiss Franc Futures:

Swiss Franc Forex Futures COT ChartThe Swiss Franc large speculator standing this week came in at a net position of -43,207 contracts in the data reported through Tuesday. This was a weekly increase of 185 contracts from the previous week which had a total of -43,392 net contracts.

This week’s current strength score (the trader positioning range over the past three years, measured from 0 to 100) shows the speculators are currently Bearish-Extreme with a score of 13.3 percent. The commercials are Bullish with a score of 77.7 percent and the small traders (not shown in chart) are Bullish with a score of 58.6 percent.

Price Trend-Following Model: Strong Uptrend

Our weekly trend-following model classifies the current market price position as: Strong Uptrend.

SWISS FRANC StatisticsSPECULATORSCOMMERCIALSSMALL TRADERS
– Percent of Open Interest Longs:12.573.314.1
– Percent of Open Interest Shorts:56.524.419.0
– Net Position:-43,20747,972-4,765
– Gross Longs:12,25771,87313,860
– Gross Shorts:55,46423,90118,625
– Long to Short Ratio:0.2 to 13.0 to 10.7 to 1
NET POSITION TREND:
– Strength Index Score (3 Year Range Pct):13.377.758.6
– Strength Index Reading (3 Year Range):Bearish-ExtremeBullishBullish
NET POSITION MOVEMENT INDEX:
– 6-Week Change in Strength Index:-9.38.8-3.5


Canadian Dollar Futures:

Canadian Dollar Forex Futures COT ChartThe Canadian Dollar large speculator standing this week came in at a net position of -41,785 contracts in the data reported through Tuesday. This was a weekly lift of 465 contracts from the previous week which had a total of -42,250 net contracts.

This week’s current strength score (the trader positioning range over the past three years, measured from 0 to 100) shows the speculators are currently Bullish with a score of 76.2 percent. The commercials are Bearish with a score of 30.5 percent and the small traders (not shown in chart) are Bearish with a score of 33.6 percent.

Price Trend-Following Model: Strong Uptrend

Our weekly trend-following model classifies the current market price position as: Strong Uptrend.

CANADIAN DOLLAR StatisticsSPECULATORSCOMMERCIALSSMALL TRADERS
– Percent of Open Interest Longs:27.856.213.0
– Percent of Open Interest Shorts:47.434.715.0
– Net Position:-41,78545,990-4,205
– Gross Longs:59,456120,14227,744
– Gross Shorts:101,24174,15231,949
– Long to Short Ratio:0.6 to 11.6 to 10.9 to 1
NET POSITION TREND:
– Strength Index Score (3 Year Range Pct):76.230.533.6
– Strength Index Reading (3 Year Range):BullishBearishBearish
NET POSITION MOVEMENT INDEX:
– 6-Week Change in Strength Index:43.8-40.810.9


Australian Dollar Futures:

Australian Dollar Forex Futures COT ChartThe Australian Dollar large speculator standing this week came in at a net position of -14,011 contracts in the data reported through Tuesday. This was a weekly gain of 4,835 contracts from the previous week which had a total of -18,846 net contracts.

This week’s current strength score (the trader positioning range over the past three years, measured from 0 to 100) shows the speculators are currently Bullish with a score of 66.4 percent. The commercials are Bearish with a score of 22.9 percent and the small traders (not shown in chart) are Bullish-Extreme with a score of 100.0 percent.

Price Trend-Following Model: Strong Uptrend

Our weekly trend-following model classifies the current market price position as: Strong Uptrend.

AUSTRALIAN DOLLAR StatisticsSPECULATORSCOMMERCIALSSMALL TRADERS
– Percent of Open Interest Longs:37.243.618.5
– Percent of Open Interest Shorts:43.348.77.3
– Net Position:-14,011-11,78725,798
– Gross Longs:85,759100,60842,698
– Gross Shorts:99,770112,39516,900
– Long to Short Ratio:0.9 to 10.9 to 12.5 to 1
NET POSITION TREND:
– Strength Index Score (3 Year Range Pct):66.422.9100.0
– Strength Index Reading (3 Year Range):BullishBearishBullish-Extreme
NET POSITION MOVEMENT INDEX:
– 6-Week Change in Strength Index:34.7-33.917.9


New Zealand Dollar Futures:

New Zealand Dollar Forex Futures COT ChartThe New Zealand Dollar large speculator standing this week came in at a net position of -49,610 contracts in the data reported through Tuesday. This was a weekly reduction of -759 contracts from the previous week which had a total of -48,851 net contracts.

This week’s current strength score (the trader positioning range over the past three years, measured from 0 to 100) shows the speculators are currently Bearish-Extreme with a score of 8.2 percent. The commercials are Bullish-Extreme with a score of 91.2 percent and the small traders (not shown in chart) are Bearish with a score of 36.7 percent.

Price Trend-Following Model: Weak Downtrend

Our weekly trend-following model classifies the current market price position as: Weak Downtrend.

NEW ZEALAND DOLLAR StatisticsSPECULATORSCOMMERCIALSSMALL TRADERS
– Percent of Open Interest Longs:14.879.44.0
– Percent of Open Interest Shorts:68.324.65.3
– Net Position:-49,61050,811-1,201
– Gross Longs:13,67073,6193,742
– Gross Shorts:63,28022,8084,943
– Long to Short Ratio:0.2 to 13.2 to 10.8 to 1
NET POSITION TREND:
– Strength Index Score (3 Year Range Pct):8.291.236.7
– Strength Index Reading (3 Year Range):Bearish-ExtremeBullish-ExtremeBearish
NET POSITION MOVEMENT INDEX:
– 6-Week Change in Strength Index:8.2-8.76.9


Mexican Peso Futures:

Mexican Peso Futures COT ChartThe Mexican Peso large speculator standing this week came in at a net position of 107,153 contracts in the data reported through Tuesday. This was a weekly increase of 3,595 contracts from the previous week which had a total of 103,558 net contracts.

This week’s current strength score (the trader positioning range over the past three years, measured from 0 to 100) shows the speculators are currently Bullish-Extreme with a score of 82.4 percent. The commercials are Bearish-Extreme with a score of 17.6 percent and the small traders (not shown in chart) are Bearish with a score of 49.3 percent.

Price Trend-Following Model: Strong Uptrend

Our weekly trend-following model classifies the current market price position as: Strong Uptrend.

MEXICAN PESO StatisticsSPECULATORSCOMMERCIALSSMALL TRADERS
– Percent of Open Interest Longs:63.932.43.2
– Percent of Open Interest Shorts:19.379.11.2
– Net Position:107,153-111,9384,785
– Gross Longs:153,39877,7737,650
– Gross Shorts:46,245189,7112,865
– Long to Short Ratio:3.3 to 10.4 to 12.7 to 1
NET POSITION TREND:
– Strength Index Score (3 Year Range Pct):82.417.649.3
– Strength Index Reading (3 Year Range):Bullish-ExtremeBearish-ExtremeBearish
NET POSITION MOVEMENT INDEX:
– 6-Week Change in Strength Index:0.1-0.65.4


Brazilian Real Futures:

Brazil Real Futures COT ChartThe Brazilian Real large speculator standing this week came in at a net position of 17,641 contracts in the data reported through Tuesday. This was a weekly lowering of -233 contracts from the previous week which had a total of 17,874 net contracts.

This week’s current strength score (the trader positioning range over the past three years, measured from 0 to 100) shows the speculators are currently Bullish with a score of 52.8 percent. The commercials are Bearish with a score of 46.1 percent and the small traders (not shown in chart) are Bearish with a score of 41.3 percent.

Price Trend-Following Model: Weak Downtrend

Our weekly trend-following model classifies the current market price position as: Weak Downtrend.

BRAZIL REAL StatisticsSPECULATORSCOMMERCIALSSMALL TRADERS
– Percent of Open Interest Longs:66.026.95.7
– Percent of Open Interest Shorts:44.353.01.2
– Net Position:17,641-21,2653,624
– Gross Longs:53,73021,9114,628
– Gross Shorts:36,08943,1761,004
– Long to Short Ratio:1.5 to 10.5 to 14.6 to 1
NET POSITION TREND:
– Strength Index Score (3 Year Range Pct):52.846.141.3
– Strength Index Reading (3 Year Range):BullishBearishBearish
NET POSITION MOVEMENT INDEX:
– 6-Week Change in Strength Index:-29.027.66.3


Bitcoin Futures:

Bitcoin Crypto Futures COT ChartThe Bitcoin large speculator standing this week came in at a net position of 298 contracts in the data reported through Tuesday. This was a weekly lift of 229 contracts from the previous week which had a total of 69 net contracts.

This week’s current strength score (the trader positioning range over the past three years, measured from 0 to 100) shows the speculators are currently Bullish with a score of 59.0 percent. The commercials are Bearish with a score of 46.7 percent and the small traders (not shown in chart) are Bearish with a score of 45.0 percent.

Price Trend-Following Model: Downtrend

Our weekly trend-following model classifies the current market price position as: Downtrend.

BITCOIN StatisticsSPECULATORSCOMMERCIALSSMALL TRADERS
– Percent of Open Interest Longs:80.83.85.2
– Percent of Open Interest Shorts:79.65.64.6
– Net Position:298-445147
– Gross Longs:19,8419401,285
– Gross Shorts:19,5431,3851,138
– Long to Short Ratio:1.0 to 10.7 to 11.1 to 1
NET POSITION TREND:
– Strength Index Score (3 Year Range Pct):59.046.745.0
– Strength Index Reading (3 Year Range):BullishBearishBearish
NET POSITION MOVEMENT INDEX:
– 6-Week Change in Strength Index:0.7-2.23.4


Article By InvestMacroReceive our weekly COT Newsletter

*COT Report: The COT data, released weekly to the public each Friday, is updated through the most recent Tuesday (data is 3 days old) and shows a quick view of how large speculators or non-commercials (for-profit traders) were positioned in the futures markets.

The CFTC categorizes trader positions according to commercial hedgers (traders who use futures contracts for hedging as part of the business), non-commercials (large traders who speculate to realize trading profits) and nonreportable traders (usually small traders/speculators) as well as their open interest (contracts open in the market at time of reporting). See CFTC criteria here.