By InvestMacro
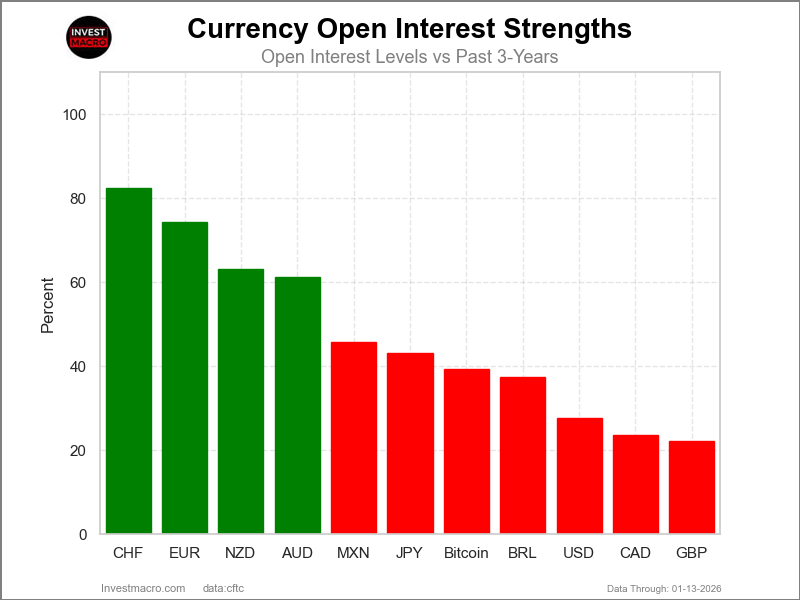
Here are the latest charts and statistics for the Commitment of Traders (COT) data published by the Commodities Futures Trading Commission (CFTC).
The latest COT data is updated through Tuesday January 13th and shows a quick view of how large market participants (for-profit speculators and commercial traders) were positioned in the futures markets. All currency positions are in direct relation to the US dollar where, for example, a bet for the euro is a bet that the euro will rise versus the dollar while a bet against the euro will be a bet that the euro will decline versus the dollar.
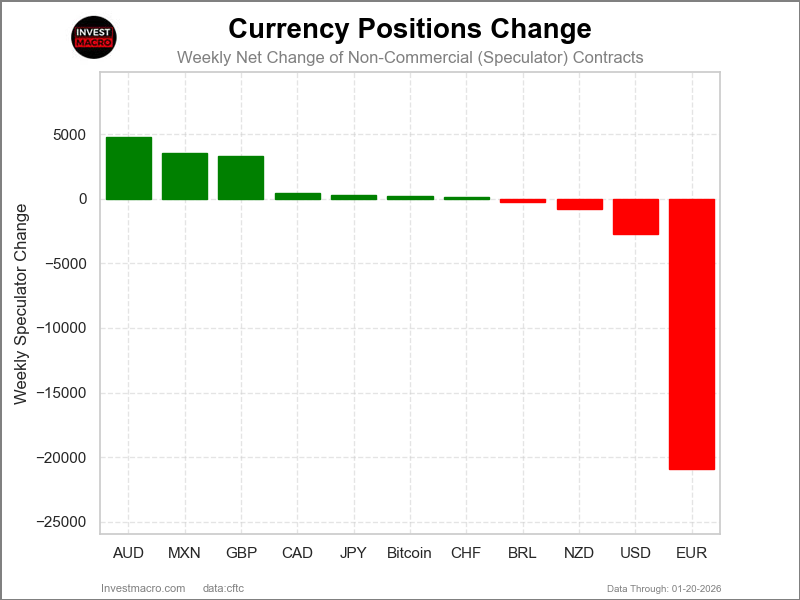
Weekly Speculator Changes led by British Pound
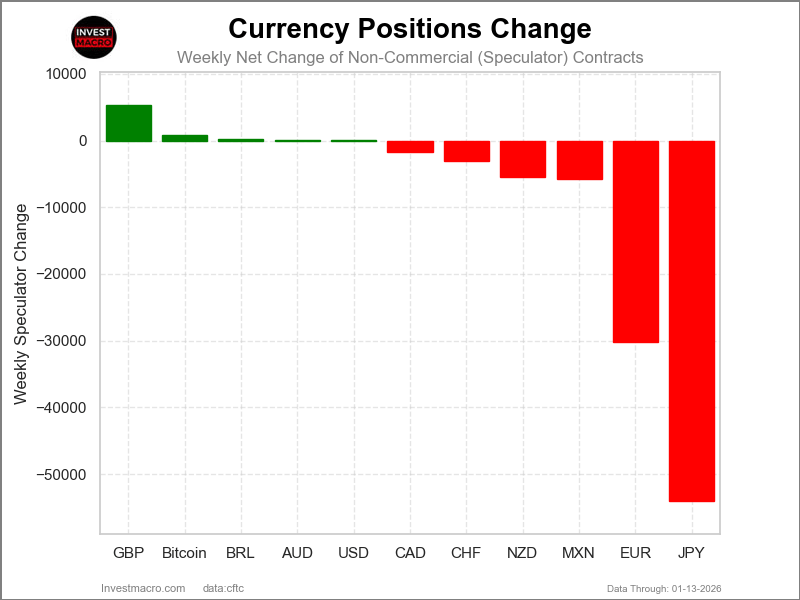
The COT currency market speculator bets were overall lower this week as five out of the eleven currency markets we cover had higher positioning and the other six markets had lower speculator contracts.
Leading the gains for the currency markets was the British Pound (5,268 contracts) with Bitcoin (803 contracts), the Brazilian Real (257 contracts), the Australian Dollar (114 contracts), the US Dollar Index (101 contracts) and also showing positive weeks.
The currencies seeing declines in speculator bets on the week were the Japanese Yen (-53,979 contracts), the EuroFX (-30,156 contracts), the New Zealand Dollar (-5,488 contracts), the Mexican Peso (-5,743 contracts), the Swiss Franc (-3,126 contracts) and with the Canadian Dollar (-1,665 contracts) also recording lower bets on the week.
Speculators bets improving for GBP, MXN and going bearish for JPY
Highlighting the latest currency data is the British pound sterling seeing improved sentiment, the Mexican peso with net contracts above +100,000 positions and the Japanese yen which is shedding speculator contracts.
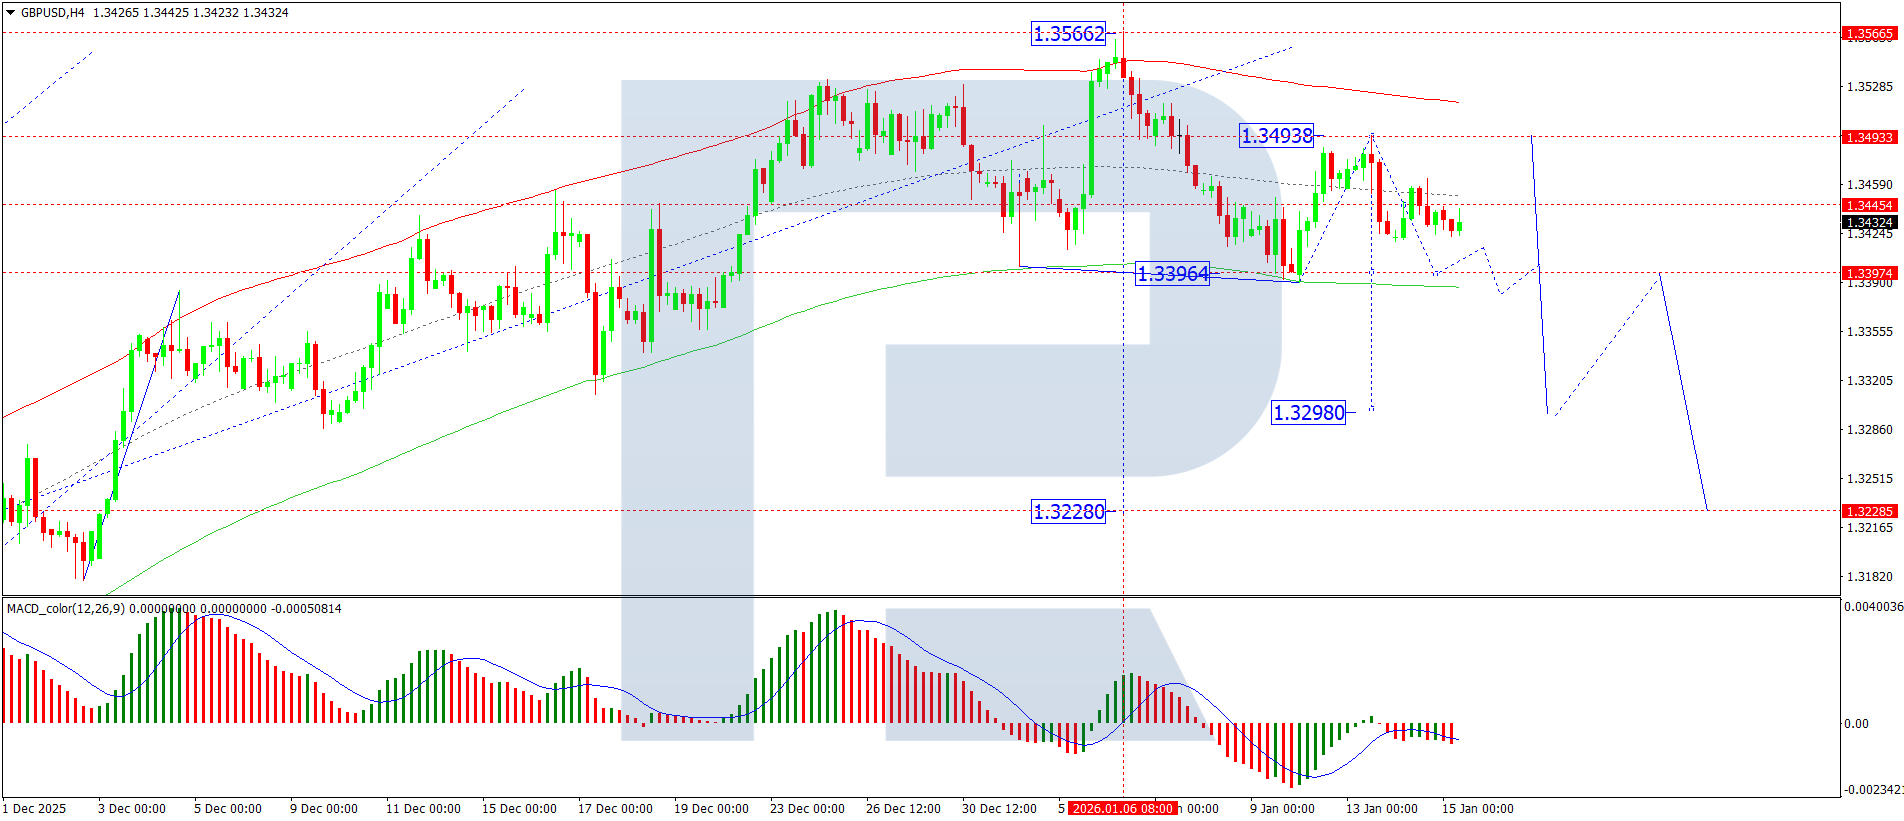
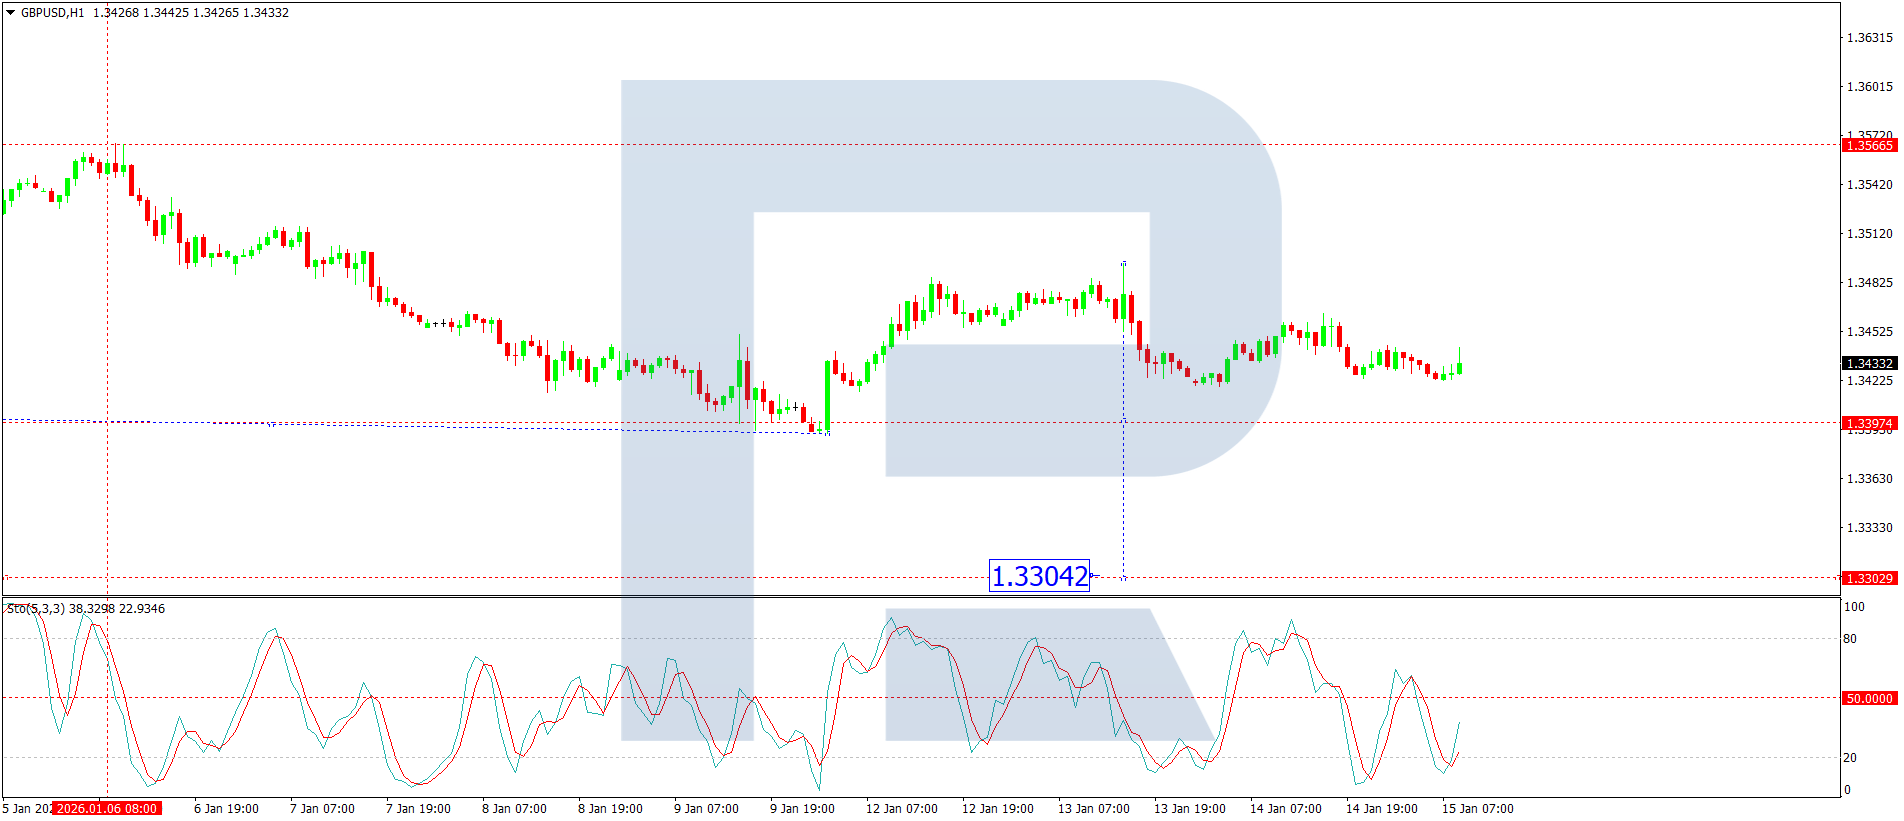
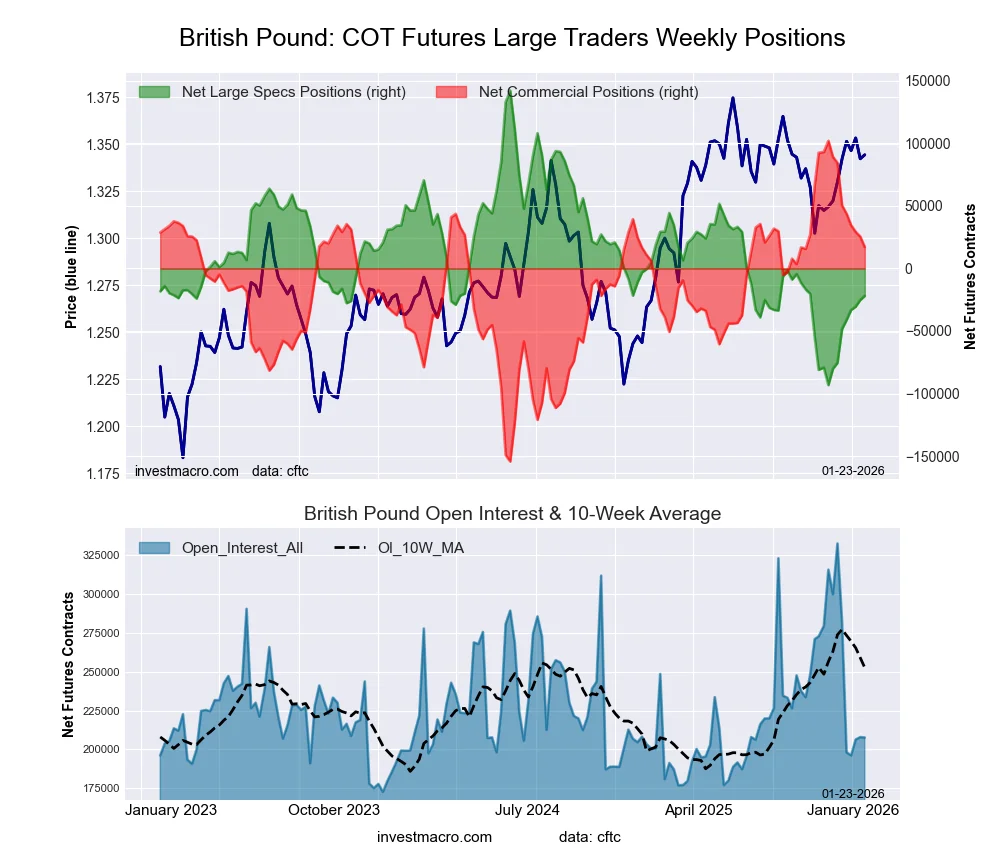
The British pound sterling which saw its speculator bets rise for a seventh straight week in the latest updated data. Over the last seven weeks, there have been +67,951 contracts added to the GBP speculator standing. This has taken the GBP positioning from a highly bearish -93,221 contracts to this week’s -25,270 contracts, which is the least bearish level of the last 11 weeks. The British pound sterling positioning has been consistently on the bearish side, dating back to July of 2025—a span of 25 weeks. The British pound exchange rate against the US Dollar has fluctuated since that time and is actually down by about 300 pips from the July 2025 high.
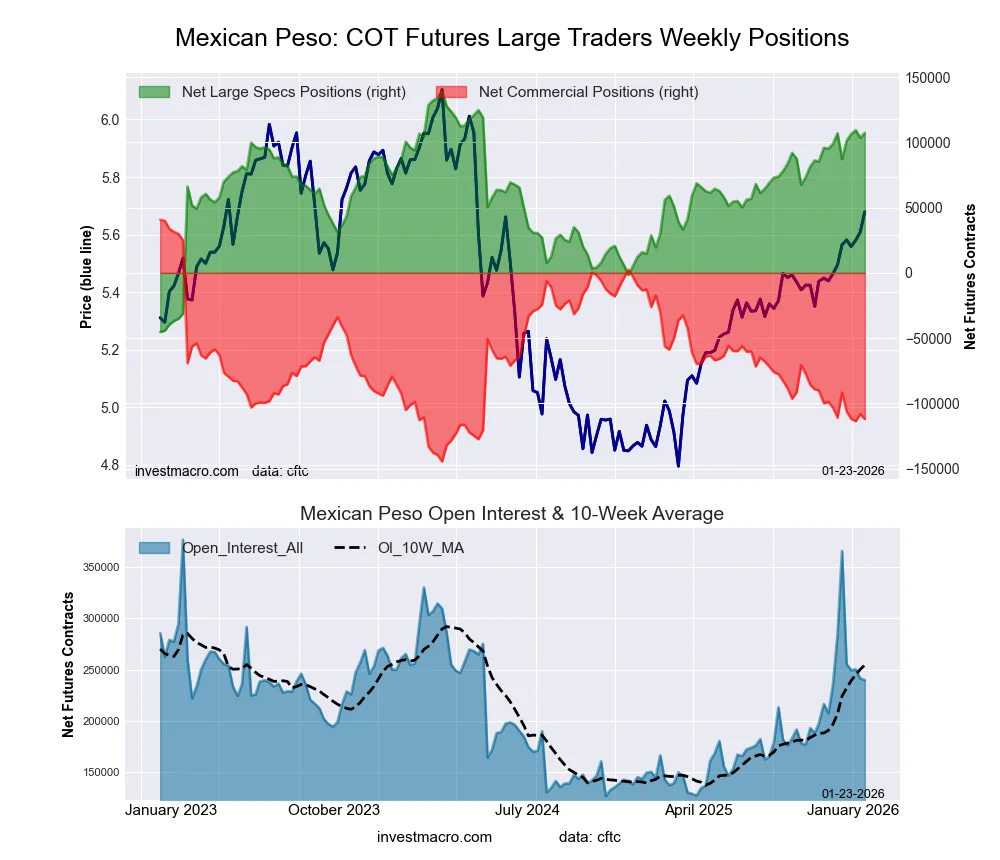
The Mexican peso futures speculator bets dipped this week for the first time in four weeks. However, the peso position is strongly bullish at the current moment, with the overall net position above the 100,000 contract level for a fourth straight week and for the fifth time out of the last six weeks. These are currently the highest and most bullish levels for the peso since June of 2024. In the currency market trading, the peso has been on a steady uptrend since bottoming in February 2025. Since hitting that bottom, the peso is up by roughly 20% against the US dollar and is up by over 2% to start 2026.
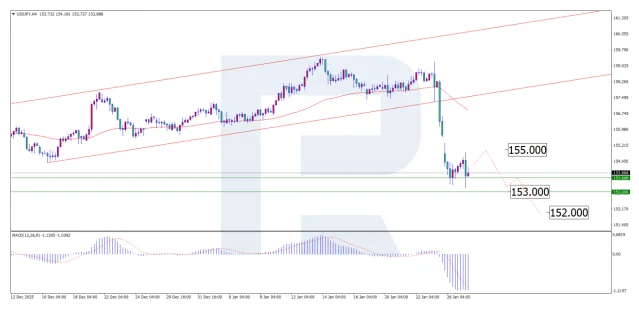
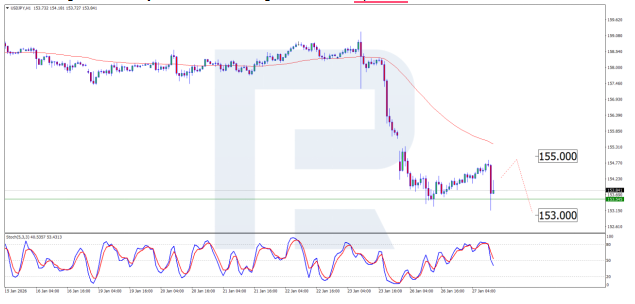
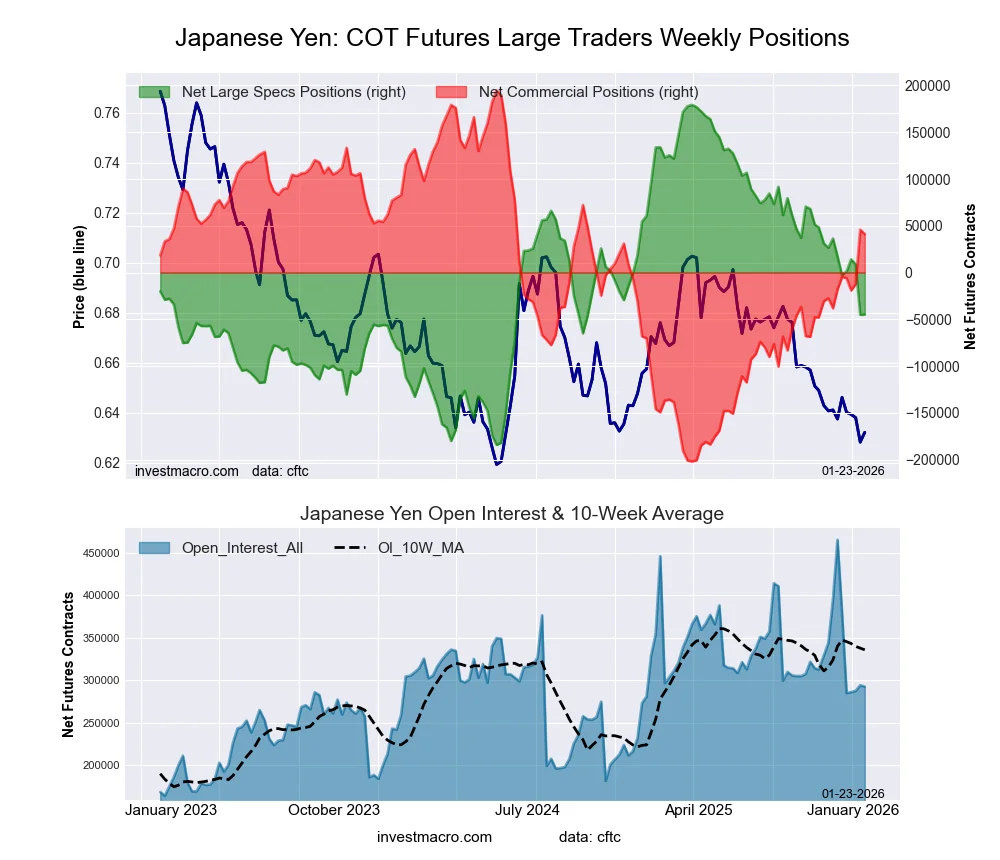
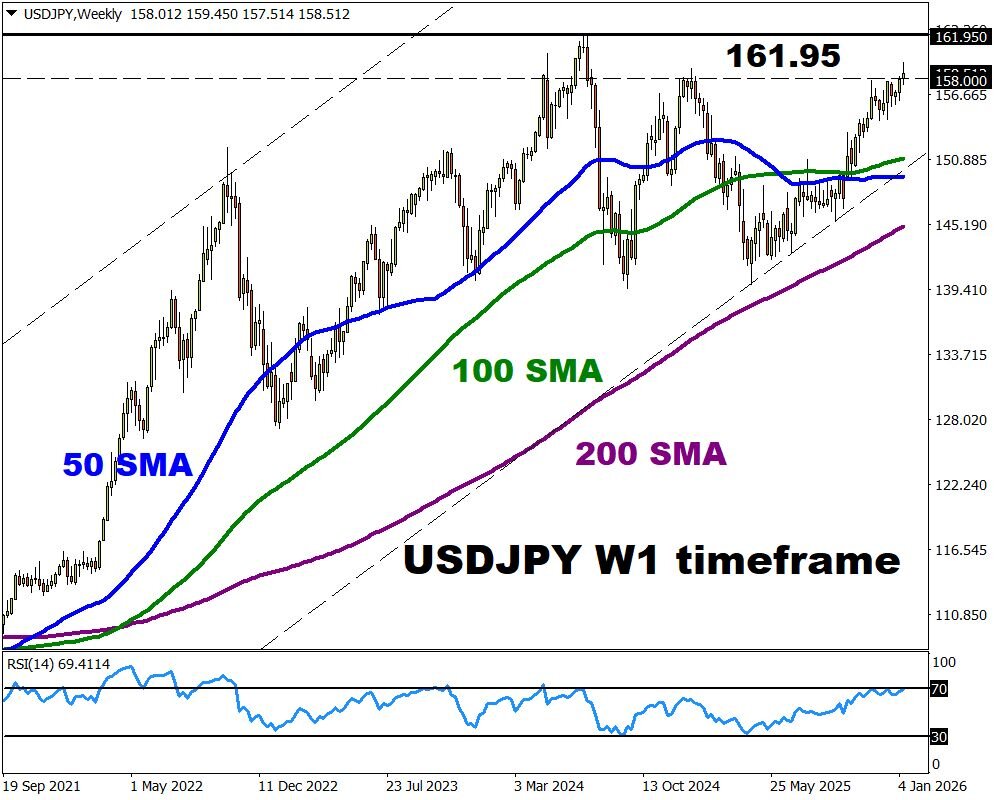
On the other end of the spectrum, the Japanese yen has seen its net speculator position fall into a bearish net standing this week at -45,164 contracts. This was because of a huge decline on the week of over -53,000 contracts. The sentiment for the Japanese yen has shifted sharply, as the yen bullish position was above +100,000 contracts consistently for 21 weeks last year from March all the way to July. Since then, there has been a steady decline week to week and month to month that has culminated in a negative bearish position for the yen. The yen futures price has also been on a stark downtrend and is touching the lowest levels since 2024. Despite recent interest rates in Japan rising (which is usually a boost for the home currency), the yen has been going the opposite way. Giving caution to the yen bulls is the outlook for the new prime minister possibly being implementing a dovish policy and hindering the Bank of Japan plans to hike the interest rate further.
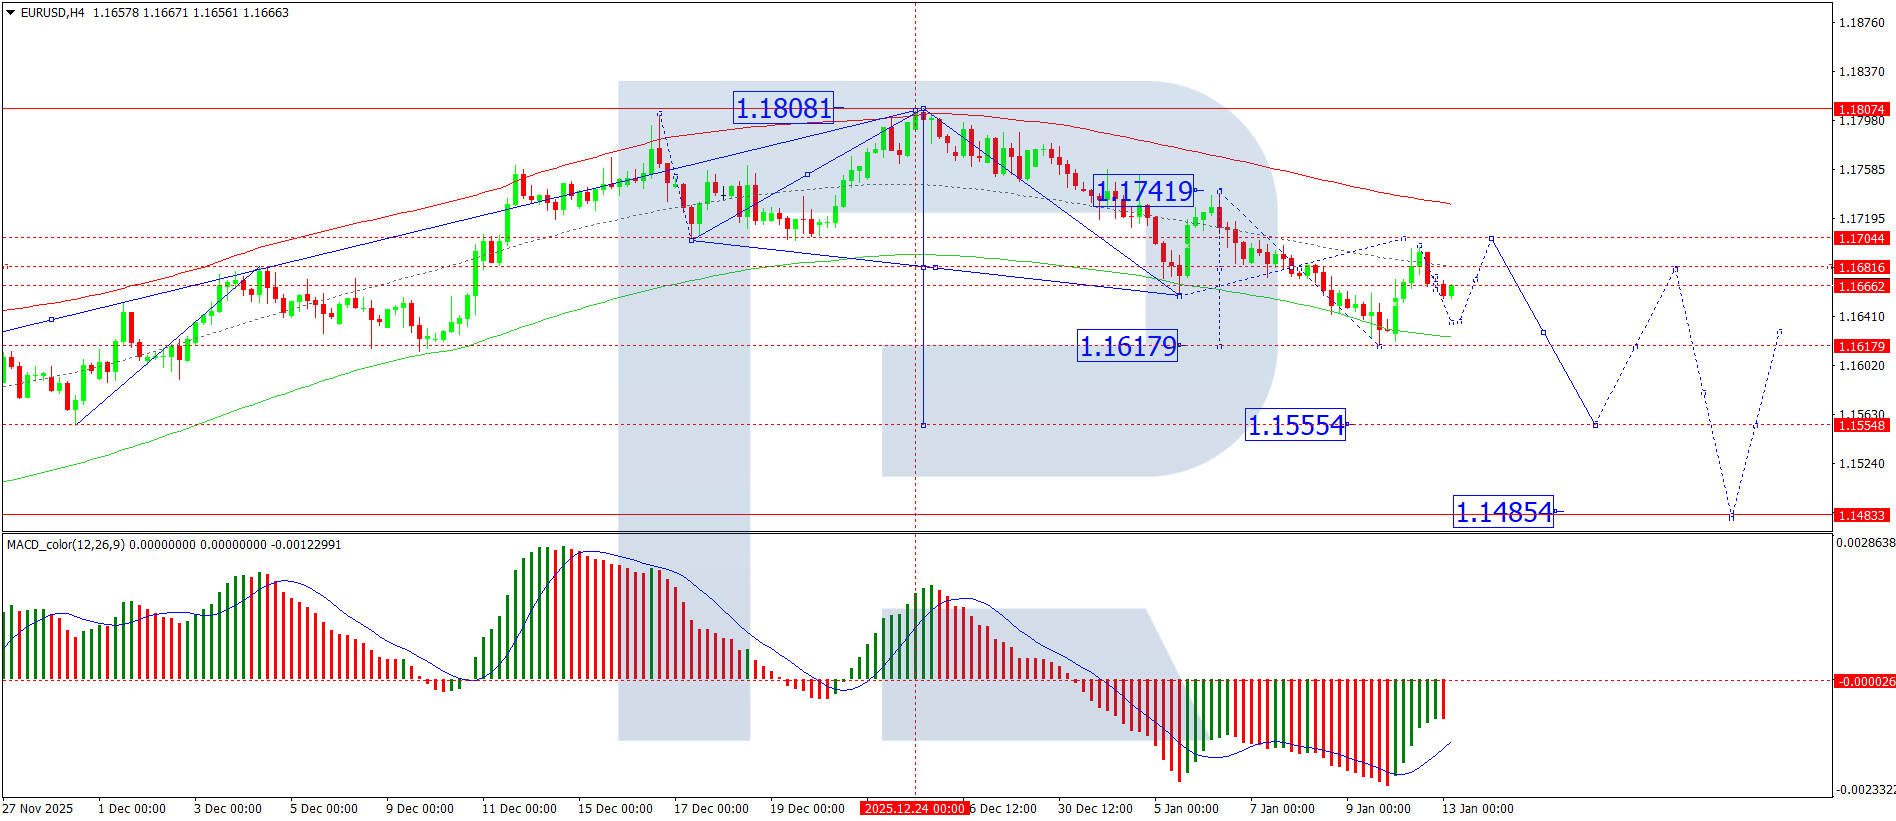
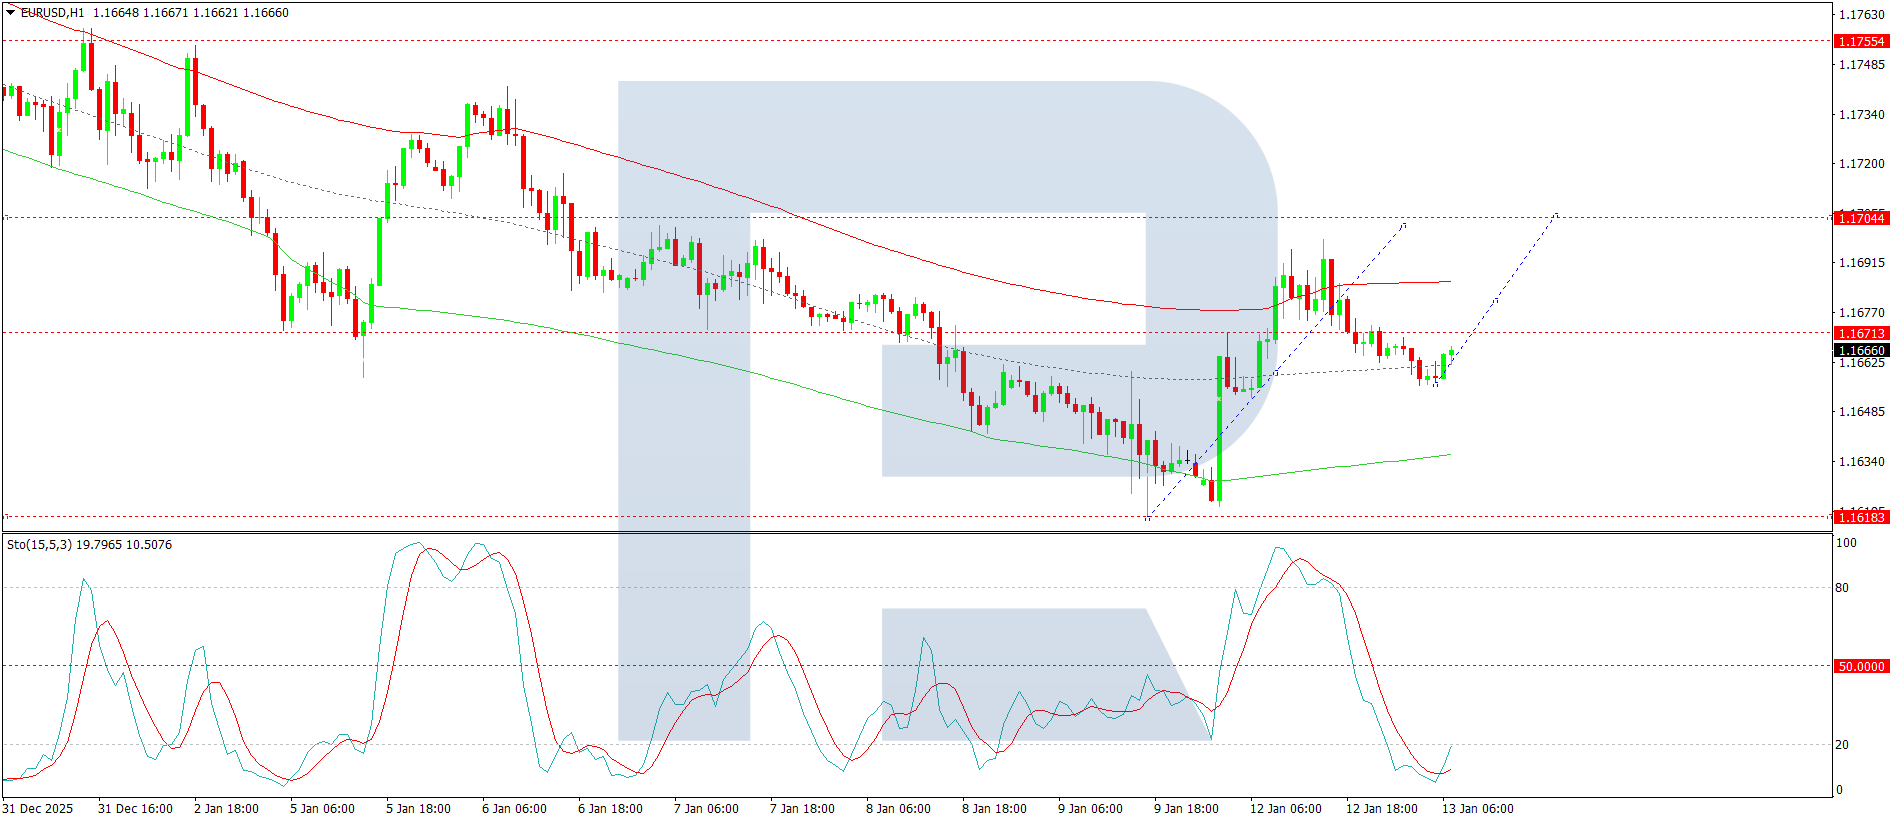
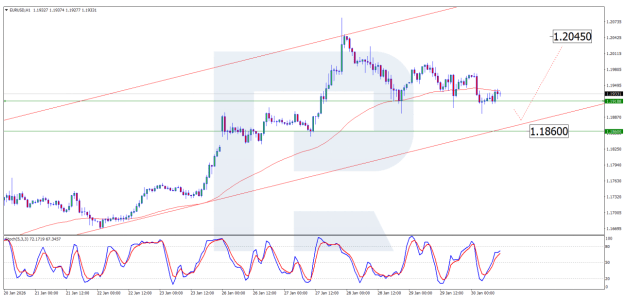
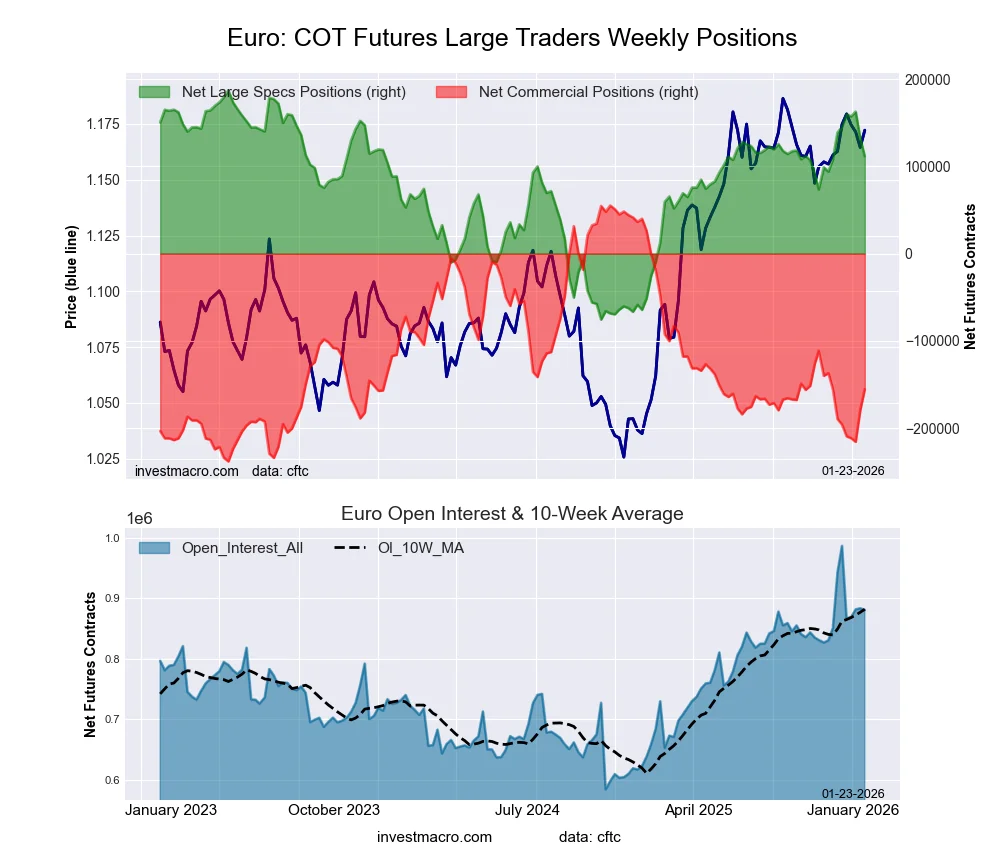
The Euro speculative position saw a large reduction in bullish bets this week. The change in this week’s speculative position looks like a cool off from a very high position, as the euro speculative contracts have now been over +100,000 for seven straight weeks and above the +100,000 net contract level in 27 out of the last 31 weeks. Last week marked the highest level (+162,812 net contracts) for Euro speculative positions since August of 2023. The Euro currency price seems to be in consolidation mode between the 1.1900 level on the top side and the 1.1500 level on the lower support. Currently in the month of January, the Euro is down by -1.3% but recently hit its highest level since 2021 in November at the high of 1.1979.
Bitcoin leads 5-Day Price Performance Changes
Currency market price changes this week were led by Bitcoin, which rose by almost 6%. The Mexican Peso was next with a 1.95% change over the past five days. The US Dollar Index was higher by 0.37%, and the New Zealand Dollar was higher by 0.35%.
On the downside, the Canadian Dollar was virtually unchanged with a 0.02% decline, followed by the Australian Dollar with a 0.07% decrease. Next up, the Japanese Yen was lower by 0.12%, and the British Pound, as well as the Brazilian Real, were both down by 0.20%. The Swiss Franc fell by 0.29%, followed by the Euro, which fell a similar 0.30% over the past five days.
The biggest movers over the past 90 days have been the Mexican Peso, which is up by approximately 5%. The Brazilian Real is up by almost 2% over that same period, while on the downside, the Japanese Yen has fallen sharply by -6.90% in the past 90 days. The New Zealand Dollar is down by -3.69% in the past 90 days.
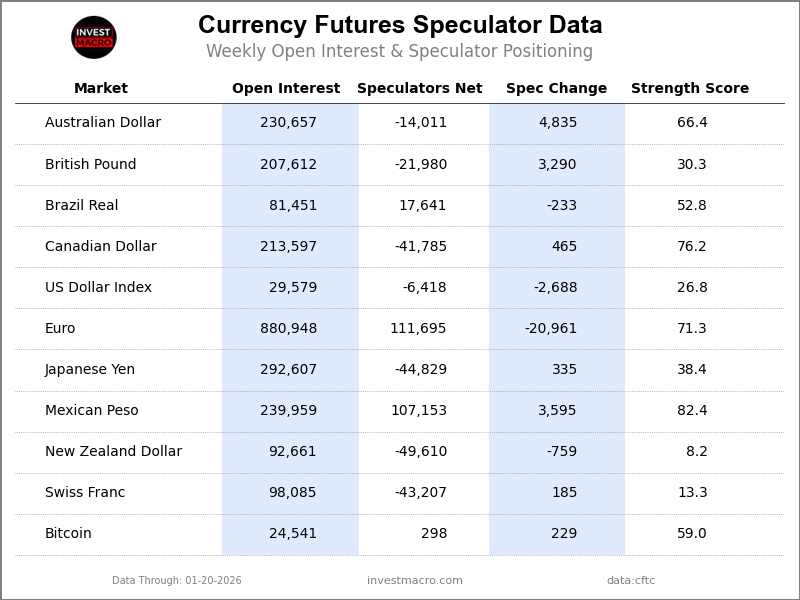
Currencies Data:
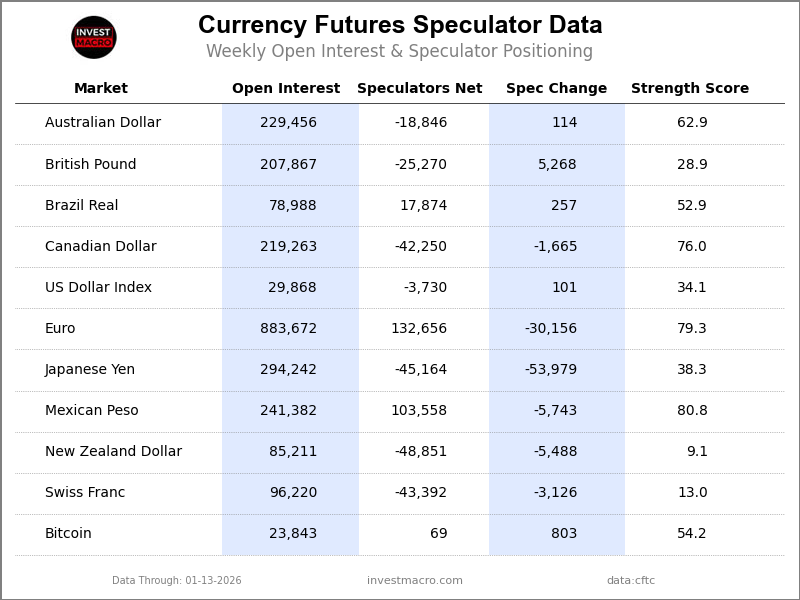
Legend: Open Interest | Speculators Current Net Position | Weekly Specs Change | Specs Strength Score compared to last 3-Years (0-100 range)
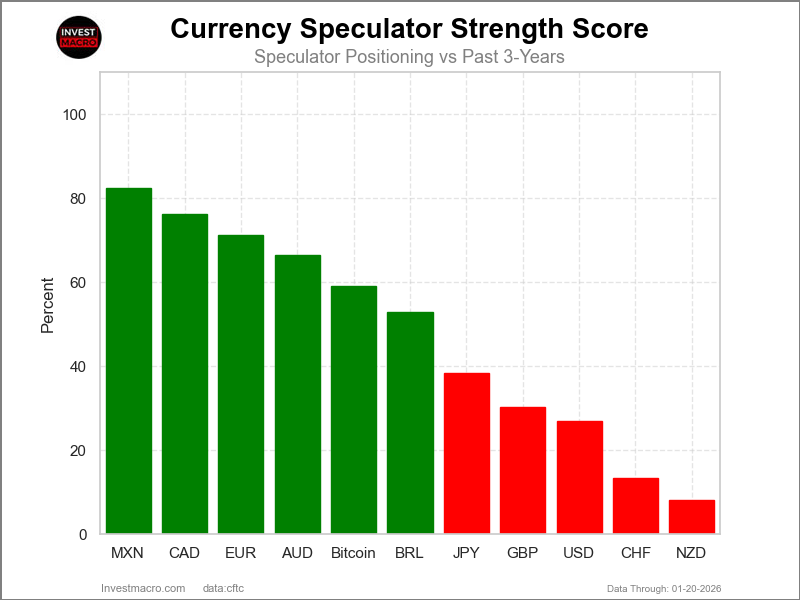
Strength Scores led by Mexican Peso & EuroFX
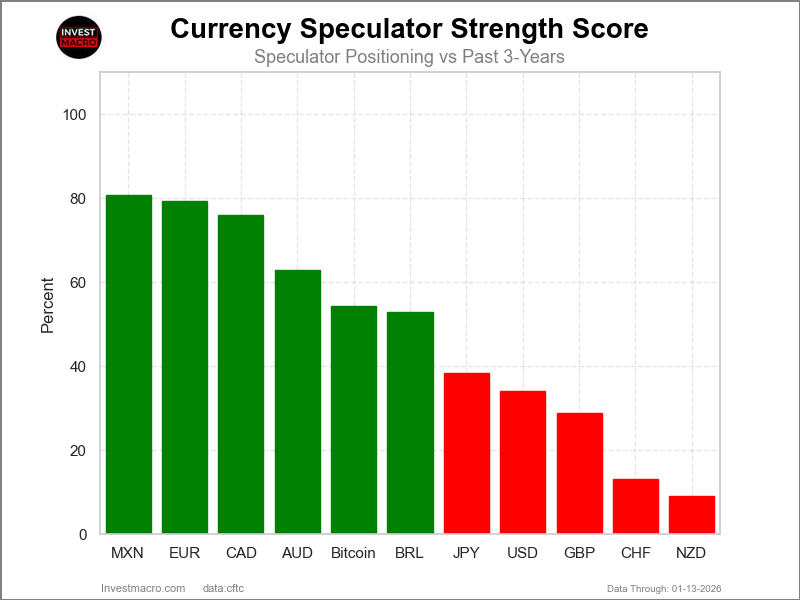
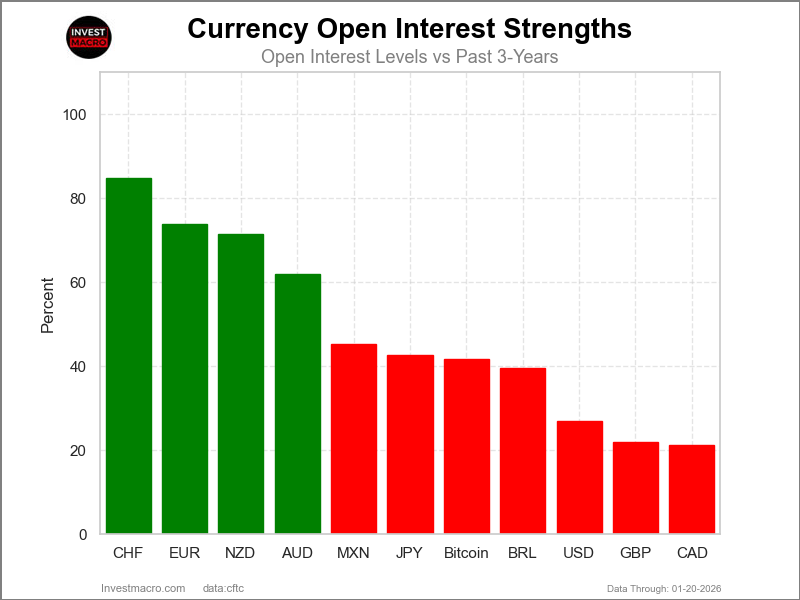
COT Strength Scores (a normalized measure of Speculator positions over a 3-Year range, from 0 to 100 where above 80 is Extreme-Bullish and below 20 is Extreme-Bearish) showed that the Mexican Peso (81 percent) and the EuroFX (79 percent) lead the currency markets this week. The Canadian Dollar (76 percent), the Australian Dollar (63 percent) and Bitcoin (54 percent) come in as the next highest in the weekly strength scores.
On the downside, the New Zealand Dollar (9 percent) and the Swiss Franc (13 percent) come in at the lowest strength levels currently and are in Extreme-Bearish territory (below 20 percent). The next lowest strength scores are the British Pound (29 percent) and the US Dollar Index (34 percent).
3-Year Strength Statistics:
US Dollar Index (34.1 percent) vs US Dollar Index previous week (33.8 percent)
EuroFX (79.3 percent) vs EuroFX previous week (90.8 percent)
British Pound Sterling (28.9 percent) vs British Pound Sterling previous week (26.6 percent)
Japanese Yen (38.3 percent) vs Japanese Yen previous week (53.1 percent)
Swiss Franc (13.0 percent) vs Swiss Franc previous week (19.3 percent)
Canadian Dollar (76.0 percent) vs Canadian Dollar previous week (76.8 percent)
Australian Dollar (62.9 percent) vs Australian Dollar previous week (62.8 percent)
New Zealand Dollar (9.1 percent) vs New Zealand Dollar previous week (15.3 percent)
Mexican Peso (80.8 percent) vs Mexican Peso previous week (83.9 percent)
Brazilian Real (52.9 percent) vs Brazilian Real previous week (52.7 percent)
Bitcoin (54.2 percent) vs Bitcoin previous week (37.1 percent)
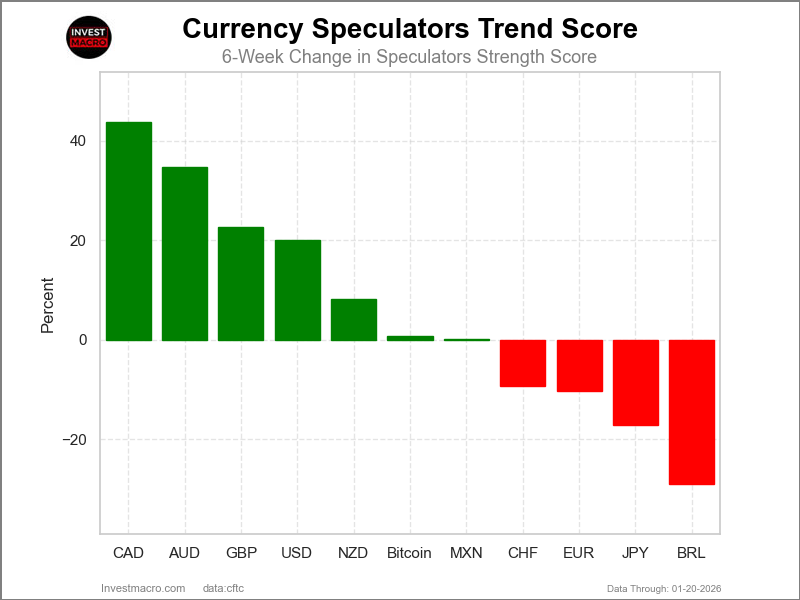
Canadian Dollar & Australian Dollar top the 6-Week Strength Trends
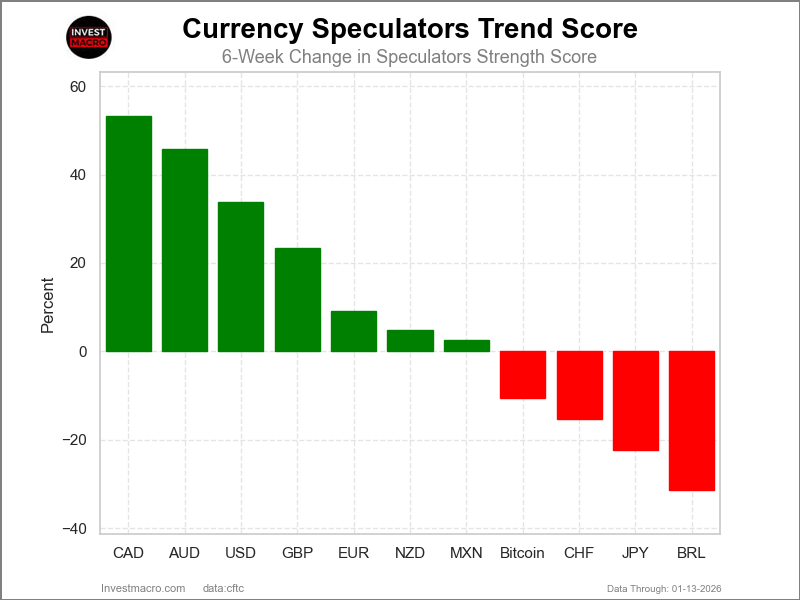
COT Strength Score Trends (or move index, calculates the 6-week changes in strength scores) showed that the Canadian Dollar (53 percent) and the Australian Dollar (46 percent) lead the past six weeks trends for the currencies. The US Dollar Index (34 percent), the British Pound (23 percent) and the EuroFX (9 percent) are the next highest positive movers in the 3-Year trends data.
The Brazilian Real (-31 percent) leads the downside trend scores currently with the Japanese Yen (-22 percent), the Swiss Franc (-15 percent) and Bitcoin (-11 percent) following next with lower trend scores.
3-Year Strength Trends:
US Dollar Index (33.7 percent) vs US Dollar Index previous week (33.8 percent)
EuroFX (9.2 percent) vs EuroFX previous week (26.2 percent)
British Pound Sterling (23.3 percent) vs British Pound Sterling previous week (26.6 percent)
Japanese Yen (-22.4 percent) vs Japanese Yen previous week (-4.9 percent)
Swiss Franc (-15.4 percent) vs Swiss Franc previous week (-9.9 percent)
Canadian Dollar (53.2 percent) vs Canadian Dollar previous week (54.2 percent)
Australian Dollar (45.8 percent) vs Australian Dollar previous week (46.3 percent)
New Zealand Dollar (4.9 percent) vs New Zealand Dollar previous week (9.9 percent)
Mexican Peso (2.5 percent) vs Mexican Peso previous week (7.5 percent)
Brazilian Real (-31.3 percent) vs Brazilian Real previous week (-28.5 percent)
Bitcoin (-10.6 percent) vs Bitcoin previous week (-13.8 percent)
Individual COT Forex Markets:
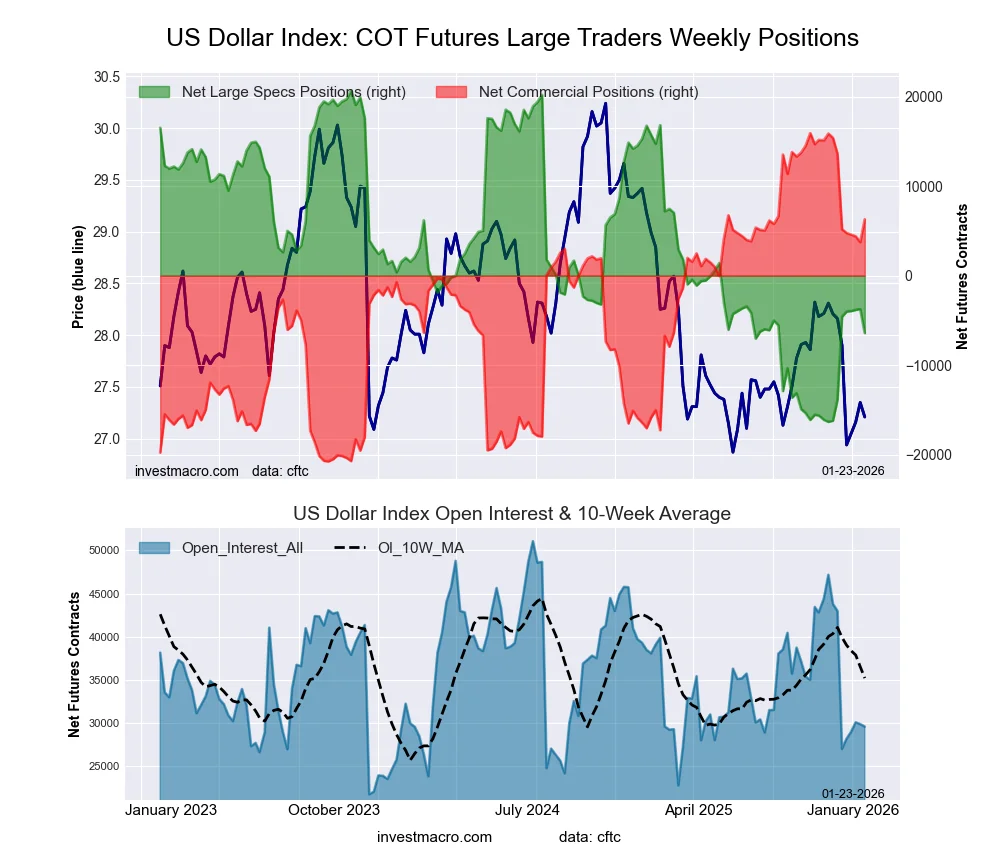
US Dollar Index Futures:
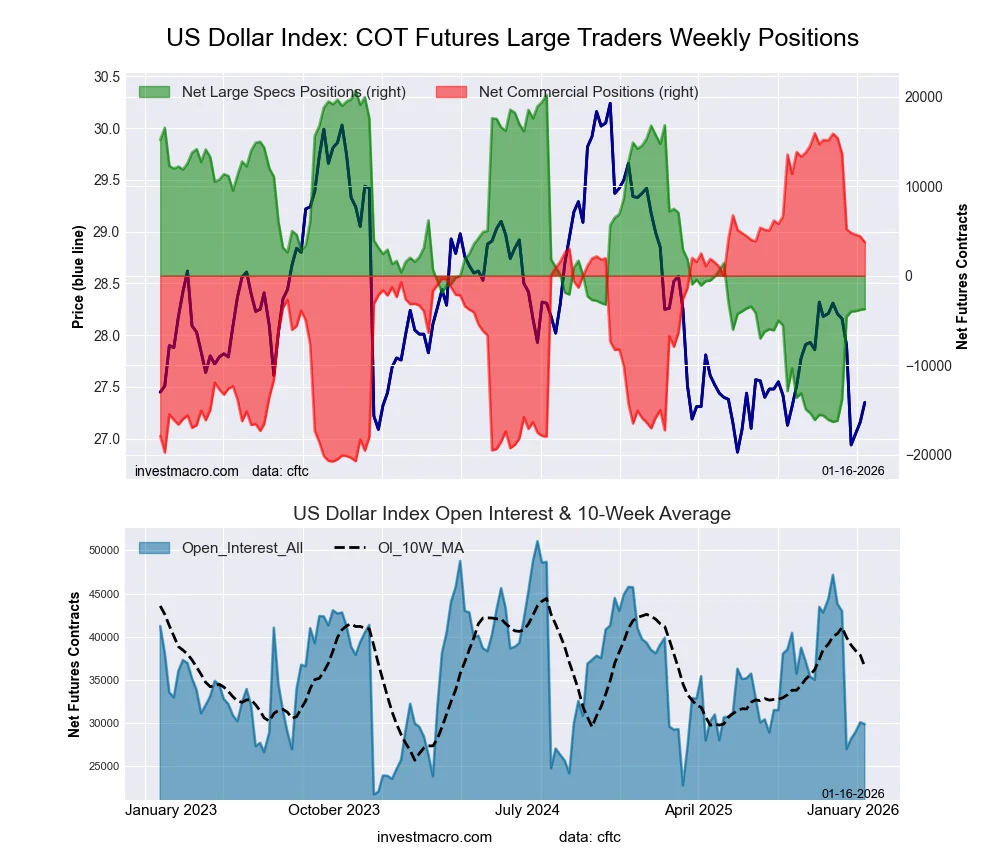 The US Dollar Index large speculator standing this week recorded a net position of -3,730 contracts in the data reported through Tuesday. This was a weekly advance of 101 contracts from the previous week which had a total of -3,831 net contracts.
This week’s current strength score (the trader positioning range over the past three years, measured from 0 to 100) shows the speculators are currently Bearish with a score of 34.1 percent. The commercials are Bullish with a score of 66.8 percent and the small traders (not shown in chart) are Bearish with a score of 33.3 percent.
Price Trend-Following Model: Weak Uptrend
Our weekly trend-following model classifies the current market price position as: Weak Uptrend.
| US DOLLAR INDEX Statistics | SPECULATORS | COMMERCIALS | SMALL TRADERS |
| – Percent of Open Interest Longs: | 60.0 | 24.0 | 9.9 |
| – Percent of Open Interest Shorts: | 72.5 | 11.4 | 9.9 |
| – Net Position: | -3,730 | 3,739 | -9 |
| – Gross Longs: | 17,929 | 7,158 | 2,952 |
| – Gross Shorts: | 21,659 | 3,419 | 2,961 |
| – Long to Short Ratio: | 0.8 to 1 | 2.1 to 1 | 1.0 to 1 |
| NET POSITION TREND: | | | |
| – Strength Index Score (3 Year Range Pct): | 34.1 | 66.8 | 33.3 |
| – Strength Index Reading (3 Year Range): | Bearish | Bullish | Bearish |
| NET POSITION MOVEMENT INDEX: | | | |
| – 6-Week Change in Strength Index: | 33.7 | -31.8 | -12.3 |
Euro Currency Futures:
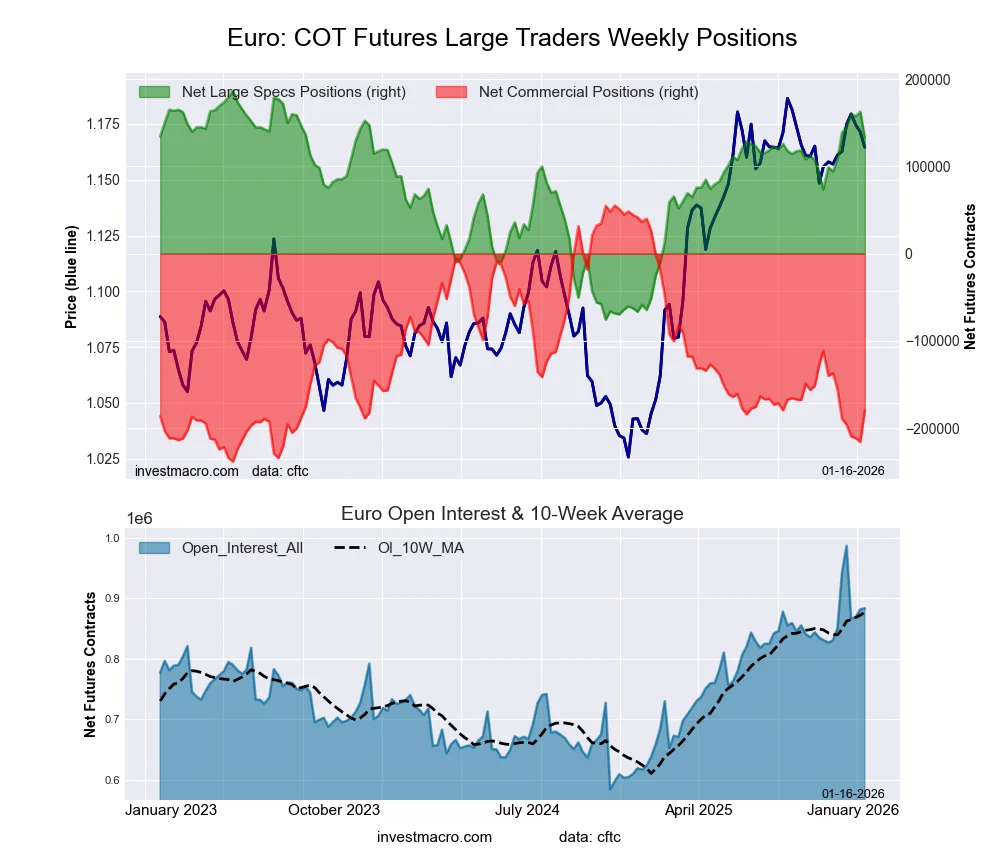 The Euro Currency large speculator standing this week recorded a net position of 132,656 contracts in the data reported through Tuesday. This was a weekly lowering of -30,156 contracts from the previous week which had a total of 162,812 net contracts.
This week’s current strength score (the trader positioning range over the past three years, measured from 0 to 100) shows the speculators are currently Bullish with a score of 79.3 percent. The commercials are Bearish-Extreme with a score of 20.0 percent and the small traders (not shown in chart) are Bullish with a score of 73.9 percent.
Price Trend-Following Model: Downtrend
Our weekly trend-following model classifies the current market price position as: Downtrend.
| EURO Currency Statistics | SPECULATORS | COMMERCIALS | SMALL TRADERS |
| – Percent of Open Interest Longs: | 32.1 | 55.2 | 10.4 |
| – Percent of Open Interest Shorts: | 17.1 | 75.5 | 5.0 |
| – Net Position: | 132,656 | -179,767 | 47,111 |
| – Gross Longs: | 283,592 | 487,595 | 91,580 |
| – Gross Shorts: | 150,936 | 667,362 | 44,469 |
| – Long to Short Ratio: | 1.9 to 1 | 0.7 to 1 | 2.1 to 1 |
| NET POSITION TREND: | | | |
| – Strength Index Score (3 Year Range Pct): | 79.3 | 20.0 | 73.9 |
| – Strength Index Reading (3 Year Range): | Bullish | Bearish-Extreme | Bullish |
| NET POSITION MOVEMENT INDEX: | | | |
| – 6-Week Change in Strength Index: | 9.2 | -8.2 | -0.4 |
British Pound Sterling Futures:
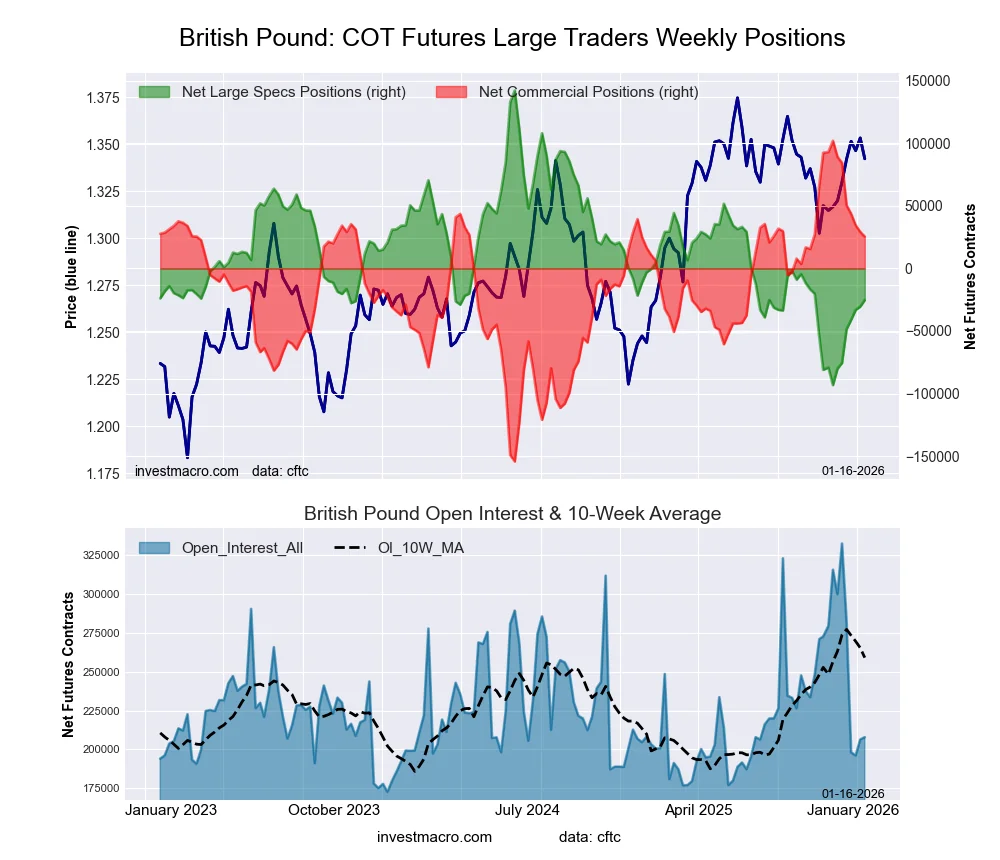 The British Pound Sterling large speculator standing this week recorded a net position of -25,270 contracts in the data reported through Tuesday. This was a weekly lift of 5,268 contracts from the previous week which had a total of -30,538 net contracts.
This week’s current strength score (the trader positioning range over the past three years, measured from 0 to 100) shows the speculators are currently Bearish with a score of 28.9 percent. The commercials are Bullish with a score of 70.2 percent and the small traders (not shown in chart) are Bullish with a score of 52.6 percent.
Price Trend-Following Model: Weak Downtrend
Our weekly trend-following model classifies the current market price position as: Weak Downtrend.
| BRITISH POUND Statistics | SPECULATORS | COMMERCIALS | SMALL TRADERS |
| – Percent of Open Interest Longs: | 38.0 | 46.8 | 13.9 |
| – Percent of Open Interest Shorts: | 50.2 | 34.5 | 14.0 |
| – Net Position: | -25,270 | 25,504 | -234 |
| – Gross Longs: | 79,003 | 97,243 | 28,832 |
| – Gross Shorts: | 104,273 | 71,739 | 29,066 |
| – Long to Short Ratio: | 0.8 to 1 | 1.4 to 1 | 1.0 to 1 |
| NET POSITION TREND: | | | |
| – Strength Index Score (3 Year Range Pct): | 28.9 | 70.2 | 52.6 |
| – Strength Index Reading (3 Year Range): | Bearish | Bullish | Bullish |
| NET POSITION MOVEMENT INDEX: | | | |
| – 6-Week Change in Strength Index: | 23.3 | -24.9 | 22.9 |
Japanese Yen Futures:
 The Japanese Yen large speculator standing this week recorded a net position of -45,164 contracts in the data reported through Tuesday. This was a weekly decline of -53,979 contracts from the previous week which had a total of 8,815 net contracts.
This week’s current strength score (the trader positioning range over the past three years, measured from 0 to 100) shows the speculators are currently Bearish with a score of 38.3 percent. The commercials are Bullish with a score of 62.5 percent and the small traders (not shown in chart) are Bearish with a score of 35.2 percent.
Price Trend-Following Model: Downtrend
Our weekly trend-following model classifies the current market price position as: Downtrend.
| JAPANESE YEN Statistics | SPECULATORS | COMMERCIALS | SMALL TRADERS |
| – Percent of Open Interest Longs: | 38.0 | 38.8 | 15.1 |
| – Percent of Open Interest Shorts: | 53.3 | 23.3 | 15.3 |
| – Net Position: | -45,164 | 45,819 | -655 |
| – Gross Longs: | 111,743 | 114,303 | 44,360 |
| – Gross Shorts: | 156,907 | 68,484 | 45,015 |
| – Long to Short Ratio: | 0.7 to 1 | 1.7 to 1 | 1.0 to 1 |
| NET POSITION TREND: | | | |
| – Strength Index Score (3 Year Range Pct): | 38.3 | 62.5 | 35.2 |
| – Strength Index Reading (3 Year Range): | Bearish | Bullish | Bearish |
| NET POSITION MOVEMENT INDEX: | | | |
| – 6-Week Change in Strength Index: | -22.4 | 21.2 | -6.1 |
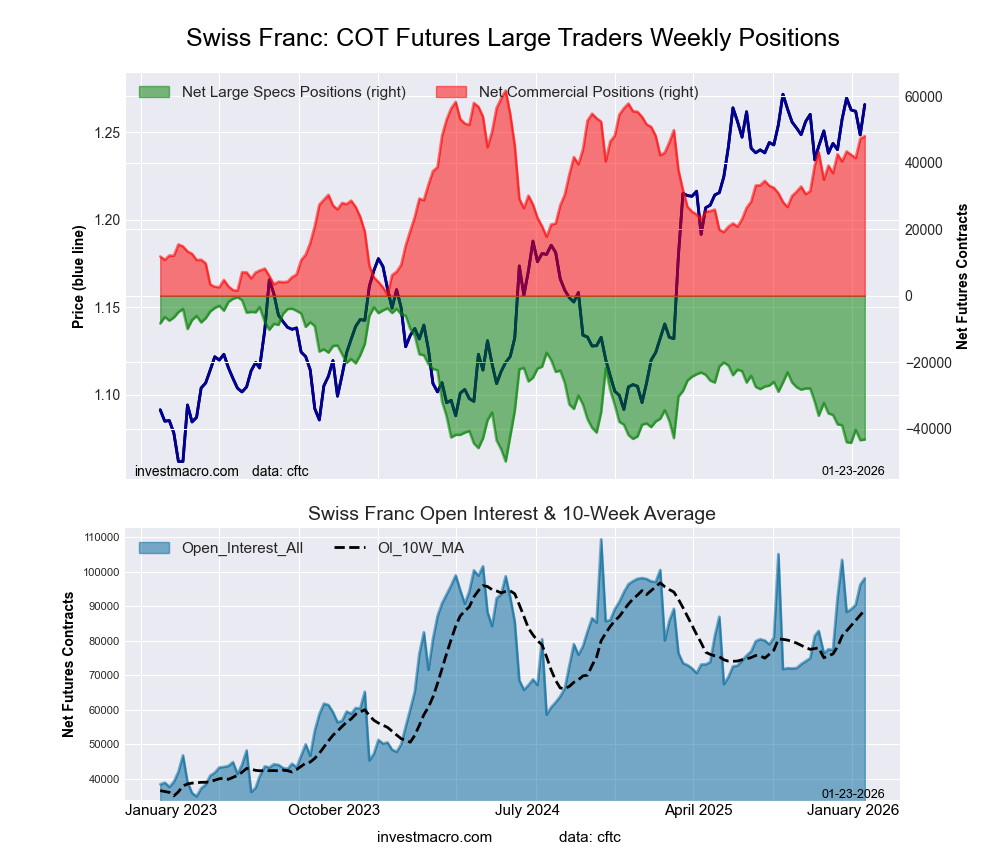
Swiss Franc Futures:
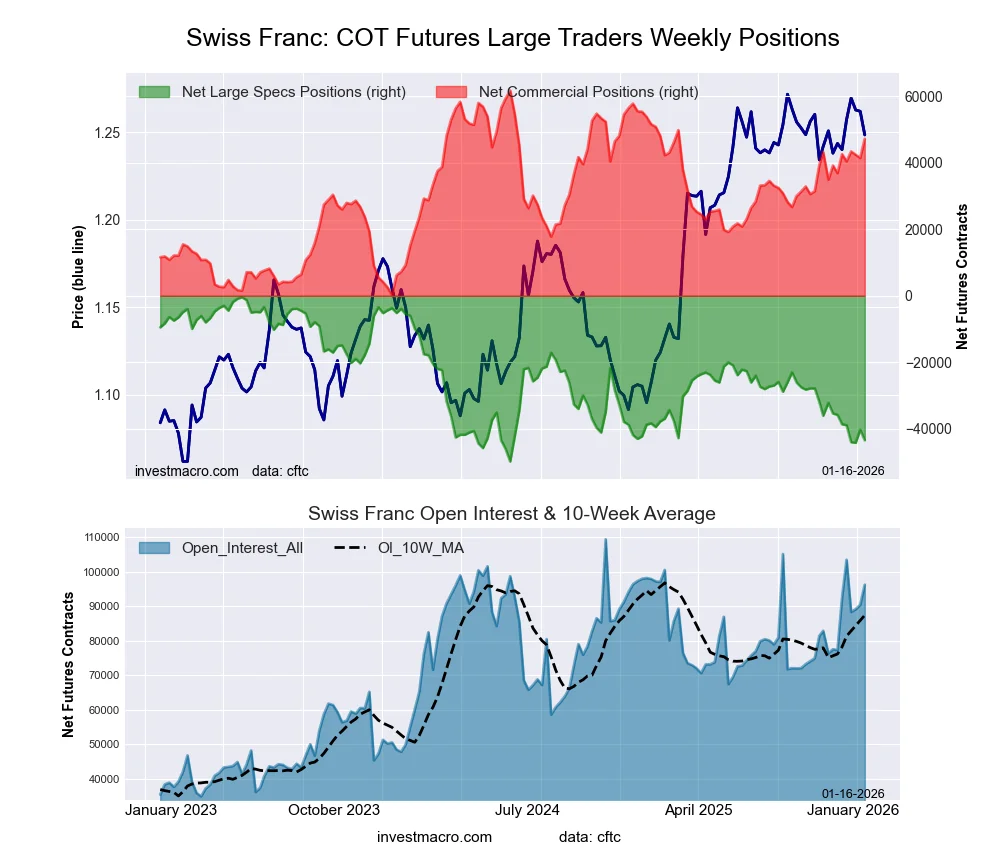 The Swiss Franc large speculator standing this week recorded a net position of -43,392 contracts in the data reported through Tuesday. This was a weekly decrease of -3,126 contracts from the previous week which had a total of -40,266 net contracts.
This week’s current strength score (the trader positioning range over the past three years, measured from 0 to 100) shows the speculators are currently Bearish-Extreme with a score of 13.0 percent. The commercials are Bullish with a score of 76.4 percent and the small traders (not shown in chart) are Bullish with a score of 62.8 percent.
Price Trend-Following Model: Weak Uptrend
Our weekly trend-following model classifies the current market price position as: Weak Uptrend.
| SWISS FRANC Statistics | SPECULATORS | COMMERCIALS | SMALL TRADERS |
| – Percent of Open Interest Longs: | 13.9 | 71.5 | 14.5 |
| – Percent of Open Interest Shorts: | 59.0 | 22.5 | 18.4 |
| – Net Position: | -43,392 | 47,163 | -3,771 |
| – Gross Longs: | 13,395 | 68,778 | 13,977 |
| – Gross Shorts: | 56,787 | 21,615 | 17,748 |
| – Long to Short Ratio: | 0.2 to 1 | 3.2 to 1 | 0.8 to 1 |
| NET POSITION TREND: | | | |
| – Strength Index Score (3 Year Range Pct): | 13.0 | 76.4 | 62.8 |
| – Strength Index Reading (3 Year Range): | Bearish-Extreme | Bullish | Bullish |
| NET POSITION MOVEMENT INDEX: | | | |
| – 6-Week Change in Strength Index: | -15.4 | 16.8 | -11.5 |
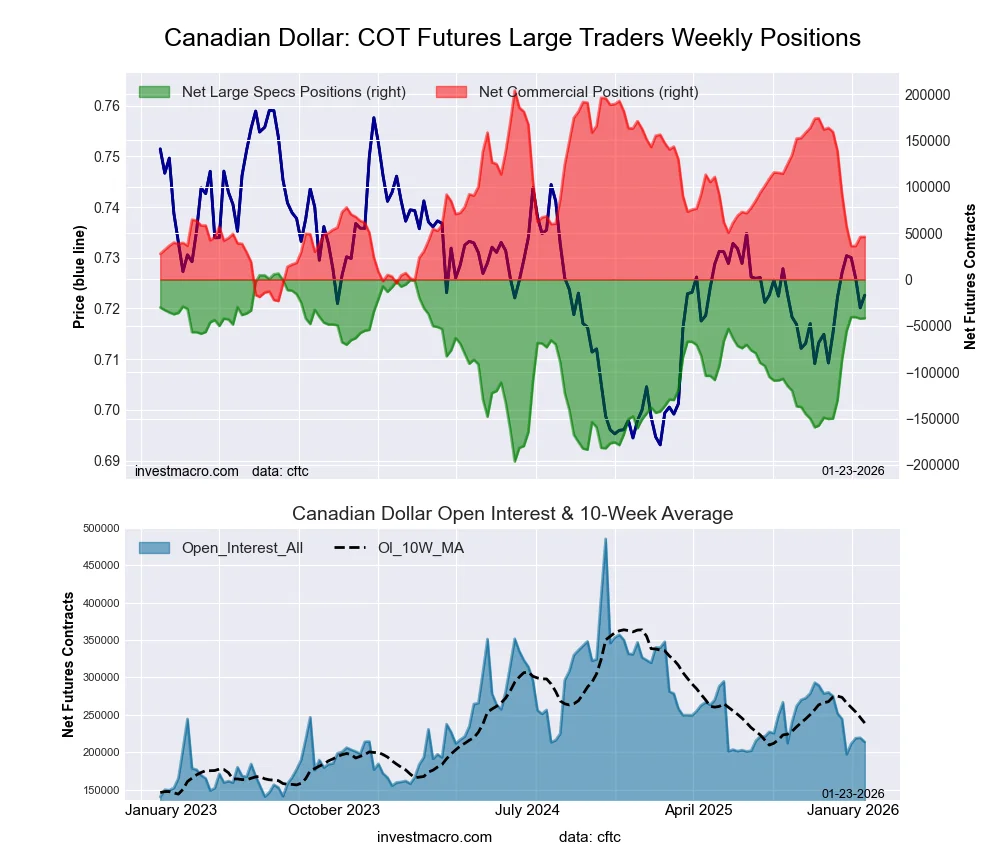
Canadian Dollar Futures:
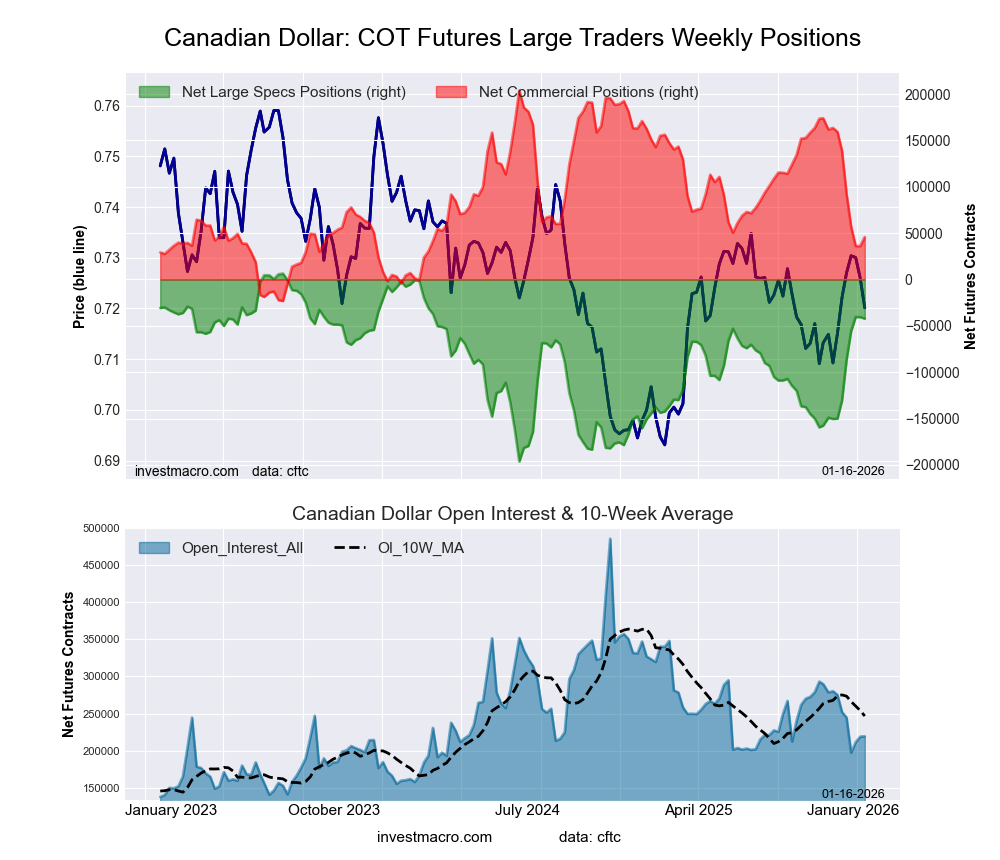 The Canadian Dollar large speculator standing this week recorded a net position of -42,250 contracts in the data reported through Tuesday. This was a weekly decline of -1,665 contracts from the previous week which had a total of -40,585 net contracts.
This week’s current strength score (the trader positioning range over the past three years, measured from 0 to 100) shows the speculators are currently Bullish with a score of 76.0 percent. The commercials are Bearish with a score of 30.4 percent and the small traders (not shown in chart) are Bearish with a score of 35.4 percent.
Price Trend-Following Model: Weak Uptrend
Our weekly trend-following model classifies the current market price position as: Weak Uptrend.
| CANADIAN DOLLAR Statistics | SPECULATORS | COMMERCIALS | SMALL TRADERS |
| – Percent of Open Interest Longs: | 28.6 | 55.7 | 12.8 |
| – Percent of Open Interest Shorts: | 47.9 | 34.8 | 14.4 |
| – Net Position: | -42,250 | 45,815 | -3,565 |
| – Gross Longs: | 62,705 | 122,096 | 28,109 |
| – Gross Shorts: | 104,955 | 76,281 | 31,674 |
| – Long to Short Ratio: | 0.6 to 1 | 1.6 to 1 | 0.9 to 1 |
| NET POSITION TREND: | | | |
| – Strength Index Score (3 Year Range Pct): | 76.0 | 30.4 | 35.4 |
| – Strength Index Reading (3 Year Range): | Bullish | Bearish | Bearish |
| NET POSITION MOVEMENT INDEX: | | | |
| – 6-Week Change in Strength Index: | 53.2 | -49.9 | 15.5 |
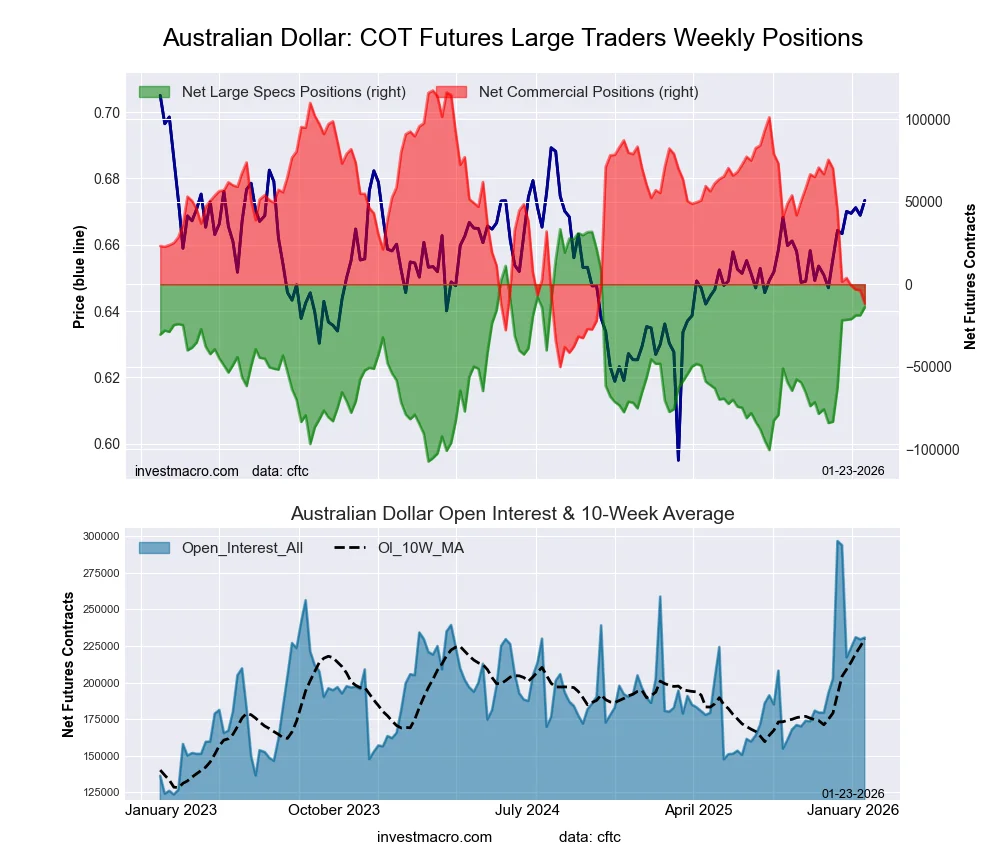
Australian Dollar Futures:
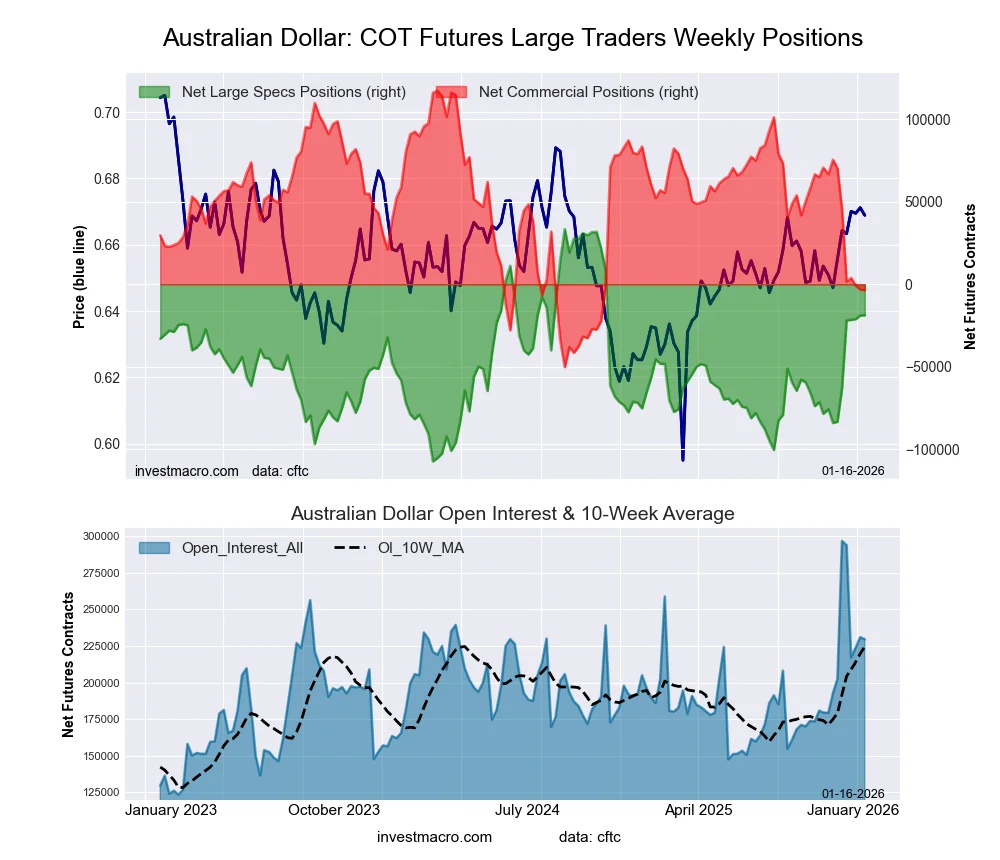 The Australian Dollar large speculator standing this week recorded a net position of -18,846 contracts in the data reported through Tuesday. This was a weekly advance of 114 contracts from the previous week which had a total of -18,960 net contracts.
This week’s current strength score (the trader positioning range over the past three years, measured from 0 to 100) shows the speculators are currently Bullish with a score of 62.9 percent. The commercials are Bearish with a score of 27.8 percent and the small traders (not shown in chart) are Bullish-Extreme with a score of 100.0 percent.
Price Trend-Following Model: Strong Uptrend
Our weekly trend-following model classifies the current market price position as: Strong Uptrend.
| AUSTRALIAN DOLLAR Statistics | SPECULATORS | COMMERCIALS | SMALL TRADERS |
| – Percent of Open Interest Longs: | 36.6 | 45.0 | 17.3 |
| – Percent of Open Interest Shorts: | 44.8 | 46.6 | 7.6 |
| – Net Position: | -18,846 | -3,610 | 22,456 |
| – Gross Longs: | 83,955 | 103,295 | 39,790 |
| – Gross Shorts: | 102,801 | 106,905 | 17,334 |
| – Long to Short Ratio: | 0.8 to 1 | 1.0 to 1 | 2.3 to 1 |
| NET POSITION TREND: | | | |
| – Strength Index Score (3 Year Range Pct): | 62.9 | 27.8 | 100.0 |
| – Strength Index Reading (3 Year Range): | Bullish | Bearish | Bullish-Extreme |
| NET POSITION MOVEMENT INDEX: | | | |
| – 6-Week Change in Strength Index: | 45.8 | -44.0 | 22.7 |
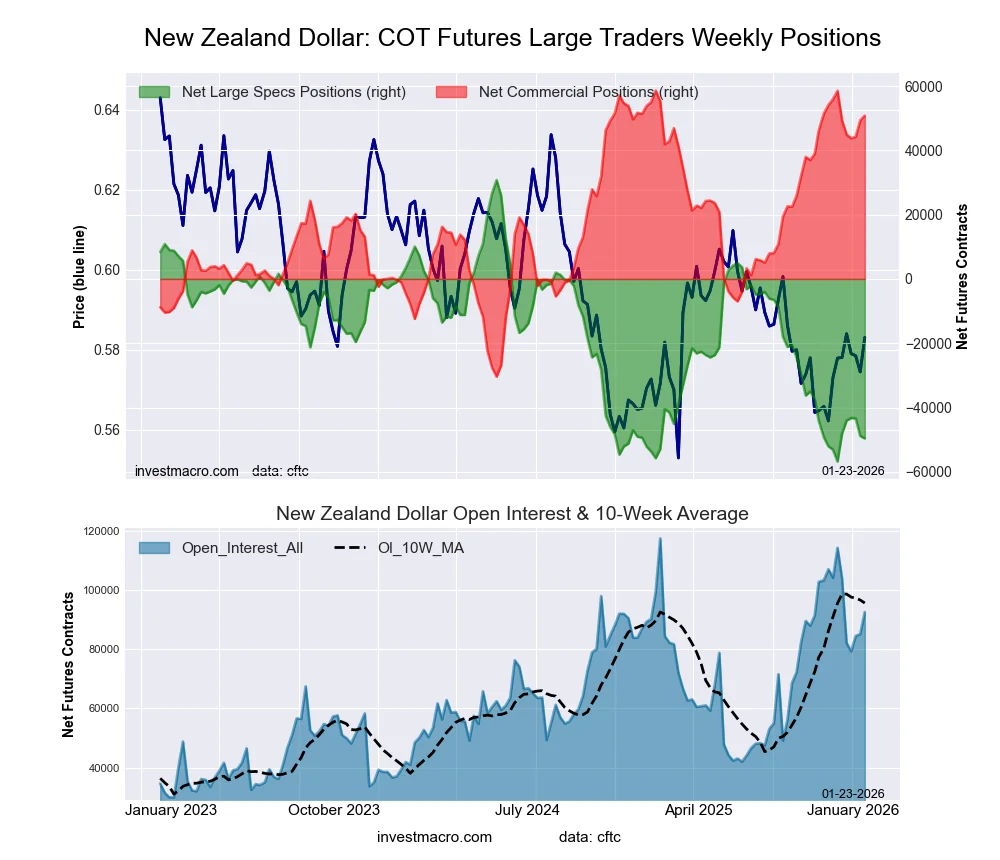
New Zealand Dollar Futures:
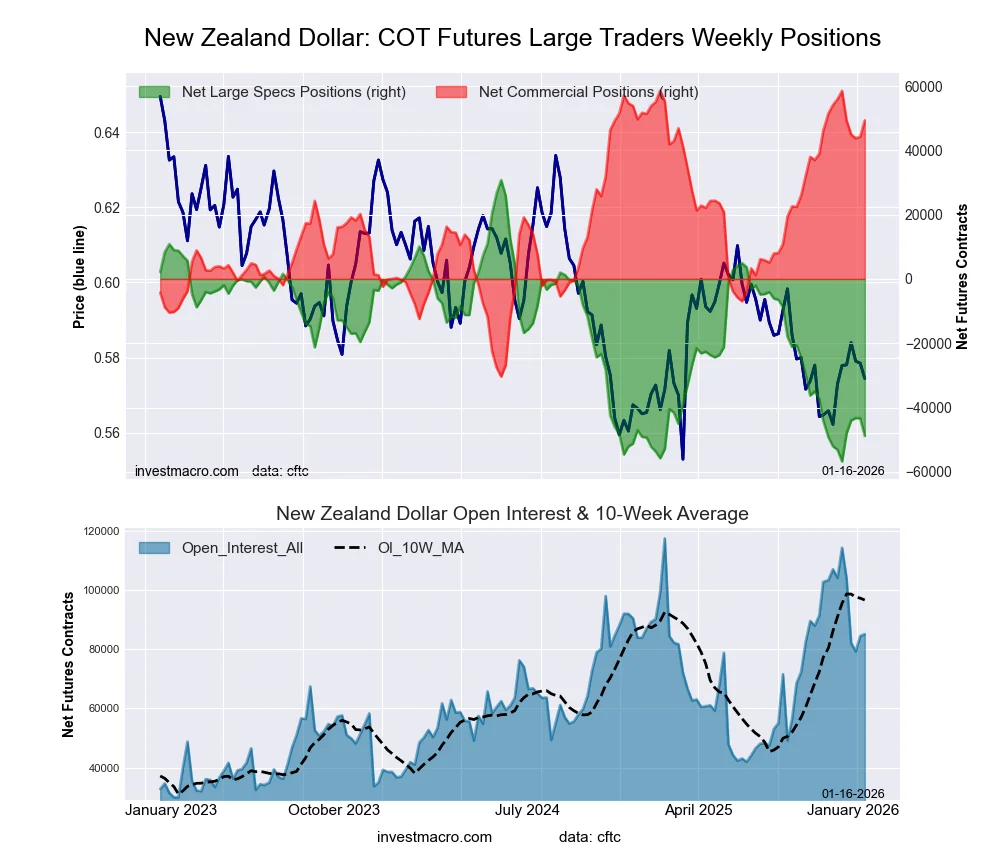 The New Zealand Dollar large speculator standing this week recorded a net position of -48,851 contracts in the data reported through Tuesday. This was a weekly reduction of -5,488 contracts from the previous week which had a total of -43,363 net contracts.
This week’s current strength score (the trader positioning range over the past three years, measured from 0 to 100) shows the speculators are currently Bearish-Extreme with a score of 9.1 percent. The commercials are Bullish-Extreme with a score of 89.6 percent and the small traders (not shown in chart) are Bearish with a score of 45.7 percent.
Price Trend-Following Model: Downtrend
Our weekly trend-following model classifies the current market price position as: Downtrend.
| NEW ZEALAND DOLLAR Statistics | SPECULATORS | COMMERCIALS | SMALL TRADERS |
| – Percent of Open Interest Longs: | 11.3 | 81.8 | 4.7 |
| – Percent of Open Interest Shorts: | 68.6 | 23.8 | 5.3 |
| – Net Position: | -48,851 | 49,362 | -511 |
| – Gross Longs: | 9,613 | 69,662 | 4,002 |
| – Gross Shorts: | 58,464 | 20,300 | 4,513 |
| – Long to Short Ratio: | 0.2 to 1 | 3.4 to 1 | 0.9 to 1 |
| NET POSITION TREND: | | | |
| – Strength Index Score (3 Year Range Pct): | 9.1 | 89.6 | 45.7 |
| – Strength Index Reading (3 Year Range): | Bearish-Extreme | Bullish-Extreme | Bearish |
| NET POSITION MOVEMENT INDEX: | | | |
| – 6-Week Change in Strength Index: | 4.9 | -7.4 | 29.9 |
Mexican Peso Futures:
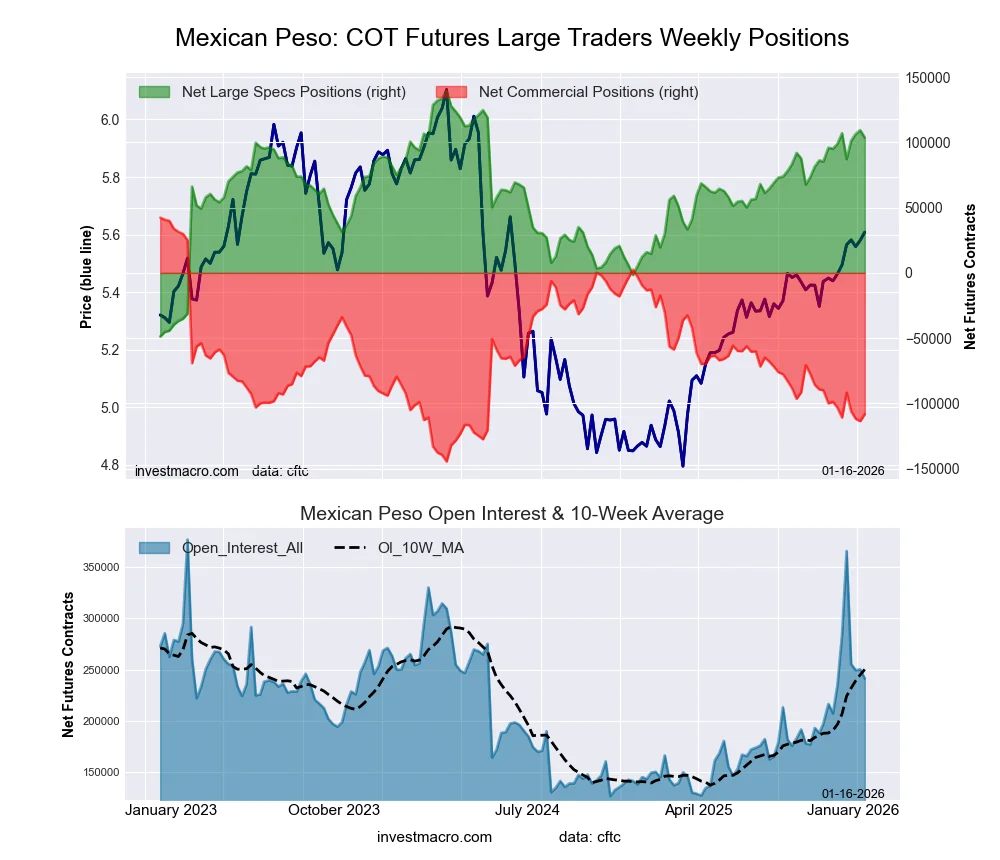 The Mexican Peso large speculator standing this week recorded a net position of 103,558 contracts in the data reported through Tuesday. This was a weekly lowering of -5,743 contracts from the previous week which had a total of 109,301 net contracts.
This week’s current strength score (the trader positioning range over the past three years, measured from 0 to 100) shows the speculators are currently Bullish-Extreme with a score of 80.8 percent. The commercials are Bearish-Extreme with a score of 19.4 percent and the small traders (not shown in chart) are Bearish with a score of 48.4 percent.
Price Trend-Following Model: Strong Uptrend
Our weekly trend-following model classifies the current market price position as: Strong Uptrend.
| MEXICAN PESO Statistics | SPECULATORS | COMMERCIALS | SMALL TRADERS |
| – Percent of Open Interest Longs: | 63.7 | 33.1 | 3.0 |
| – Percent of Open Interest Shorts: | 20.8 | 77.9 | 1.1 |
| – Net Position: | 103,558 | -108,180 | 4,622 |
| – Gross Longs: | 153,670 | 79,940 | 7,287 |
| – Gross Shorts: | 50,112 | 188,120 | 2,665 |
| – Long to Short Ratio: | 3.1 to 1 | 0.4 to 1 | 2.7 to 1 |
| NET POSITION TREND: | | | |
| – Strength Index Score (3 Year Range Pct): | 80.8 | 19.4 | 48.4 |
| – Strength Index Reading (3 Year Range): | Bullish-Extreme | Bearish-Extreme | Bearish |
| NET POSITION MOVEMENT INDEX: | | | |
| – 6-Week Change in Strength Index: | 2.5 | -2.6 | 1.2 |
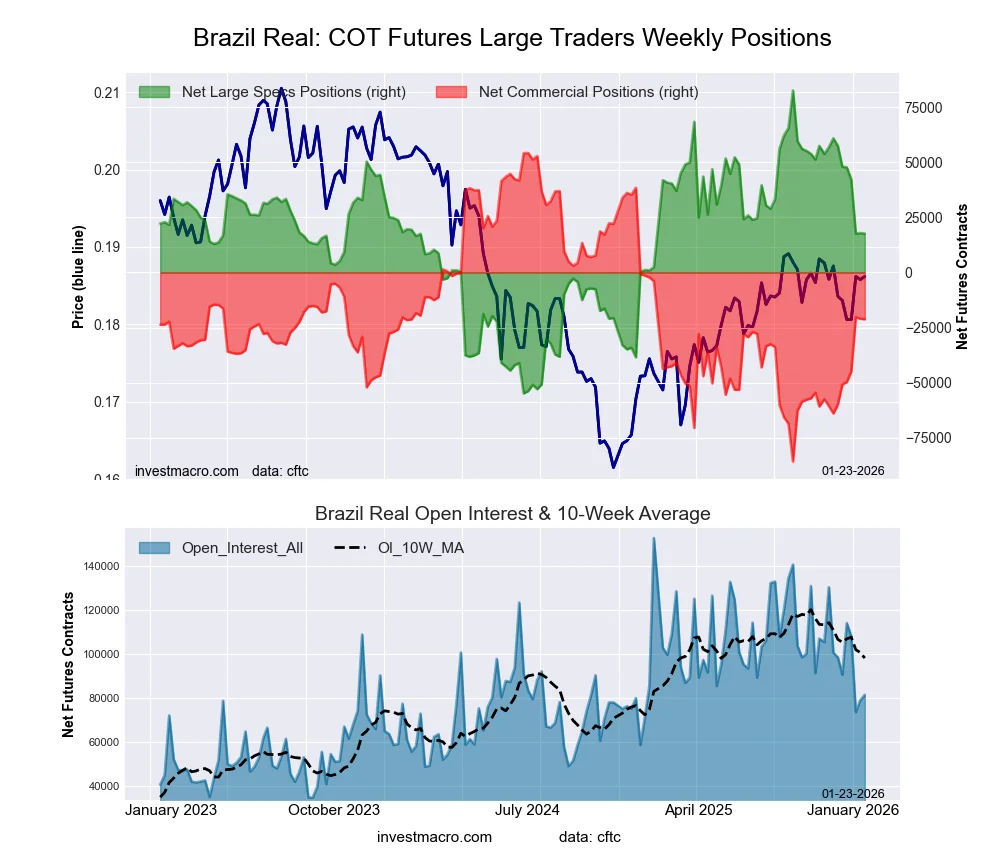
Brazilian Real Futures:
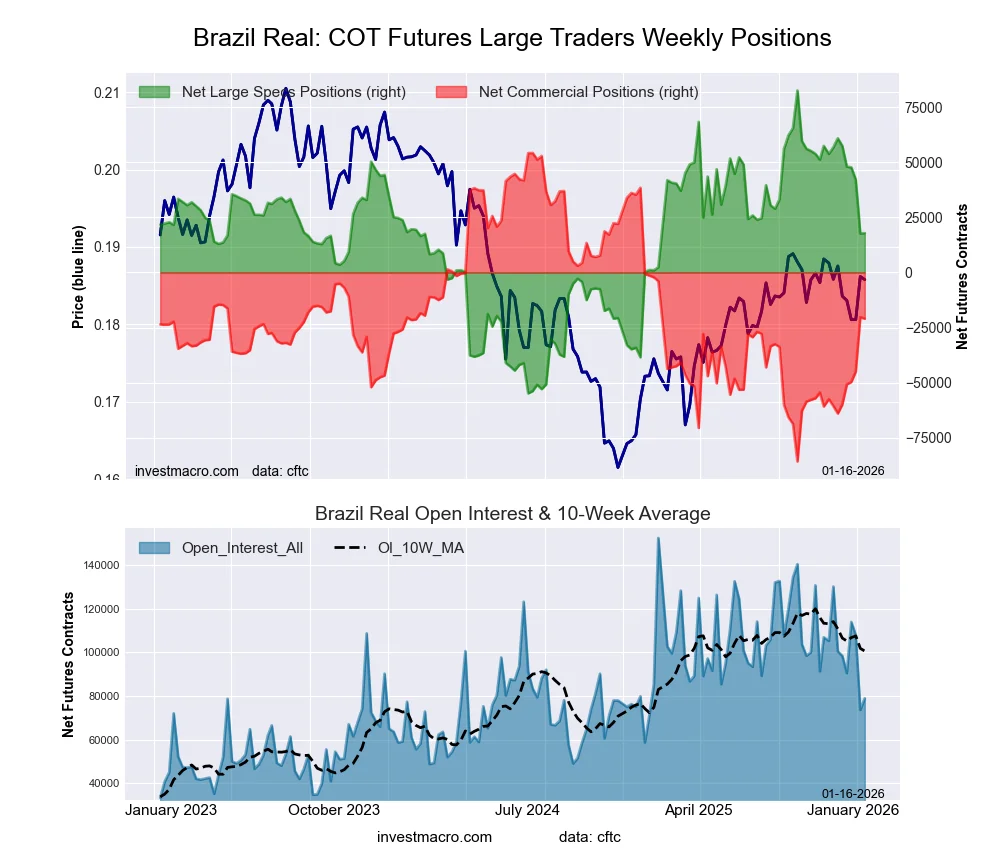 The Brazilian Real large speculator standing this week recorded a net position of 17,874 contracts in the data reported through Tuesday. This was a weekly boost of 257 contracts from the previous week which had a total of 17,617 net contracts.
This week’s current strength score (the trader positioning range over the past three years, measured from 0 to 100) shows the speculators are currently Bullish with a score of 52.9 percent. The commercials are Bearish with a score of 46.3 percent and the small traders (not shown in chart) are Bearish with a score of 38.5 percent.
Price Trend-Following Model: Weak Downtrend
Our weekly trend-following model classifies the current market price position as: Weak Downtrend.
| BRAZIL REAL Statistics | SPECULATORS | COMMERCIALS | SMALL TRADERS |
| – Percent of Open Interest Longs: | 66.3 | 27.5 | 5.1 |
| – Percent of Open Interest Shorts: | 43.7 | 54.1 | 1.1 |
| – Net Position: | 17,874 | -21,003 | 3,129 |
| – Gross Longs: | 52,400 | 21,753 | 4,017 |
| – Gross Shorts: | 34,526 | 42,756 | 888 |
| – Long to Short Ratio: | 1.5 to 1 | 0.5 to 1 | 4.5 to 1 |
| NET POSITION TREND: | | | |
| – Strength Index Score (3 Year Range Pct): | 52.9 | 46.3 | 38.5 |
| – Strength Index Reading (3 Year Range): | Bullish | Bearish | Bearish |
| NET POSITION MOVEMENT INDEX: | | | |
| – 6-Week Change in Strength Index: | -31.3 | 30.7 | -0.2 |
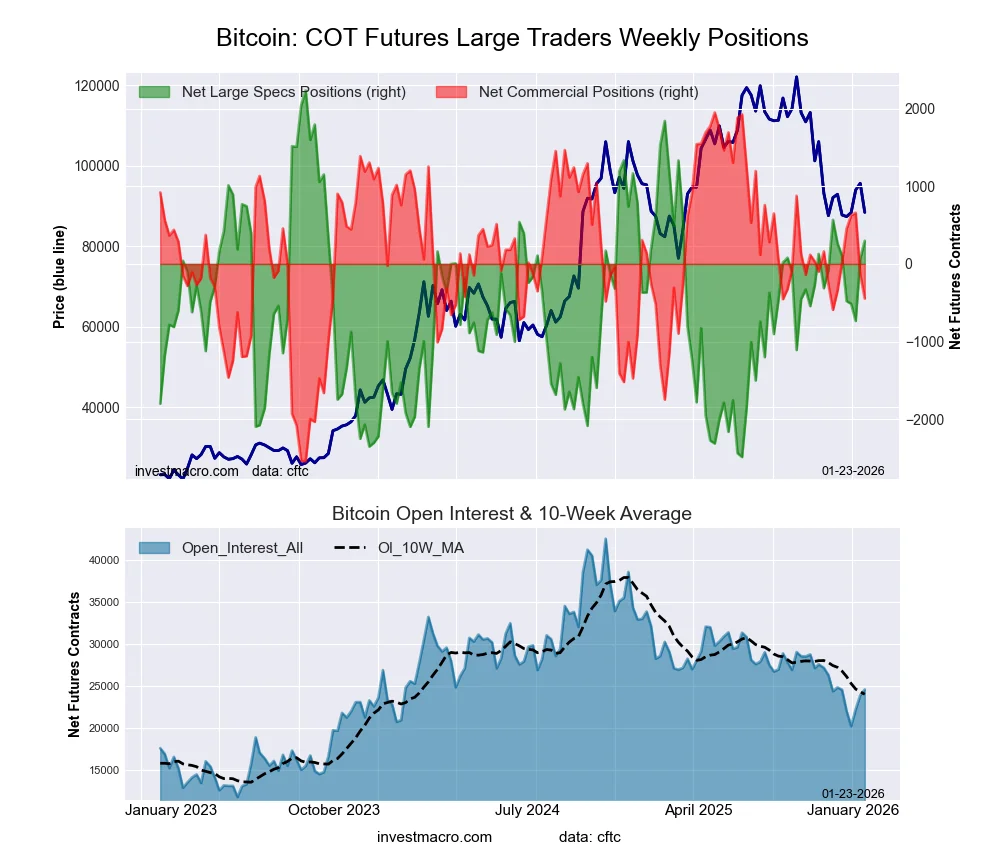
Bitcoin Futures:
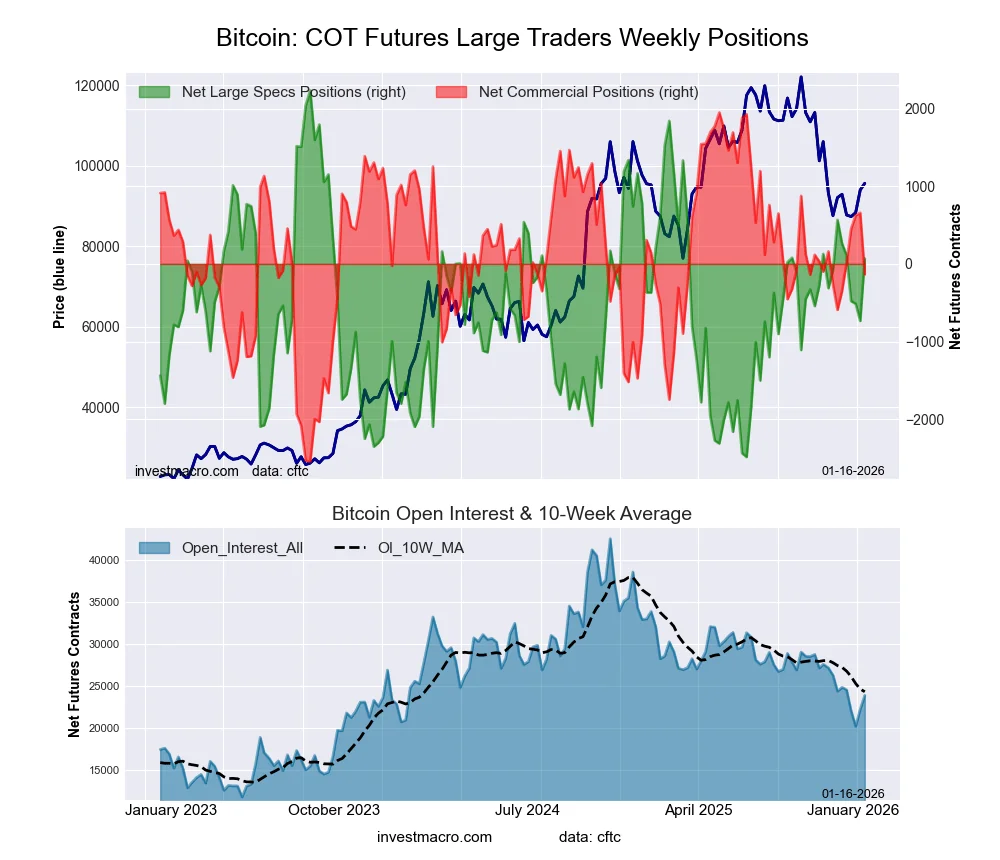 The Bitcoin large speculator standing this week recorded a net position of 69 contracts in the data reported through Tuesday. This was a weekly increase of 803 contracts from the previous week which had a total of -734 net contracts.
This week’s current strength score (the trader positioning range over the past three years, measured from 0 to 100) shows the speculators are currently Bullish with a score of 54.2 percent. The commercials are Bullish with a score of 53.6 percent and the small traders (not shown in chart) are Bearish with a score of 40.7 percent.
Price Trend-Following Model: Downtrend
Our weekly trend-following model classifies the current market price position as: Downtrend.
| BITCOIN Statistics | SPECULATORS | COMMERCIALS | SMALL TRADERS |
| – Percent of Open Interest Longs: | 80.2 | 5.3 | 5.0 |
| – Percent of Open Interest Shorts: | 79.9 | 5.8 | 4.8 |
| – Net Position: | 69 | -134 | 65 |
| – Gross Longs: | 19,118 | 1,257 | 1,204 |
| – Gross Shorts: | 19,049 | 1,391 | 1,139 |
| – Long to Short Ratio: | 1.0 to 1 | 0.9 to 1 | 1.1 to 1 |
| NET POSITION TREND: | | | |
| – Strength Index Score (3 Year Range Pct): | 54.2 | 53.6 | 40.7 |
| – Strength Index Reading (3 Year Range): | Bullish | Bullish | Bearish |
| NET POSITION MOVEMENT INDEX: | | | |
| – 6-Week Change in Strength Index: | -10.6 | 10.2 | 2.1 |
Article By InvestMacro – Receive our weekly COT Newsletter
*COT Report: The COT data, released weekly to the public each Friday, is updated through the most recent Tuesday (data is 3 days old) and shows a quick view of how large speculators or non-commercials (for-profit traders) were positioned in the futures markets.
The CFTC categorizes trader positions according to commercial hedgers (traders who use futures contracts for hedging as part of the business), non-commercials (large traders who speculate to realize trading profits) and nonreportable traders (usually small traders/speculators) as well as their open interest (contracts open in the market at time of reporting). See CFTC criteria here.











 Article by