Archive for Financial News – Page 280

Bonds Weekly Speculator Bets led by Eurodollar and 10-Year Bond

By InvestMacro

Here are the latest charts and statistics for the Commitment of Traders (COT) reports data published by the Commodities Futures Trading Commission (CFTC).

The latest COT data is updated through Tuesday October 25th and shows a quick view of how large traders (for-profit speculators and commercial hedgers) were positioned in the futures markets.

Weekly Speculator Changes led by Eurodollar and 10-Year Bond
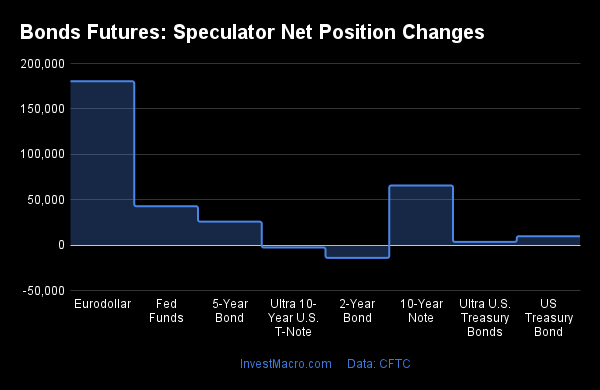
The COT bond market speculator bets were higher this week as six out of the eight bond markets we cover had higher positioning this week while two markets had lower contracts.

Leading the weekly gains for the bond markets was the Eurodollar (180,417 contracts) with the 10-Year Bond (65,690 contracts), the Fed Funds (42,830 contracts), the 5-Year Bond (25,832 contracts), the Long US Bond (9,780 contracts) and the Ultra US Bond (3,496 contracts)also showing a positive week.

The bond markets leading the weekly declines in speculator bets this week was the 2-Year Bond (-14,084 contracts) with the Ultra 10-Year (-2,695 contracts) also realizing lower bets on the week.


Data Snapshot of Bond Market Traders | Columns Legend
Oct-25-2022OIOI-IndexSpec-NetSpec-IndexCom-NetCOM-IndexSmalls-NetSmalls-Index
Eurodollar8,016,2420-1,896,658182,000,71977-104,06182
FedFunds1,710,3956072,35149-64,83852-7,51341
2-Year2,133,13515-349,59612421,36396-71,76720
Long T-Bond1,223,91448-76,5596047,9042828,65575
10-Year3,929,01060-247,74835296,69257-48,94468
5-Year4,087,74856-461,74516546,15780-84,41258


Strength Scores led by US Long Treasury Bond
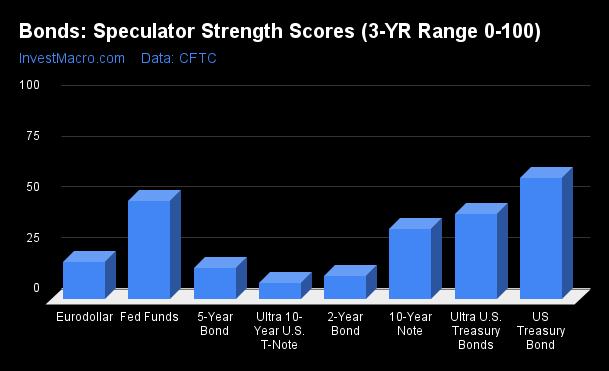
Strength Scores (a normalized measure of Speculator positions over a 3-Year range, from 0 to 100 where above 80 is extreme bullish and below 20 is extreme bearish) showed that the US Treasury Bond (59.7 percent) continues to lead the bonds category this week.

On the downside, the Ultra 10-Year Bond (8.2 percent), the 2-Year Bond (11.7 percent), 5-Year Bond (15.7 percent) and the Eurodollar (18.2 percent) come in at the lowest strength levels currently and are all in bearish extreme positions (below 20 percent).

Strength Statistics:
Fed Funds (48.6 percent) vs Fed Funds previous week (43.3 percent)
2-Year Bond (11.7 percent) vs 2-Year Bond previous week (14.5 percent)
5-Year Bond (15.7 percent) vs 5-Year Bond previous week (11.8 percent)
10-Year Bond (34.8 percent) vs 10-Year Bond previous week (24.8 percent)
Ultra 10-Year Bond (8.2 percent) vs Ultra 10-Year Bond previous week (8.9 percent)
US Treasury Bond (59.7 percent) vs US Treasury Bond previous week (56.5 percent)
Ultra US Treasury Bond (42.0 percent) vs Ultra US Treasury Bond previous week (40.6 percent)
Eurodollar (18.2 percent) vs Eurodollar previous week (14.9 percent)

Eurodollar leads the weekly Strength Trends
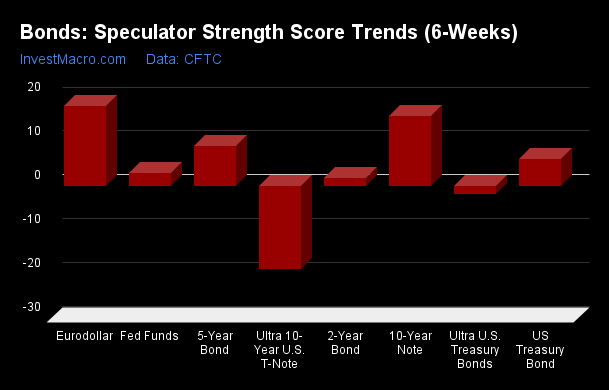
Strength Score Trends (or move index, calculates the 6-week changes in strength scores) showed that the Eurodollar (18.1 percent) leads the past six weeks trends for bonds. The 10-Year Bond (16.0 percent), the 5-Year Bond (9.0 percent)and the US Treasury Bond (6.0 percent) fill out the next top movers in the latest trends data.

The Ultra 10-Year Bond (-18.9 percent) leads the downside trend scores currently while the next market with lower trend scores was the Ultra US Treasury Bond (-1.8 percent).

Strength Trend Statistics:
Fed Funds (3.0 percent) vs Fed Funds previous week (1.3 percent)
2-Year Bond (1.7 percent) vs 2-Year Bond previous week (-1.8 percent)
5-Year Bond (9.0 percent) vs 5-Year Bond previous week (2.8 percent)
10-Year Bond (16.0 percent) vs 10-Year Bond previous week (9.6 percent)
Ultra 10-Year Bond (-18.9 percent) vs Ultra 10-Year Bond previous week (-14.0 percent)
US Treasury Bond (6.0 percent) vs US Treasury Bond previous week (-0.4 percent)
Ultra US Treasury Bond (-1.8 percent) vs Ultra US Treasury Bond previous week (1.2 percent)
Eurodollar (18.1 percent) vs Eurodollar previous week (13.0 percent)


Individual Bond Markets:

3-Month Eurodollars Futures:
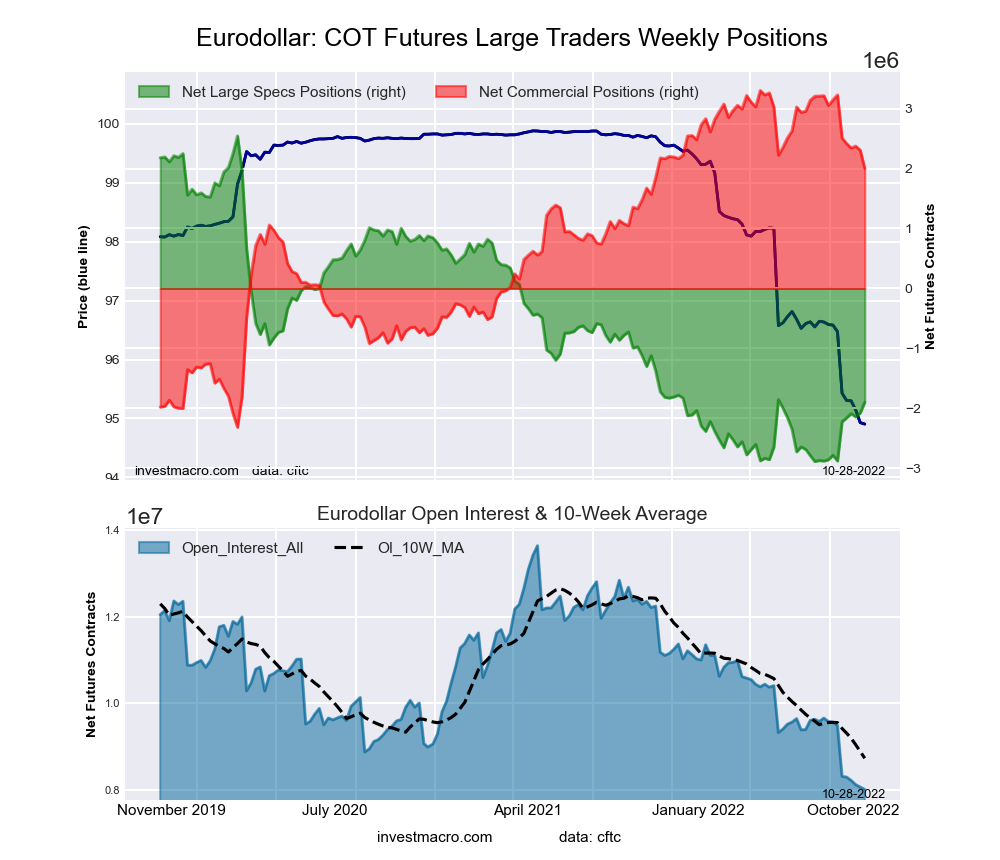
Eurodollar Bonds Futures COT ChartThe 3-Month Eurodollars large speculator standing this week totaled a net position of -1,896,658 contracts in the data reported through Tuesday. This was a weekly advance of 180,417 contracts from the previous week which had a total of -2,077,075 net contracts.

This week’s current strength score (the trader positioning range over the past three years, measured from 0 to 100) shows the speculators are currently Bearish-Extreme with a score of 18.2 percent. The commercials are Bullish with a score of 76.9 percent and the small traders (not shown in chart) are Bullish-Extreme with a score of 81.6 percent.

3-Month Eurodollars StatisticsSPECULATORSCOMMERCIALSSMALL TRADERS
– Percent of Open Interest Longs:8.065.87.2
– Percent of Open Interest Shorts:31.640.98.5
– Net Position:-1,896,6582,000,719-104,061
– Gross Longs:638,4845,275,368577,900
– Gross Shorts:2,535,1423,274,649681,961
– Long to Short Ratio:0.3 to 11.6 to 10.8 to 1
NET POSITION TREND:
– Strength Index Score (3 Year Range Pct):18.276.981.6
– Strength Index Reading (3 Year Range):Bearish-ExtremeBullishBullish-Extreme
NET POSITION MOVEMENT INDEX:
– 6-Week Change in Strength Index:18.1-21.854.1


30-Day Federal Funds Futures:

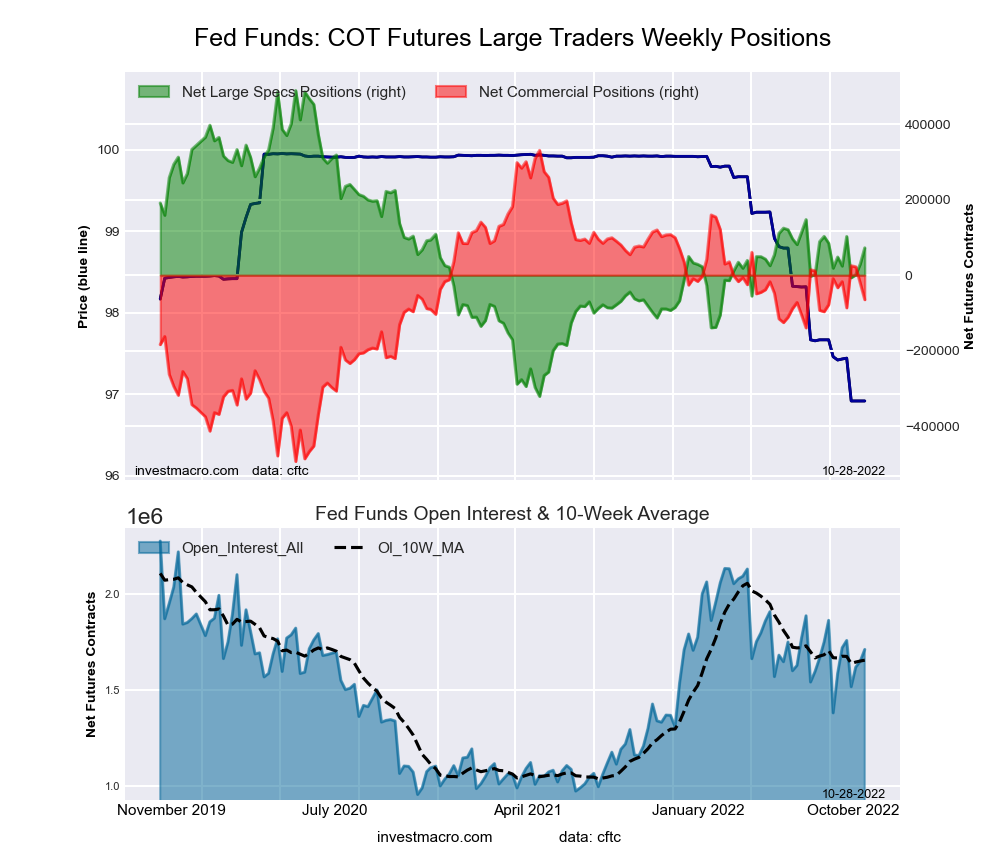
Federal Funds 30-Day Bonds Futures COT ChartThe 30-Day Federal Funds large speculator standing this week totaled a net position of 72,351 contracts in the data reported through Tuesday. This was a weekly advance of 42,830 contracts from the previous week which had a total of 29,521 net contracts.

This week’s current strength score (the trader positioning range over the past three years, measured from 0 to 100) shows the speculators are currently Bearish with a score of 48.6 percent. The commercials are Bullish with a score of 52.0 percent and the small traders (not shown in chart) are Bearish with a score of 40.5 percent.

30-Day Federal Funds StatisticsSPECULATORSCOMMERCIALSSMALL TRADERS
– Percent of Open Interest Longs:16.068.81.6
– Percent of Open Interest Shorts:11.772.62.1
– Net Position:72,351-64,838-7,513
– Gross Longs:273,1291,177,28227,698
– Gross Shorts:200,7781,242,12035,211
– Long to Short Ratio:1.4 to 10.9 to 10.8 to 1
NET POSITION TREND:
– Strength Index Score (3 Year Range Pct):48.652.040.5
– Strength Index Reading (3 Year Range):BearishBullishBearish
NET POSITION MOVEMENT INDEX:
– 6-Week Change in Strength Index:3.0-3.818.6


2-Year Treasury Note Futures:

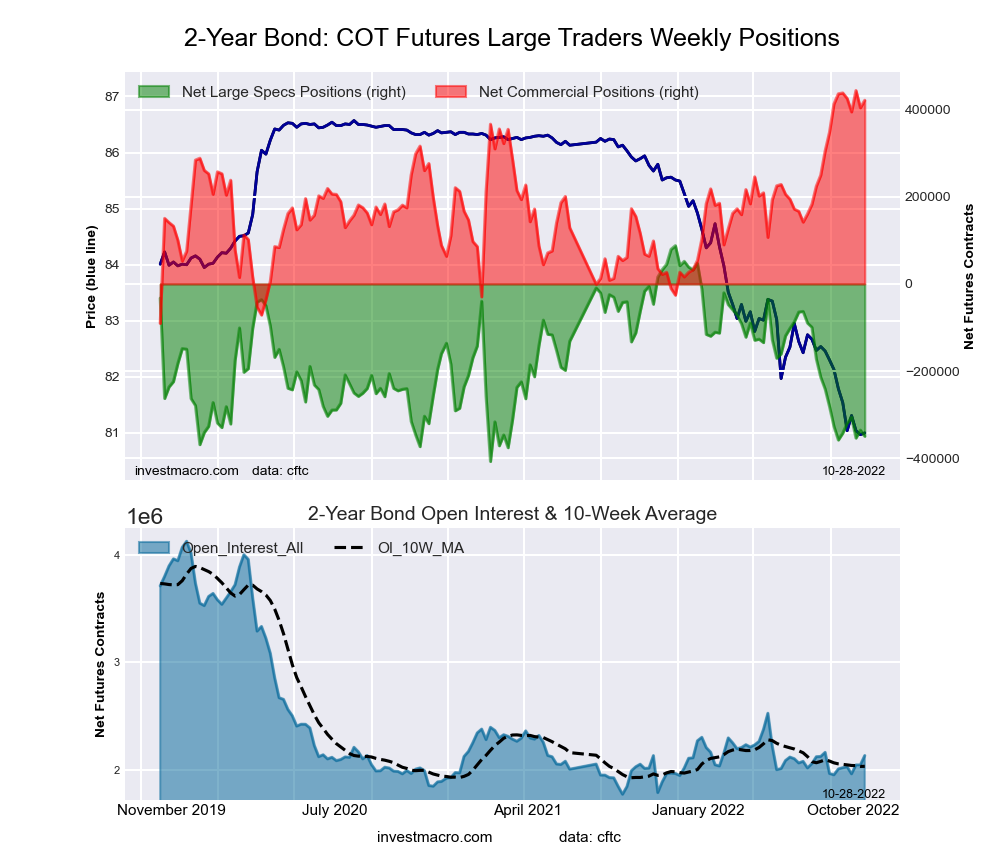
2-Year Treasury Bonds Futures COT ChartThe 2-Year Treasury Note large speculator standing this week totaled a net position of -349,596 contracts in the data reported through Tuesday. This was a weekly reduction of -14,084 contracts from the previous week which had a total of -335,512 net contracts.

This week’s current strength score (the trader positioning range over the past three years, measured from 0 to 100) shows the speculators are currently Bearish-Extreme with a score of 11.7 percent. The commercials are Bullish-Extreme with a score of 95.7 percent and the small traders (not shown in chart) are Bearish with a score of 20.0 percent.

2-Year Treasury Note StatisticsSPECULATORSCOMMERCIALSSMALL TRADERS
– Percent of Open Interest Longs:7.183.17.5
– Percent of Open Interest Shorts:23.563.410.9
– Net Position:-349,596421,363-71,767
– Gross Longs:151,5171,773,452159,922
– Gross Shorts:501,1131,352,089231,689
– Long to Short Ratio:0.3 to 11.3 to 10.7 to 1
NET POSITION TREND:
– Strength Index Score (3 Year Range Pct):11.795.720.0
– Strength Index Reading (3 Year Range):Bearish-ExtremeBullish-ExtremeBearish
NET POSITION MOVEMENT INDEX:
– 6-Week Change in Strength Index:1.7-2.92.8


5-Year Treasury Note Futures:

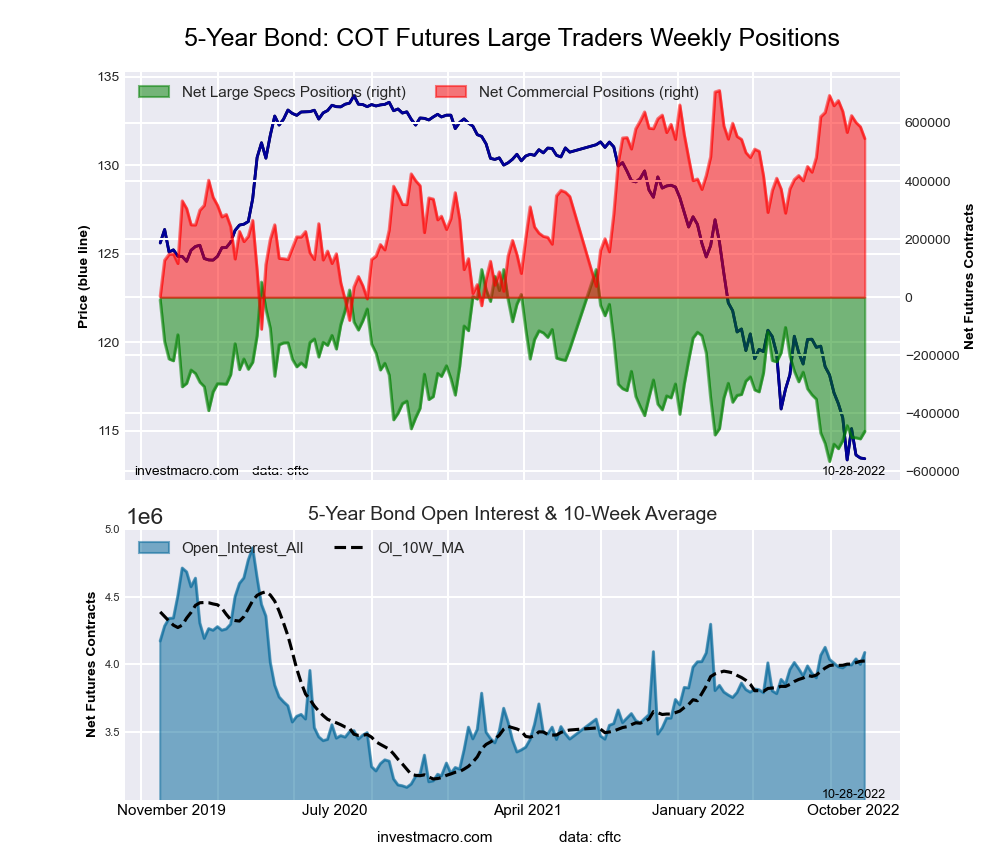
5-Year Treasury Bonds Futures COT ChartThe 5-Year Treasury Note large speculator standing this week totaled a net position of -461,745 contracts in the data reported through Tuesday. This was a weekly rise of 25,832 contracts from the previous week which had a total of -487,577 net contracts.

This week’s current strength score (the trader positioning range over the past three years, measured from 0 to 100) shows the speculators are currently Bearish-Extreme with a score of 15.7 percent. The commercials are Bullish with a score of 79.9 percent and the small traders (not shown in chart) are Bullish with a score of 57.9 percent.

5-Year Treasury Note StatisticsSPECULATORSCOMMERCIALSSMALL TRADERS
– Percent of Open Interest Longs:5.985.17.8
– Percent of Open Interest Shorts:17.271.89.9
– Net Position:-461,745546,157-84,412
– Gross Longs:239,3133,479,211320,339
– Gross Shorts:701,0582,933,054404,751
– Long to Short Ratio:0.3 to 11.2 to 10.8 to 1
NET POSITION TREND:
– Strength Index Score (3 Year Range Pct):15.779.957.9
– Strength Index Reading (3 Year Range):Bearish-ExtremeBullishBullish
NET POSITION MOVEMENT INDEX:
– 6-Week Change in Strength Index:9.0-15.919.5


10-Year Treasury Note Futures:

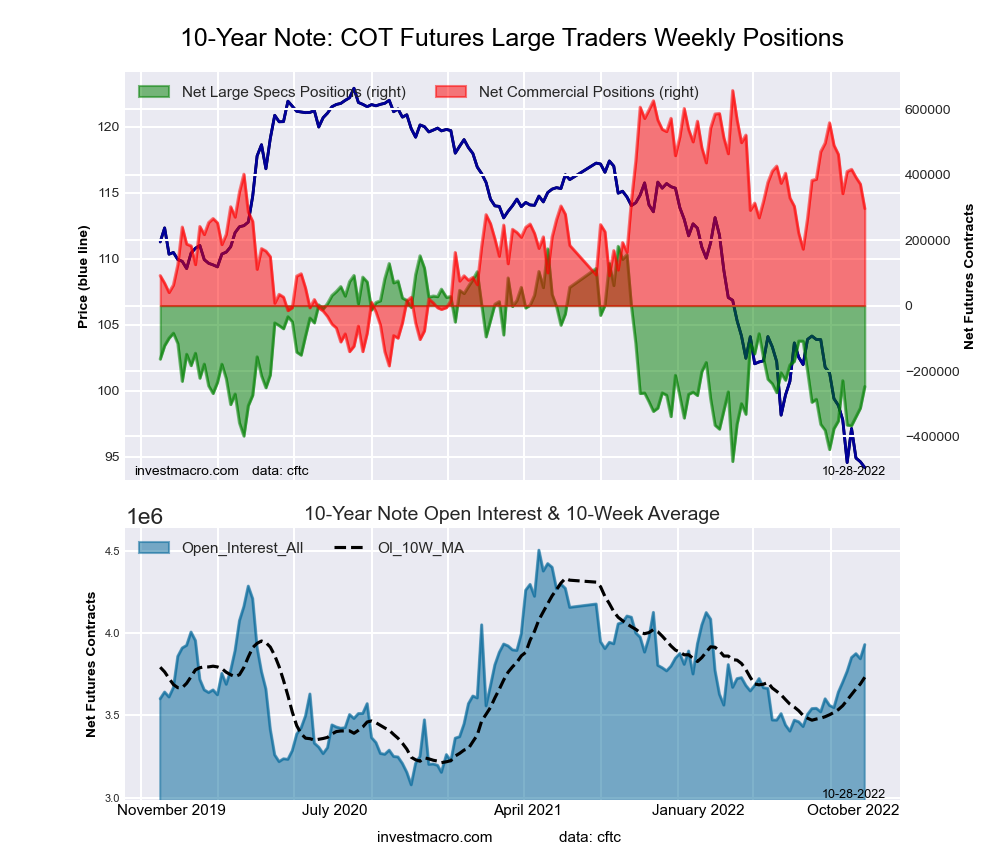
10-Year Treasury Notes Bonds Futures COT ChartThe 10-Year Treasury Note large speculator standing this week totaled a net position of -247,748 contracts in the data reported through Tuesday. This was a weekly increase of 65,690 contracts from the previous week which had a total of -313,438 net contracts.

This week’s current strength score (the trader positioning range over the past three years, measured from 0 to 100) shows the speculators are currently Bearish with a score of 34.8 percent. The commercials are Bullish with a score of 57.1 percent and the small traders (not shown in chart) are Bullish with a score of 68.4 percent.

10-Year Treasury Note StatisticsSPECULATORSCOMMERCIALSSMALL TRADERS
– Percent of Open Interest Longs:11.576.89.3
– Percent of Open Interest Shorts:17.969.310.5
– Net Position:-247,748296,692-48,944
– Gross Longs:453,6433,019,262363,812
– Gross Shorts:701,3912,722,570412,756
– Long to Short Ratio:0.6 to 11.1 to 10.9 to 1
NET POSITION TREND:
– Strength Index Score (3 Year Range Pct):34.857.168.4
– Strength Index Reading (3 Year Range):BearishBullishBullish
NET POSITION MOVEMENT INDEX:
– 6-Week Change in Strength Index:16.0-19.714.4


Ultra 10-Year Notes Futures:

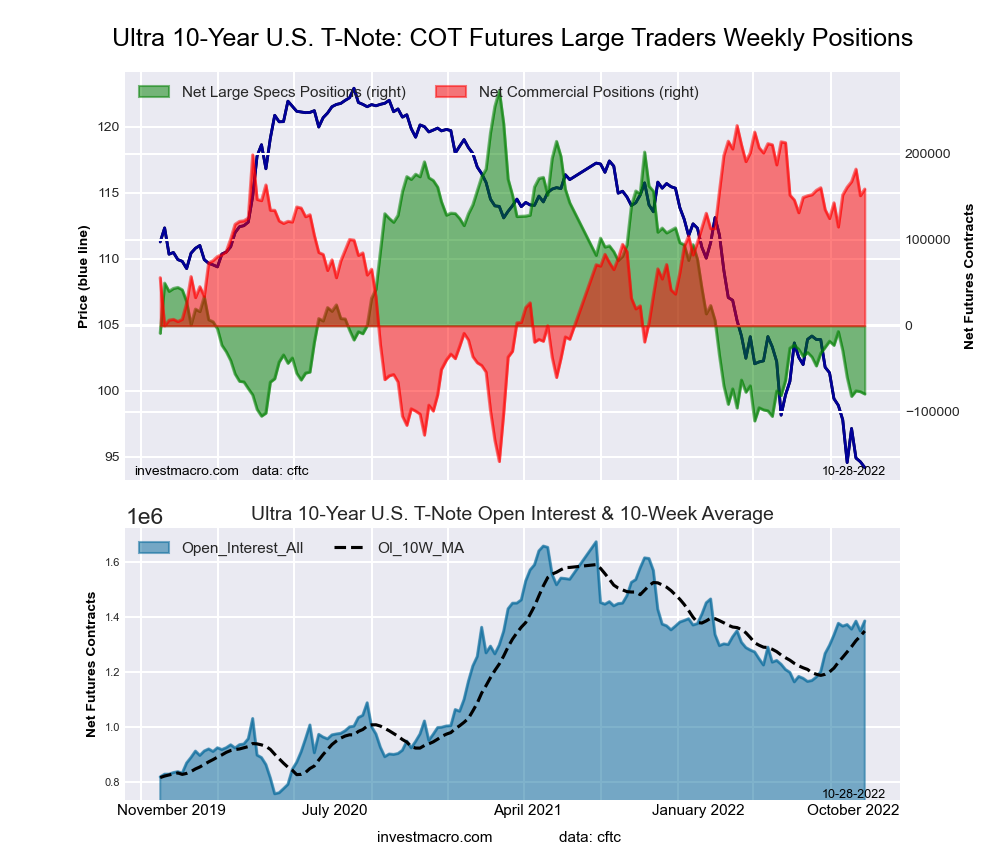
Ultra 10-Year Treasury Notes Bonds Futures COT ChartThe Ultra 10-Year Notes large speculator standing this week totaled a net position of -79,346 contracts in the data reported through Tuesday. This was a weekly lowering of -2,695 contracts from the previous week which had a total of -76,651 net contracts.

This week’s current strength score (the trader positioning range over the past three years, measured from 0 to 100) shows the speculators are currently Bearish-Extreme with a score of 8.2 percent. The commercials are Bullish-Extreme with a score of 81.1 percent and the small traders (not shown in chart) are Bullish with a score of 74.1 percent.

Ultra 10-Year Notes StatisticsSPECULATORSCOMMERCIALSSMALL TRADERS
– Percent of Open Interest Longs:7.281.210.9
– Percent of Open Interest Shorts:12.969.716.6
– Net Position:-79,346159,023-79,677
– Gross Longs:100,0261,124,960150,789
– Gross Shorts:179,372965,937230,466
– Long to Short Ratio:0.6 to 11.2 to 10.7 to 1
NET POSITION TREND:
– Strength Index Score (3 Year Range Pct):8.281.174.1
– Strength Index Reading (3 Year Range):Bearish-ExtremeBullish-ExtremeBullish
NET POSITION MOVEMENT INDEX:
– 6-Week Change in Strength Index:-18.911.318.8


US Treasury Bonds Futures:

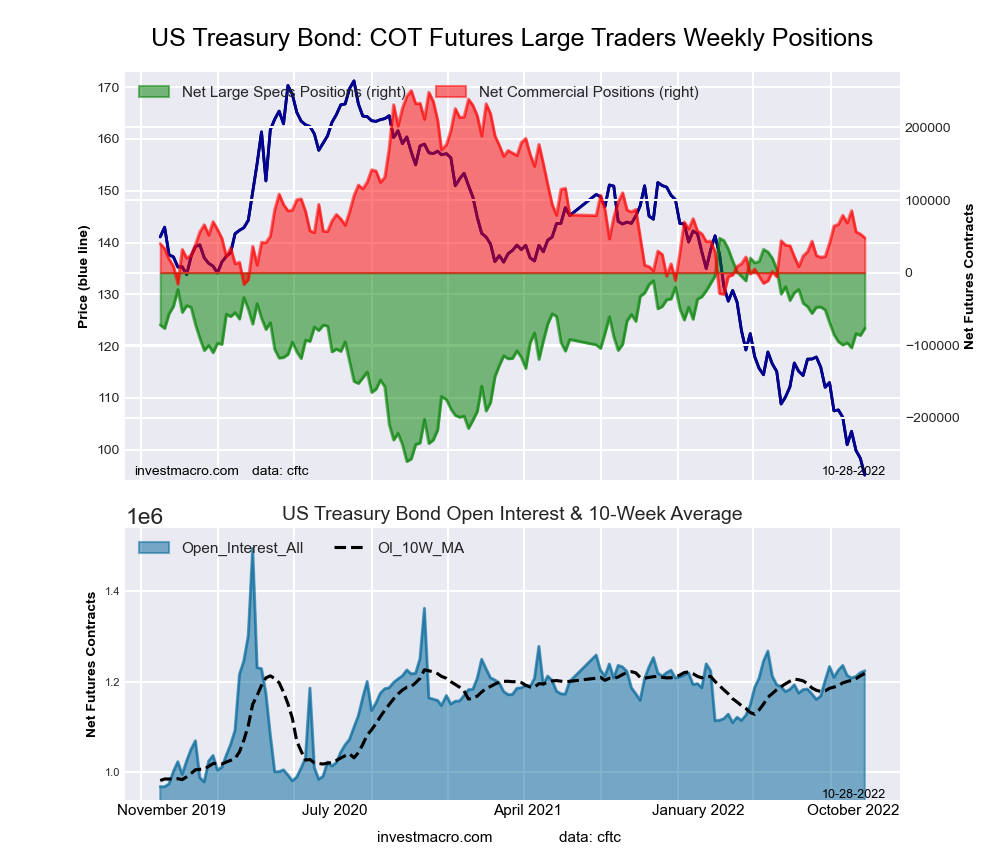
US Year Treasury Notes Long Bonds Futures COT ChartThe US Treasury Bonds large speculator standing this week totaled a net position of -76,559 contracts in the data reported through Tuesday. This was a weekly increase of 9,780 contracts from the previous week which had a total of -86,339 net contracts.

This week’s current strength score (the trader positioning range over the past three years, measured from 0 to 100) shows the speculators are currently Bullish with a score of 59.7 percent. The commercials are Bearish with a score of 27.7 percent and the small traders (not shown in chart) are Bullish with a score of 75.3 percent.

US Treasury Bonds StatisticsSPECULATORSCOMMERCIALSSMALL TRADERS
– Percent of Open Interest Longs:6.978.014.0
– Percent of Open Interest Shorts:13.274.111.7
– Net Position:-76,55947,90428,655
– Gross Longs:84,406954,865171,735
– Gross Shorts:160,965906,961143,080
– Long to Short Ratio:0.5 to 11.1 to 11.2 to 1
NET POSITION TREND:
– Strength Index Score (3 Year Range Pct):59.727.775.3
– Strength Index Reading (3 Year Range):BullishBearishBullish
NET POSITION MOVEMENT INDEX:
– 6-Week Change in Strength Index:6.0-6.60.2


Ultra US Treasury Bonds Futures:

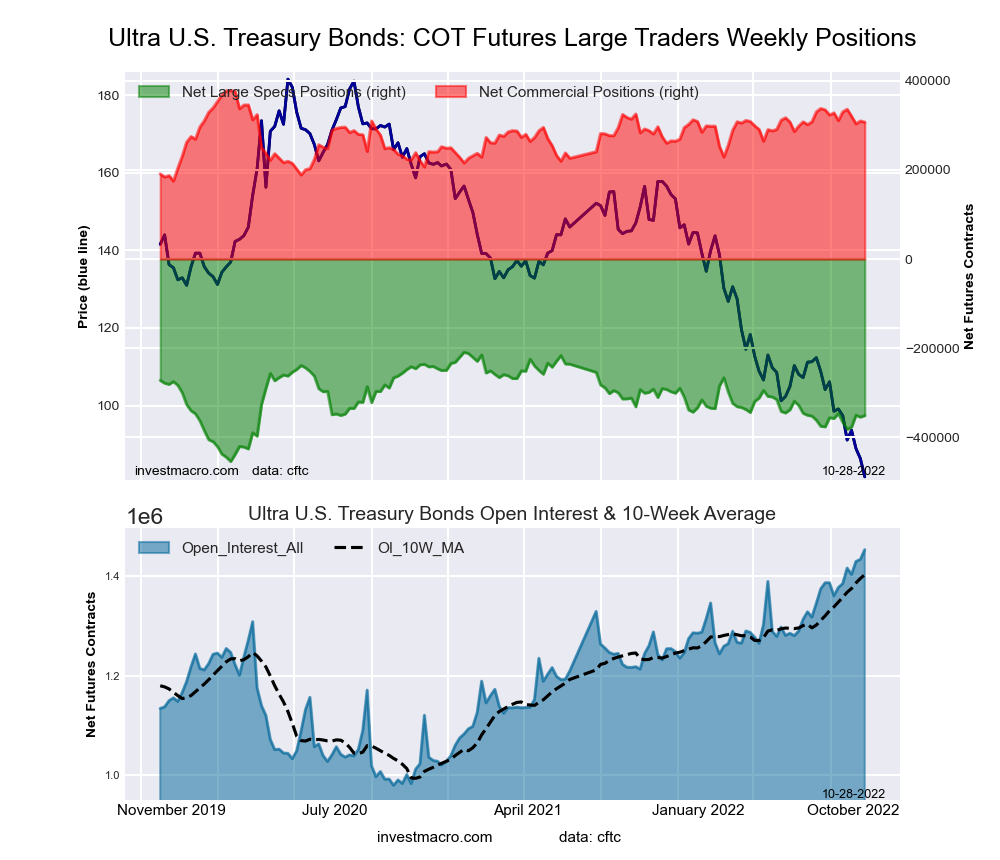
Ultra US Year Treasury Notes Long Bonds Futures COT ChartThe Ultra US Treasury Bonds large speculator standing this week totaled a net position of -351,022 contracts in the data reported through Tuesday. This was a weekly rise of 3,496 contracts from the previous week which had a total of -354,518 net contracts.

This week’s current strength score (the trader positioning range over the past three years, measured from 0 to 100) shows the speculators are currently Bearish with a score of 42.0 percent. The commercials are Bullish with a score of 62.5 percent and the small traders (not shown in chart) are Bullish with a score of 68.0 percent.

Ultra US Treasury Bonds StatisticsSPECULATORSCOMMERCIALSSMALL TRADERS
– Percent of Open Interest Longs:6.681.611.3
– Percent of Open Interest Shorts:30.760.58.3
– Net Position:-351,022307,02144,001
– Gross Longs:95,6301,185,802164,658
– Gross Shorts:446,652878,781120,657
– Long to Short Ratio:0.2 to 11.3 to 11.4 to 1
NET POSITION TREND:
– Strength Index Score (3 Year Range Pct):42.062.568.0
– Strength Index Reading (3 Year Range):BearishBullishBullish
NET POSITION MOVEMENT INDEX:
– 6-Week Change in Strength Index:-1.8-1.96.5


Article By InvestMacroReceive our weekly COT Newsletter

*COT Report: The COT data, released weekly to the public each Friday, is updated through the most recent Tuesday (data is 3 days old) and shows a quick view of how large speculators or non-commercials (for-profit traders) were positioned in the futures markets.

The CFTC categorizes trader positions according to commercial hedgers (traders who use futures contracts for hedging as part of the business), non-commercials (large traders who speculate to realize trading profits) and nonreportable traders (usually small traders/speculators) as well as their open interest (contracts open in the market at time of reporting). See CFTC criteria here.


Robotics-Driven Services Co. Posts 20% Revenue Gains in Q3

Source: Streetwise Reports  (10/28/22)

Shares of Oceaneering International Inc. traded 16.5% higher yesterday after the diversified offshore engineering services and manufacturing firm reported Q3/22 financial results that included a 20% YoY increase in revenue and improved operating performance and profitability across all its business units.

After U.S. markets closed Wednesday, Oceaneering International Inc. (OII:NYSE), a global provider of engineered products, services, and robotic solutions for the offshore energy, aerospace, defense, and manufacturing industries, announced financial results for the third quarter of 2022 ended September 30, 2022.

The company reported that for Q3/22, it posted total revenue of US$559.7 million, compared to US$466.8 million in Q3/21. The firm provided a breakdown of revenue by business segment and indicated that its subsea robotics unit accounted for US$169.4 million, manufactured products were US$94.0 million, offshore projects group US$153.0 million, integrity management and digital solutions US$58.5 million and aerospace and defense technologies posted US$84.8 million.

Oceaneering International advised that for Q3/22, it recorded a net income of US$18.3 million, or US$0.18 per share, versus a net loss of US$7.4 million, or a net loss of US$0.07 per share in Q3/21.

The company added that adjusted net income for Q3/22 was US$23.7 million, or US$0.23 per share, and noted that the adjustments were the result of US$1.1 million in pre-tax adjustments related to foreign exchange losses and another US$4.4 million in discretionary tax adjustments pertaining to asset valuation and tax allowances.

The company stated that during Q3/22, it generated cash flow from operations of US$85.9 million, had a free cash flow of US$66.6 million, and ended the quarter with US$428 million in cash on its balance sheet.

The firm pointed out further that during Q3/22, its fleet of 250 remotely operated vehicles (ROVs) achieved a utilization rate of 67%, and each, on average, contributed revenue of US$8,468 per day. The company added that as of September 30, 2022, its Manufactured Products division had a backlog of US$365 million.

Oceaneering International’s President and CEO Roderick A. Larson commented, “Our third-quarter results were driven by improved offshore activity and pricing, particularly in the Gulf of Mexico, which ticked up further during the quarter. We produced adjusted consolidated EBITDA of US$77.6 million, which exceeded our guidance and consensus estimates.”

“Offshore activity drove significant operating improvements in our energy businesses, which were led by our Subsea Robotics (SSR) and Offshore Projects Group (OPG) segments. In addition, increased manufacturing throughput led to improved operating margins in our Manufactured Products segment. We also saw a meaningful recovery in our government-focused businesses after experiencing the effects of negative timing during the second quarter of 2022,” Larson added.

The firm stated that it expects that revenues in Q4/22 will decline slightly or be on par with those registered in Q3/22. The company indicated that it estimates that the manufactured products group and ADTech revenues and profitability will be higher but will be offset by slightly lower revenues and operating profitability in its SSR, OPG, and IMDS segments, in part due to seasonality.

Oceaneering indicated that for FY/22, it estimates that adjusted EBITDA will be in the range of US$215-240 million.

The company advised that for FY/23, it anticipates higher levels of activity and improved performance in each of its primary business areas led by its SSR and OPG segments. The firm said that for FY/23, it expects consolidated EBITDA of US$260-310 million and free cash flow of over US$100 million.

The company indicated that going forward, it remains focused on safety, financial discipline, free cash flow generation, debt management, and growth. The firm stated that it will continue to look for opportunities to increase its prices and improve margins to benefit shareholders.

Oceaneering is a global technology firm based in Houston, Texas, that provides underwater, on land, and in space engineered services and products and robotic solutions to the offshore energy, aerospace, defense, entertainment, and manufacturing industries. The company employs more than 10,000 people and has operations in 24 countries.

The firm’s Subsea Robotics business segment offers remotely operated vehicles (ROVs) that are used to support offshore oil and gas drilling and vessel-based services such as subsea surveying, installation, construction, inspection, maintenance, and repair. The company fleet includes approximately 250 work-class ROVs. Its Manufactured Products segment manufactures distribution and connection systems, pipeline connections, and other hardware and repair systems for the energy industry.

Through its Offshore Projects Group, Oceaneering offers subsea installation, intervention, inspection, maintenance, and repair services, including ROV workover control systems and project management and engineering. The firm also provides asset integrity management, software, and analytical solutions for the bulk cargo maritime and energy industries through its Integrity Management & Digital Solutions segment. Lastly, the company’s Aerospace and Defense Technologies segment supports U.S. government agencies with engineering and related manufacturing assistance for use in defense and space exploration efforts.

Oceaneering International started yesterday with a market cap of around US$1.13 billion, with approximately 100.26 million shares outstanding and a short interest of about 4.4%. OII shares opened almost 9% higher yesterday at US$12.22 (+US$0.99, +8.82%) over the previous day’s US$11.23 closing price. The stock traded yesterday between US$12.12 and US$13.92 per share and closed for trading at US$13.08 (+US$1.88, +16.47%).

Disclosures:
1) Stephen Hytha wrote this article for Streetwise Reports LLC and provides services to Streetwise Reports as an independent contractor. He or members of his household own securities of the following companies mentioned in the article: None. He or members of his household are paid by the following companies mentioned in this article: None.

2) The following companies mentioned in this article are billboard sponsors of Streetwise Reports: None. Click here for important disclosures about sponsor fees.

3) Comments and opinions expressed are those of the specific experts and not of Streetwise Reports or its officers. The information provided above is for informational purposes only and is not a recommendation to buy or sell any security.

4) The article does not constitute investment advice. Each reader is encouraged to consult with his or her individual financial professional and any action a reader takes as a result of information presented here is his or her own responsibility. By opening this page, each reader accepts and agrees to Streetwise Reports’ terms of use and full legal disclaimer. This article is not a solicitation for investment. Streetwise Reports does not render general or specific investment advice and the information on Streetwise Reports should not be considered a recommendation to buy or sell any security. Streetwise Reports does not endorse or recommend the business, products, services or securities of any company mentioned on Streetwise Reports.

5) From time to time, Streetwise Reports LLC and its directors, officers, employees or members of their families, as well as persons interviewed for articles and interviews on the site, may have a long or short position in securities mentioned. Directors, officers, employees or members of their immediate families are prohibited from making purchases and/or sales of those securities in the open market or otherwise from the time of the decision to publish an article until three business days after the publication of the article. The foregoing prohibition does not apply to articles that in substance only restate previously published company releases.

Expert Says Buy Pharma Co. Stock ‘as Soon as Possible’

Source: Clive Maund  (10/25/22)

Algernon Pharmaceuticals has entered into a clinical trial agreement with Yale and caught expert Clive Maund’s attention. In light of this, Maund reviews the company’s chart to tell you when he believes you should buy its stock.

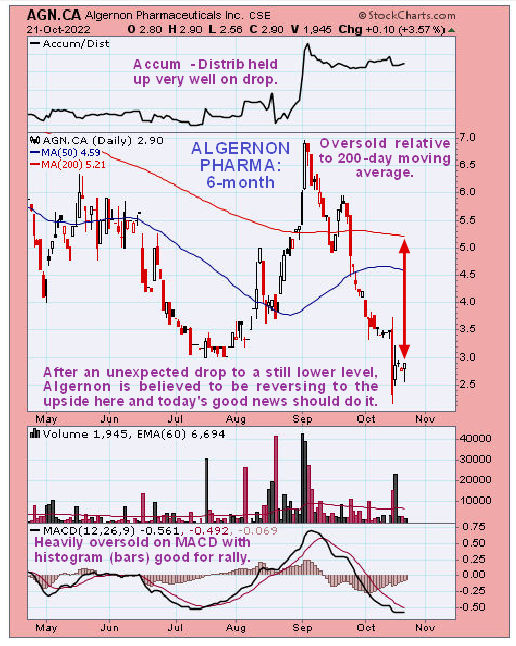
Algernon Pharmaceuticals Inc. (AGN:CSE; AGNPF:OTCQB; AGN0:XFRA) got sold down further than we expected, making an unexpected further drop last week that took it down close to a trendline connecting a series of lows.

However, it now looks set to reverse to the upside, especially as this morning it came out with the news that it has entered into a clinical trial agreement with Yale University for a DMT Phase 2 Depression Study.

The fact that it has only 2 million shares in issue improves its potential for rapid recovery.

Anyone holding should therefore stay long, and it is rated a Buy again here. Those interested should aim to buy it as soon as possible after the open this morning.

Algernon Pharmaceuticals’s website.

Algernon Pharmaceuticals Inc. closed at CA$2.90, $2.09 on October 21, 2022.

CliveMaund.com Disclosures

The above represents the opinion and analysis of Mr. Maund, based on data available to him, at the time of writing. Mr. Maund’s opinions are his own, and are not a recommendation or an offer to buy or sell securities. Mr. Maund is an independent analyst who receives no compensation of any kind from any groups, individuals or corporations mentioned in his reports. As trading and investing in any financial markets may involve serious risk of loss, Mr. Maund recommends that you consult with a qualified investment advisor, one licensed by appropriate regulatory agencies in your legal jurisdiction and do your own due diligence and research when making any kind of a transaction with financial ramifications. Although a qualified and experienced stock market analyst, Clive Maund is not a Registered Securities Advisor. Therefore Mr. Maund’s opinions on the market and stocks can only be construed as a solicitation to buy and sell securities when they are subject to the prior approval and endorsement of a Registered Securities Advisor operating in accordance with the appropriate regulations in your area of jurisdiction.

Disclosures:
1) Clive Maund: I, or members of my immediate household or family, own securities of the following companies mentioned in this article: None. I personally am, or members of my immediate household or family are, paid by the following companies mentioned in this article: None.

2) The following companies mentioned in this article are billboard sponsors of Streetwise Reports: Algernon Pharmaceuticals Inc. Click here for important disclosures about sponsor fees. As of the date of this article, an affiliate of Streetwise Reports has a consulting relationship with Algernon Pharmaceuticals Inc. Please click here for more information.

3) Statements and opinions expressed are the opinions of the author and not of Streetwise Reports or its officers. The author is wholly responsible for the validity of the statements. The author was not paid by Streetwise Reports for this article. Streetwise Reports was not paid by the author to publish or syndicate this article. Streetwise Reports requires contributing authors to disclose any shareholdings in, or economic relationships with, companies that they write about. Streetwise Reports relies upon the authors to accurately provide this information and Streetwise Reports has no means of verifying its accuracy.

4) This article does not constitute investment advice. Each reader is encouraged to consult with his or her individual financial professional and any action a reader takes as a result of information presented here is his or her own responsibility. By opening this page, each reader accepts and agrees to Streetwise Reports’ terms of use and full legal disclaimer. This article is not a solicitation for investment. Streetwise Reports does not render general or specific investment advice and the information on Streetwise Reports should not be considered a recommendation to buy or sell any security. Streetwise Reports does not endorse or recommend the business, products, services or securities of any company mentioned on Streetwise Reports.

5) From time to time, Streetwise Reports LLC and its directors, officers, employees or members of their families, as well as persons interviewed for articles and interviews on the site, may have a long or short position in securities mentioned. Directors, officers, employees or members of their immediate families are prohibited from making purchases and/or sales of those securities in the open market or otherwise from the time of the decision to publish an article until three business days after the publication of the article. The foregoing prohibition does not apply to articles that in substance only restate previously published company releases. As of the date of this article, officers and/or employees of Streetwise Reports LLC (including members of their household) own securities of Algernon Pharmaceuticals Inc., a company mentioned in this article.

6) This article does not constitute medical advice. Officers, employees and contributors to Streetwise Reports are not licensed medical professionals. Readers should always contact their healthcare professionals for medical advice.

Japanese Candlesticks Analysis 28.10.2022 (EURUSD, USDJPY, EURGBP)

Article By RoboForex.com

EURUSD, “Euro vs US Dollar”

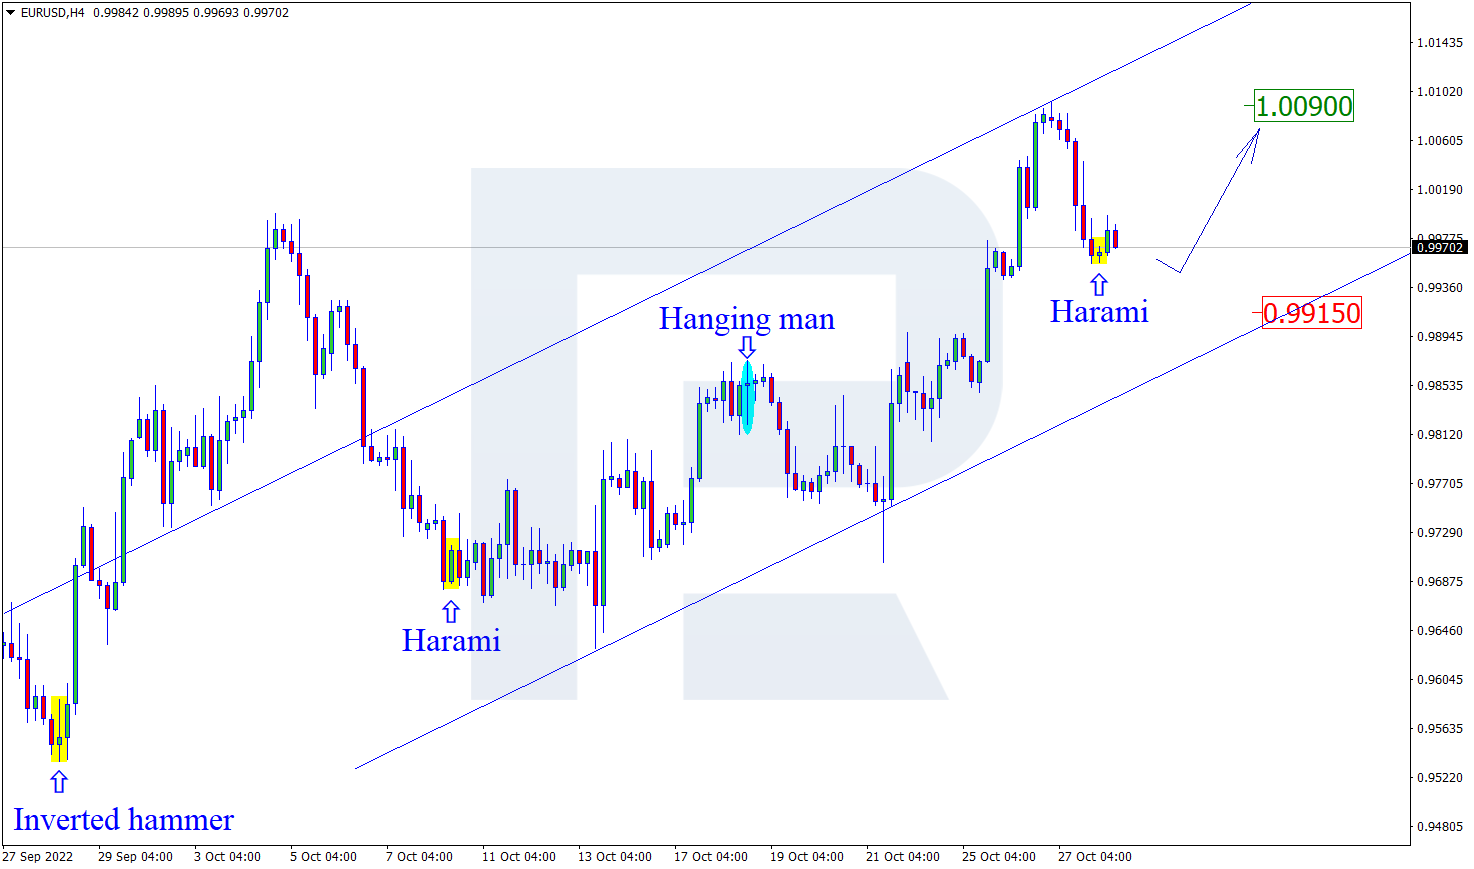
On H4, at a pullback near the support level the a Harami reversal pattern has formed. Currently, the pair can go by the signal in an ascending wave. The goal of growth is 1.0090. However, the quotes may pull back to 0.9915, bounce off the level, and continue the uptrend after the correction.

EURUSD
Risk Warning: the result of previous trading operations do not guarantee the same results in the future

USDJPY, “US Dollar vs Japanese Yen”

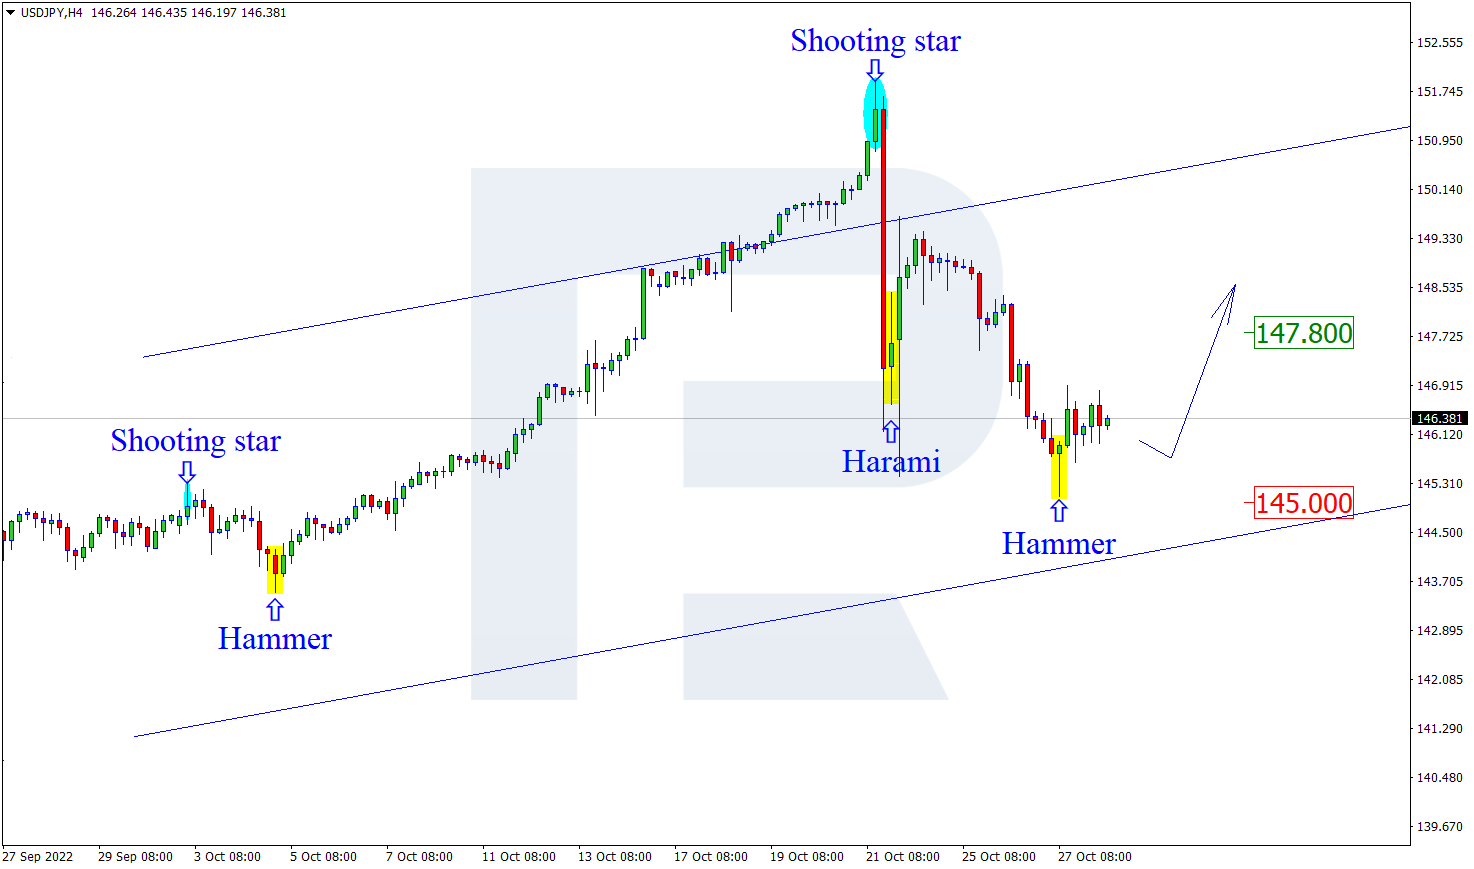
On H4, at the support level the pair has formed a Hammer reversal pattern. The pair is now going by the signal in an ascending wave. The goal of growth is 147.80. However, the quotes may pull back to 145.00 and continue the uptrend after the correction to the support level.

USDJPY
Risk Warning: the result of previous trading operations do not guarantee the same results in the future

EURGBP, “Euro vs Great Britain Pound”

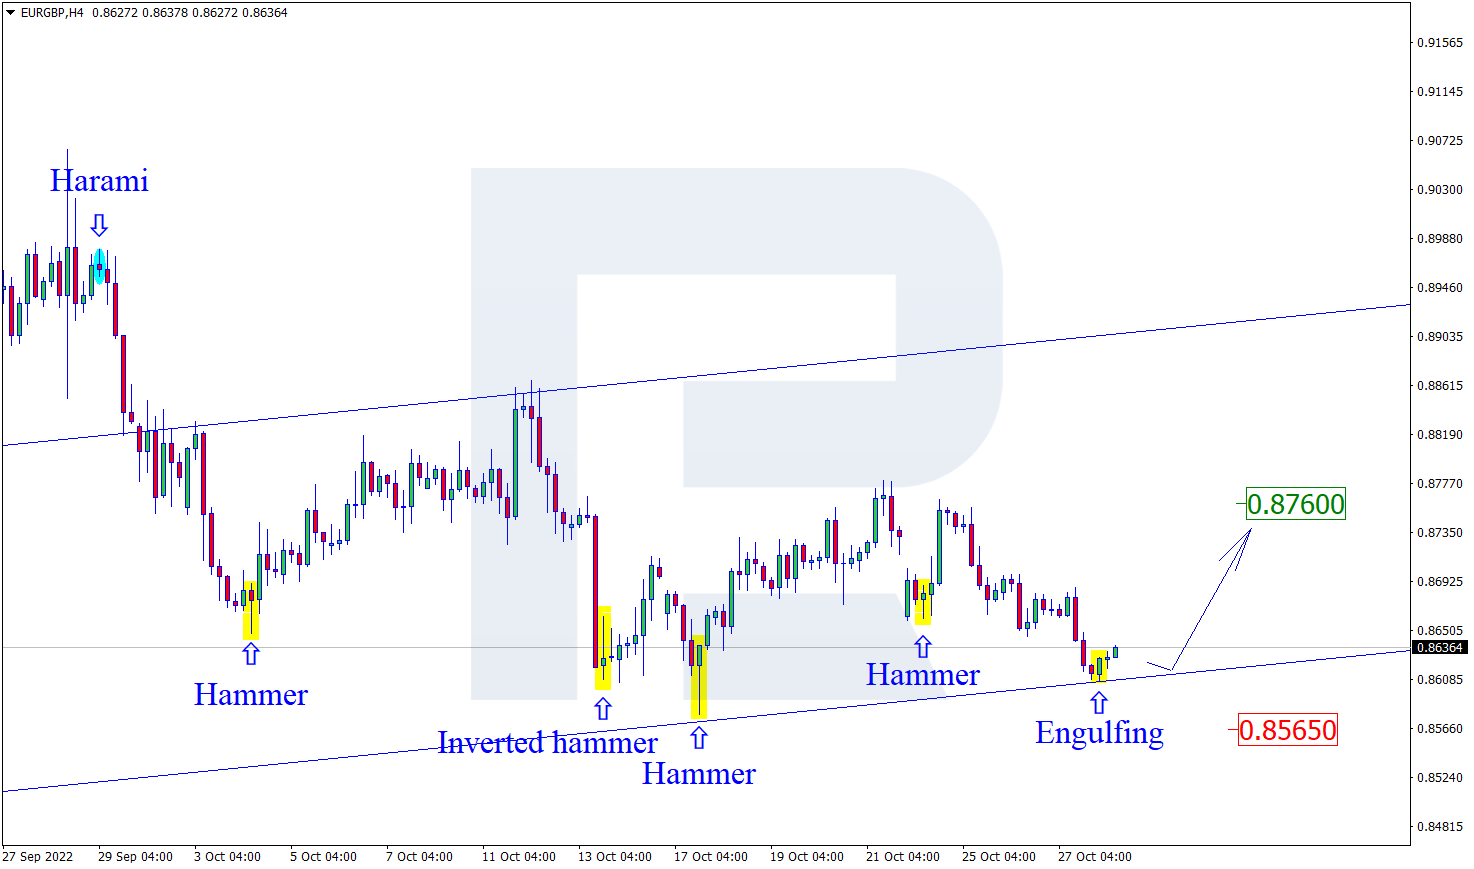
On H4, the pair has formed an Engulfing reversal pattern. Currently, the pair is going by the signal in an ascending wave. The goal of the growth may be the resistance level of 0.8760. Upon testing and breaking through it, the pair has a chance for continuing the uptrend. However, it may still pull back to 0.8565 before growing to the resistance level.

EURGBP

Article By RoboForex.com

Attention!
Forecasts presented in this section only reflect the author’s private opinion and should not be considered as guidance for trading. RoboForex LP bears no responsibility for trading results based on trading recommendations described in these analytical reviews.

Murrey Math Lines 28.10.2022 (Brent, S&P 500)

Article By RoboForex.com

BRENT

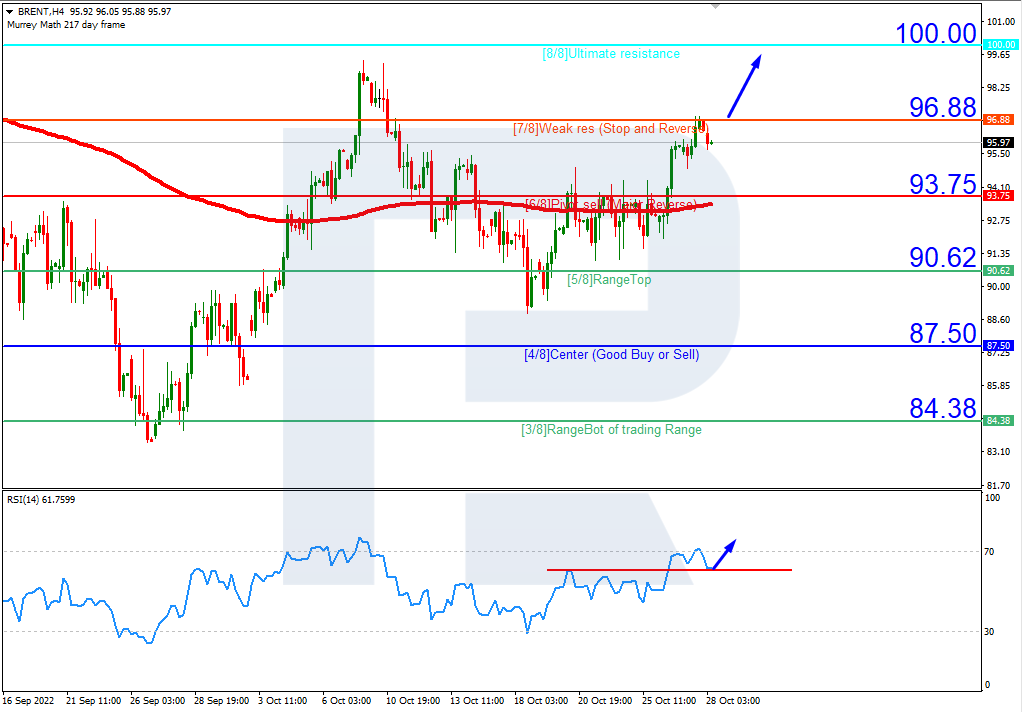
On H4, the quotes have broken through the 200-day Moving Average and are now resting above it, which indicates an uptrend. The RSI is testing the the support level. Currently, we should expect the quotes to rise over 7/8 (96.88) and then grow to the resistance level of 8/8 (100.00). The scenario can be cancelled by a breakaway of 6/8 (93.75) downwards. In this case, the quotes may drop to the support level of 5/8 (90.62).

BRENTH4
Risk Warning: the result of previous trading operations do not guarantee the same results in the future

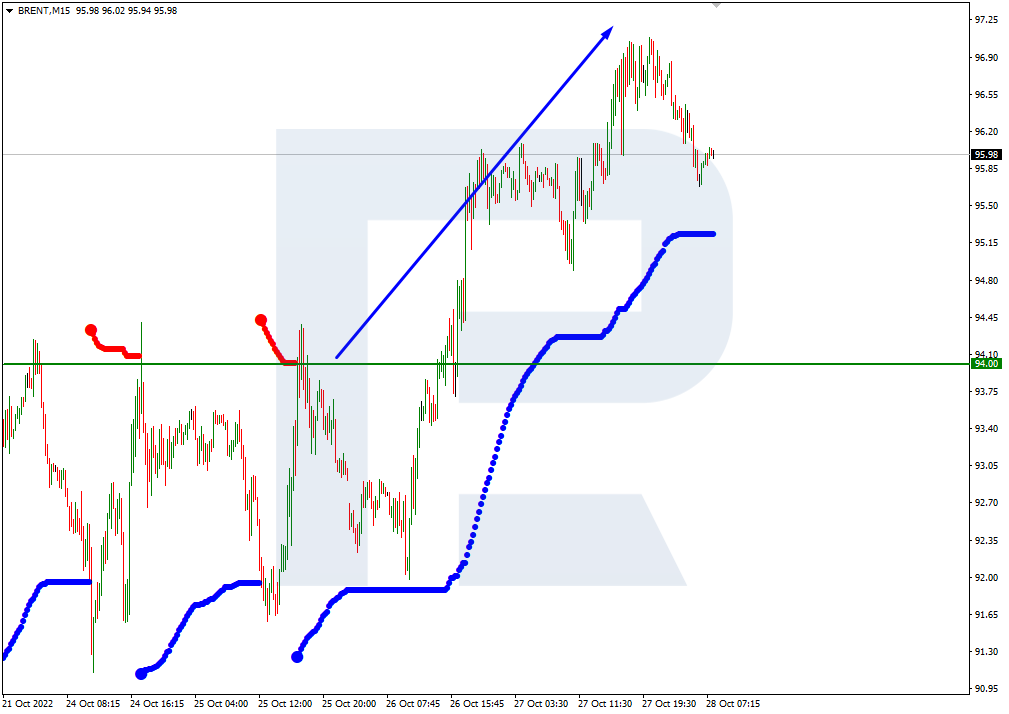
On M15, the upper line of VoltyChannel is broken, which increases the probability of price growth.

BRENT_M15
Risk Warning: the result of previous trading operations do not guarantee the same results in the future

S&P 500

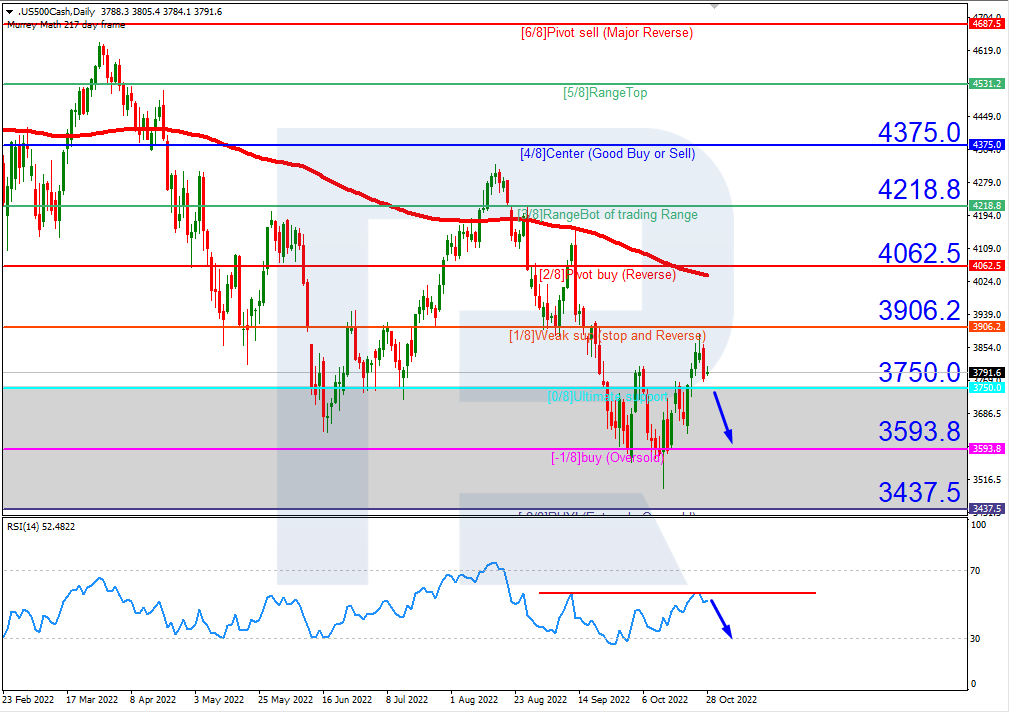
On H4, the quotes are going under the 200-day Moving Average, indicating the prevalence of a downtrend. The RSI bounced off the resistance level. Currently, a breakaway of the support level downwards is expected at 0/8 (3750.0), followed by falling to -1/8 (3593.8). The scenario can be cancelled by a downward breakaway of the resistance level at 1/8 (3906.2). In this case, the quotes may reach 2/8 (4062.5).

S&P 500_H4
Risk Warning: the result of previous trading operations do not guarantee the same results in the future

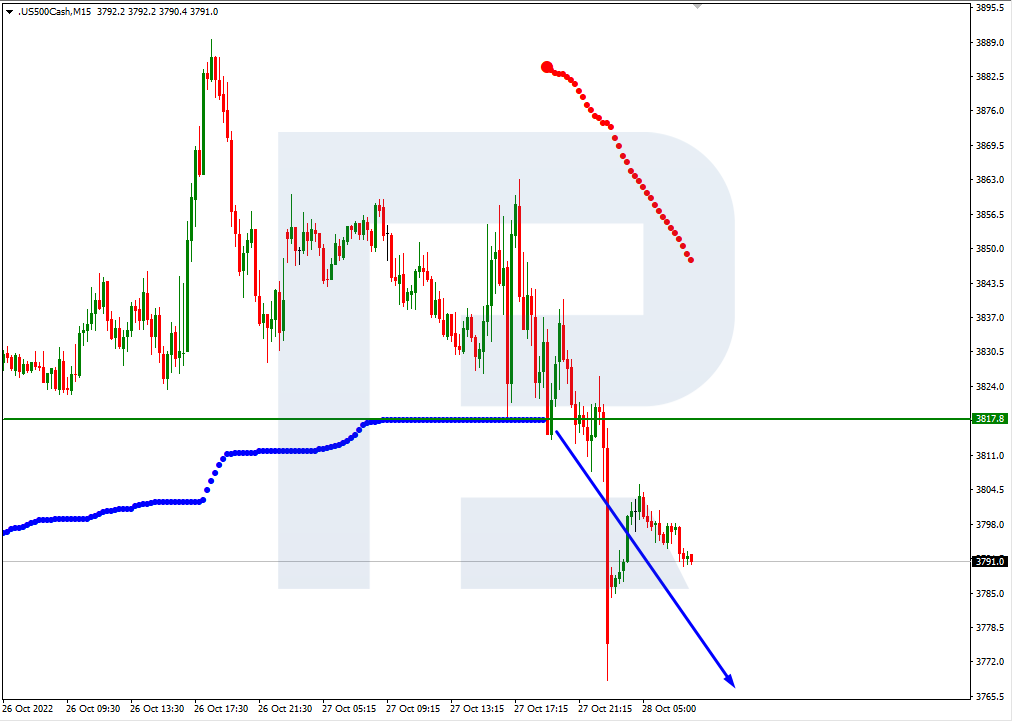
On M15, the lower line of VoltyChannel is broken, confirming the downtrend and a high probability of further price falling.

S&P 500_M15
Risk Warning: the result of previous trading operations do not guarantee the same results in the future

Article By RoboForex.com

Attention!
Forecasts presented in this section only reflect the author’s private opinion and should not be considered as guidance for trading. RoboForex LP bears no responsibility for trading results based on trading recommendations described in these analytical reviews.

The Analytical Overview of the Main Currency Pairs on 2022.10.28

By JustMarkets

The EUR/USD currency pair

Technical indicators of the currency pair:
  • Prev Open: 1.0073
  • Prev Close: 0.9964
  • % chg. over the last day: -1.01 %

The European Central Bank has increased the interest rate by 0.75%. As a result of this step, the refinancing rate reached 2%. This is the most massive rate hike in the history of the ECB. In addition to the expected rate hike, the ECB also announced changes to the target long-term refinancing (TLTRO) operations in terms of the applied interest rate and earlier repayment dates. On the other hand, the balance sheet reduction was postponed until the December meeting.

Trading recommendations
  • Support levels: 0.9969, 0.9897, 0.9873, 0.9835, 0.9755, 0.9601
  • Resistance levels: 1.0054, 1.0111, 1.0162, 1.0230

From the technical point of view, the trend on the EUR/USD currency pair on the hourly time frame is bullish. The price began a corrective movement and fell below the moving lines. The MACD indicator is in the negative zone, but sellers’ pressure is weak. Under such market conditions, buy trades should be considered from the support level of 0.9969 or 0.0897, but with additional confirmation in the form of reverse initiative. Sell deals can be considered from the resistance level of 1.0054, but also with confirmation.

Alternative scenario: if the price breaks down through the support level of 0.9834 and fixes below it, the downtrend will likely resume.

EUR/USD
News feed for 2022.10.28:
  • – Eurozone French GDP (m/m) at 08:30 (GMT+3);
  • – Eurozone French CPI (m/m) at 09:45 (GMT+3);
  • – Eurozone Spanish GDP (m/m) at 10:00 (GMT+3);
  • – Eurozone Spanish CPI (m/m) at 10:00 (GMT+3);
  • – Eurozone Italian CPI (m/m) at 12:00 (GMT+3);
  • – Eurozone German GDP (m/m) at 11:00 (GMT+3);
  • – Eurozone German CPI (m/m) at 15:00 (GMT+3);
  • – US PCE Price index (m/m) at 15:30 (GMT+3);
  • – US Michigan Consumer Sentiment (m/m) at 17:00 (GMT+3);
  • – US Pending Home Sales (m/m) at 17:00 (GMT+3).

The GBP/USD currency pair

Technical indicators of the currency pair:
  • Prev Open: 1.1611
  • Prev Close: 1.1557
  • % chg. over the last day: -0.47 %

The British pound is firmer than the euro right now. Investors’ confidence in the “pound” is returning amid serious preparations of the new government to form a new budget and a plan to get out of recession. Most likely, it will be achieved by cutting government spending, which will increase unemployment. However, this step is necessary because otherwise, the British economy will have a lot more problems in the form of further reduction of production, business activity, and the real estate market to recession levels.

Trading recommendations
  • Support levels: 1.1467, 1.1338, 1.1172, 1.1093, 1.0915, 1.0817
  • Resistance levels: 1.1698, 1.1816, 1.1901

From the technical point of view, the trend on the GBP/USD currency pair on the hourly time frame is bullish. The price is trading at the level of the moving averages. The MACD indicator has become inactive, and the buyers’ pressure remains, but now the price is correcting. Under such market conditions, buy trades can be considered from the support level of 1.1467 or 1.1337, but better after confirmation. Sell trades are best to look for on intraday time frames. The nearest resistance level is 1.1698, but also better with confirmation in the form of a reverse initiative.

Alternative scenario: if the price breaks down of the 1.1172 support level and fixes below it, the downtrend will likely resume.

GBP/USD
There is no news feed for today.

The USD/JPY currency pair

Technical indicators of the currency pair:
  • Prev Open: 146.32
  • Prev Close: 146.26
  • % chg. over the last day: -0.04 %

The Japanese yen hit a 3-week high ahead of the Bank of Japan meeting. Currency intervention and weakness in the dollar helped the yen strengthen temporarily. Nevertheless, the Bank of Japan held another interest rate meeting today and maintained its super soft policy to support the fragile economy. That is the reason why analysts are skeptical about strengthening the yen, as the US Fed is still in a tightening cycle, while the BoJ has left policy unchanged.

Trading recommendations
  • Support levels: 144.91, 144.19, 143.00
  • Resistance levels: 148.79, 147.75, 148.64, 148.64, 150.00, 151.05

From the technical point of view, the medium-term trend on the currency pair USD/JPY has changed to bearish. The price is trading at the level of the moving averages. The MACD indicator has become inactive, and there is a slight buying pressure. Under such market conditions, buy trades can be sought on intraday time frames from the support level of 145.88 or 144.90. Sell deals can be searched from the 147.75 resistance level, but only with additional confirmation. The level of 146.79 has already been tested twice and is likely to be broken by the price.

Alternative scenario: If the price fixes above 150.00, the uptrend will likely resume.

USD/JPY
News feed for 2022.10.28:
  • – Japan Unemployment Rate (m/m) at 02:30 (GMT+3);
  • – Japan Tokyo Core CPI (m/m) at 02:30 (GMT+3);
  • – Japan BoJ Interest Rate Decision at 06:00 (GMT+3);
  • – Japan BoJ Monetary Policy Statement at 06:00 (GMT+3);
  • – Japan BoJ Outlook Report at 06:00 (GMT+3);
  • – Japan BoJ Press Conference (Tentative).

The USD/CAD currency pair

Technical indicators of the currency pair:
  • Prev Open: 1.3559
  • Prev Close: 1.3565
  • % chg. over the last day: +0.04 %

The Canadian dollar is a commodity currency and depends not only on the monetary policy of the Bank of Canada but also on the performance of the dollar index and oil prices. The dollar index strengthened yesterday while oil prices also continued to grow. As a result, the Canadian dollar is trading in a narrow range, as it was affected by two opposing factors. Overall, the outlook for oil remains on the upside, while the dollar index is fundamentally close to a reversal. In the medium term, USD/CAD quotes may decline significantly.

Trading recommendations
  • Support levels: 1.3541, 1.35000, 1.3454
  • Resistance levels: 1.3597, 1.3678, 1.3795, 1.3855, 1.3968

From the point of view of technical analysis, the trend on the USD/CAD currency pair is bearish. The price is trading at the level of the moving averages. The MACD indicator is in the negative zone, but there is a divergence, indicating the sellers’ weakness. The best way to sell is to consider the resistance level of 1.3678, but only after additional confirmation in the form of a reverse initiative. Buy trades should be considered on the lower time frames from the support level of 1.3541, but it is better after confirmation.

Alternative scenario: if the price breaks out and consolidates above the resistance level of 1.3855, the uptrend will likely resume.

USD/CAD
News feed for 2022.10.28:
  • – Canada GDP (m/m) at 15:30 (GMT+3).

By JustMarkets


This article reflects a personal opinion and should not be interpreted as an investment advice, and/or offer, and/or a persistent request for carrying out financial transactions, and/or a guarantee, and/or a forecast of future events.

Week Ahead: Hawkish Fed, robust jobs report should fuel Dollar rebound

By ForexTime

The US Federal Reserve (Fed) is widely expected to hike its benchmark rates by another 75 basis points (bps) yet again in the new month.

However, how high the US central bank can ultimately raise interest rates would depend on the state of the economy, of which the jobs data is a key indicator.

The upcoming Fed policy meeting, along with the latest US nonfarm payrolls report, will be of utmost importance in the week ahead, also featuring these scheduled data releases and events

Monday, October 31

  • JPY: Japan September industrial production, retail sales, October consumer confidence
  • AUD: Australia September retail sales, October inflation
  • CNH: China October PMIs
  • EUR: Eurozone 3Q GDP and October inflation, ECB Chief Economist Philip Lane speech, Germany September retail sales
  • Brent: OPEC releases 2022 World Oil Outlook

Tuesday, November 1

  • AUD: Reserve Bank of Australia policy decision
  • CNH: China October Caixin manufacturing PMI
  • GBP: UK October manufacturing PMI (final)
  • CAD: Canada October manufacturing PMI (final)
  • USD: US October manufacturing PMI (final), ISM manufacturing

Wednesday, November 2

  • NZD: New Zealand 3Q unemployment rate
  • JPY: Bank of Japan September meeting minutes
  • EUR: Eurozone October manufacturing PMI (final); Germany September external trade and October unemployment
  • USD: FOMC rate decision
  • US crude: EIA weekly oil inventory report

Thursday, November 3

  • AUD: Australia September external trade, October PMIs (final)
  • CNH: China October composite and services PMIs
  • EUR: Eurozone September unemployment, ECB President Christine Lagarde speech
  • GBP: Bank of England rate decision
  • USD: US weekly initial jobless claims, October ISM services index

Friday, November 4

  • EUR: Eurozone September PPI, Germany September factory orders, ECB President Christine Lagarde speech
  • USD: US October nonfarm payrolls, Boston Fed President Susan Collins speech
  • CAD: Canada October unemployment rate


With next week’s hike already well-telegraphed, markets are already honing their attentions to what Fed Chair Jerome Powell might say during Wednesday’s press conference about potential policy adjustments to be made at the Fed’s December meetings and beyond.

Assuming we indeed see yet another 75bps hike next week, that would bring the upper bound of the Fed benchmark rates up to 3.75%.

  • Markets currently believe that such a move (75bps hike next week) would put the largest chunks of the Fed rate hikes behind us.
  • At present, markets also expect that US interest rates would peak around 4.8% in Q2 2023.
  • That suggests just another couple of relatively smaller 50bps hikes left in the Fed’s pipeline before this rate-hiking cycle is over (again, assuming that a 75bps hike does indeed materialize next week).

The above essentially comprises the “dovish pivot” narrative that traders and investors have been testing at various intervals since the summer.

This latest iteration of that “dovish pivot” narrative has prompted a softening of the US dollar, with the equally-weighted USD index falling away from its post-pandemic high and bounce off its 50-day simple moving average (SMA) as key support.


Ultimately, how high US interest rates would go could ultimately depend on the incoming economic data.

And the incoming US nonfarm payrolls (NFP) report is expected to remind investors of the resilience evident in the jobs market of the world’s largest economy, potentially paving the way for more Fed rate hikes.

Here’s what economists are predicting for the upcoming US jobs report:

  • Headline NFP figure: 200,000 jobs added in October; lower than September’s 263k.
  • Unemployment rate: a slight uptick to 3.6% compared to the 3.5% in the month prior.

A lower-than-expected headline NFP figure, or a higher-than-expected unemployment rate, could bolster the “dovish pivot” narrative.

That should, in turn, prompt the USD Index to unwind more of its year-to-date gains and retest the early-September peak around 1.22 for support, with stronger support set to follow around its 100-day SMA at 1.21.

However, if hiring in the US economy comes in better than expected, being able to withstand the Fed rate hikes that have been ongoing since March, that could restore this USD Index back on a path back closer to its mid-October high above 1.29 as the “dovish pivot” proponents are forced to forego their expectations for a while longer.

And of course, much of the USD Index’s performance in the coming week should rely heavily on the latest policy clues due out of the FOMC policy statement and Fed Chair Jerome Powell’s press conference.

If the Fed signals that it remains hell bent on squashing red-hot US inflation by sending US interest rates past the market-forecasted 4.7% peak, such hawkish policy clues should reinvigorate dollar bulls.


While this Week Ahead article has been rather US-centric, also note that the Bank of England is in action at the onset of November. With central banks on either side of the pond in action in the coming week, that sets up some potential volatility for GBPUSD.

So be sure to check back in on Monday when we publish our regular Trade of the Week article.


Forex-Time-LogoArticle by ForexTime

ForexTime Ltd (FXTM) is an award winning international online forex broker regulated by CySEC 185/12 www.forextime.com

Amazon crashed the Nasdaq. The US GDP rises after 2 quarters of decline

By JustMarkets

The US stock indices traded yesterday without a single trend. At the close of the stock market yesterday, the Dow Jones Index (US30) increased by 0.61%, while the S&P 500 Index (US500) lost 0.61%. The NASDAQ Technology Index (US100) fell by 1.63% on Thursday.

After two consecutive quarters of negative GDP growth, the US economy grew by 2.6% in the third quarter. However, analysts believe the outlook is deteriorating quickly as the cumulative effect of a 300 basis point rate hike is hurting business activity, and the Fed will continue to raise rates through the end of the year to ensure that inflation targets are met. The biggest drop in performance has been in the real estate sector, as home sales have fallen month to month. This component reduced the overall GDP figure by 1.4% in the third quarter, indicating that the housing market is moving from a period of excess demand to a period of moderate oversupply.

The US durable goods orders rose in September, but the data also showed signs that the growth momentum is decreasing. Durable goods orders are reported in nominal terms by the government, so it is difficult to determine the impact of inflation on the data. Economists point out that surveys of the Federal Reserve’s regional district banks point to a decline in business investment, prompting talk of a recession.

Shares of tech giant Amazon (AMZN) fell more than 20% in after-hours trading after the company released its third-quarter earnings report, with revenue and guidance falling short of analysts’ consensus expectations. The company pointed out that Europe is likely to be its hardest-hit region during the holiday season, with Germany and the UK being its biggest markets after the US.

Apple (AAPL) beat analysts’ expectations by posting record revenue and earnings per share. Apple said its active installed device base hit a record high for all major product categories. But despite the good report, the company’s stock declined in the evening session.

Caterpillar (CAT) gave investors optimism by reporting better-than-expected quarterly results. Rising prices and increased sales support the heavy equipment company’s growth.

Equity markets in Europe mostly rallied yesterday. Germany’s DAX (DE30) increased by 0.12%, France’s CAC 40 (FR40) lost 0.51%, Spain’s IBEX 35 (ES35) added 0.64%, and the British FTSE 100 (UK100) closed Thursday in plus 0.25%.

The European Central Bank raised its interest rate by 0.75%. As a result of this step, the refinancing rate reached 2%. This is the biggest rate hike in the history of the ECB. In addition to the expected rate hike, the ECB also announced changes to the current operations of the Targeted Long-Term Refinancing (TLTRO) in terms of the applied interest rate and earlier maturity dates. But the balance sheet reduction was postponed to the December meeting.

According to experts, the gold market is forming conditions for medium-term growth. Firstly, it is connected with the fact that the US Federal Reserve will soon finish the cycle of rate increases, and the pressure on the gold industry will decrease. Secondly, such markers like Gold miners AD Line and GDX to GLD ratio have long stopped falling and are on the reverse point. Third, gold has a strong seasonal factor ahead – December and January have been the best months of the year for the past 10 years.

Oil prices decreased on Friday as China, the world’s biggest oil importer, imposed new Covid blocks in several cities as the number of infections began to rise again.

Asian markets traded flat yesterday. Japan’s Nikkei 225 (JP225) decreased by 0.32% for the day, Hong Kong’s Hang Seng (HK50) ended the day up 0.72%, and Australia’s S&P/ASX 200 (AU200) increased by 0.50%.

The Bank of Japan (BoJ) kept interest rates at record lows as expected on Friday. The central bank kept its short-term interest rate target at negative -0.1% and said in a statement that it would continue to target 10-year bond yields at 0%. But the statement also indicates that inflation is likely to rise in the near term as the Japanese economy struggles with rising commodity costs and supply chain problems. The Сentral Bank expects CPI inflation to be 3% by the end of the year, up from its previous forecast of 2.3%. But inflation is also expected to fall to about 1.5% in 2023 and 2024. Data released a little earlier showed that annual inflation in Tokyo reached a 33-year high of 3.4% in October. Japan is slowly beginning to add up to the conditions for abandoning ultra-low interest rates.

S&P 500 (F) (US500) 3,807.30 −23.30 (−0.61%)

Dow Jones (US30) 32,033.28 +194.17 (+0.61%)

DAX (DE40) 13,211.23 +15.42 (+0.12%)

FTSE 100 (UK100)  7,073.69  +17.62 (+0.25%)

USD Index 110.58 +0.88 (+0.80%)

Important events for today:
  • – Japan Unemployment Rate (m/m) at 02:30 (GMT+3);
  • – Japan Tokyo Core CPI (m/m) at 02:30 (GMT+3);
  • – Japan BoJ Interest Rate Decision at 06:00 (GMT+3);
  • – Japan BoJ Monetary Policy Statement at 06:00 (GMT+3);
  • – Japan BoJ Outlook Report at 06:00 (GMT+3);
  • – Japan BoJ Press Conference (Tentative);
  • – Eurozone French GDP (m/m) at 08:30 (GMT+3);
  • – Eurozone French CPI (m/m) at 09:45 (GMT+3);
  • – Eurozone Spanish GDP (m/m) at 10:00 (GMT+3);
  • – Eurozone Spanish CPI (m/m) at 10:00 (GMT+3);
  • – Eurozone Italian CPI (m/m) at 12:00 (GMT+3);
  • – Eurozone German GDP (m/m) at 11:00 (GMT+3);
  • – Eurozone German CPI (m/m) at 15:00 (GMT+3);
  • – US PCE Price index (m/m) at 15:30 (GMT+3);
  • – Canada GDP (m/m) at 15:30 (GMT+3);
  • – US Michigan Consumer Sentiment (m/m) at 17:00 (GMT+3);
  • – US Pending Home Sales (m/m) at 17:00 (GMT+3).

By JustMarkets


This article reflects a personal opinion and should not be interpreted as an investment advice, and/or offer, and/or a persistent request for carrying out financial transactions, and/or a guarantee, and/or a forecast of future events.

Building subsidized low-income housing actually lifts property values in a neighborhood, contradicting NIMBY concerns

By Anthony W. Orlando, California State Polytechnic University, Pomona 

The Research Brief is a short take about interesting academic work.

The big idea

Building multiple publicly subsidized low-income housing developments in a neighborhood doesn’t lower the value of other homes in the area – and in fact can even increase their worth, according to a new peer-reviewed study I co-authored.

For the study, we looked at 508 developments financed through the federal Low-Income Housing Tax Credit program and built in the Chicago area from 1997 to 2016. We then examined their influence on more than 600,000 nearby residential sales, using data from local property assessments and tax records. We chose Chicago because of its size, well-established neighborhoods, substantial amount of subsidized housing developments, well-documented racial and ethnic segregation, pockets of persistent and concentrated poverty and excellent data coverage. While some readers may have pictures of dilapidated buildings in their minds, the projects we looked at were generally well built and well maintained.

We found that, relative to comparable homes in other neighborhoods, average home prices jumped by 10% within a quarter-mile of the first affordable housing development that was built in a neighborhood and 2% within a quarter-mile over a 15-year period or through 2016. To ensure we were isolating the effect of the low-income housing program, we also looked at preexisting market trends to make sure neighborhoods that showed the faster price growth weren’t already growing at a faster rate before the low-income housing.

What was more striking to us, however, is that additional developments in the same area generally further increased housing prices. Building two more developments increased prices by a total of 3 additional percentage points, on average, within a quarter-mile and 4 percentage points over the next quarter-mile. In other words, a neighborhood within a quarter-mile of all three developments saw gains of 13% on average over the period.

These additional effects are important because low-income housing projects are disproportionately concentrated geographically, especially in lower-income areas.

We also found that these effects occurred regardless of whether it was a low- or high-income neighborhood and no matter its racial composition.

While other studies have previously shown Low-Income Housing Tax Credit developments typically have positive effects on surrounding property values, ours was the first to look at the impact of several projects in one neighborhood.

Why it matters

Homeowners are often worried that the development of publicly subsidized housing in their neighborhoods will lower the value of their homes.

The primary concerns seem to be that such housing developments will lead to higher levels of crime and poverty, as well as requiring wealthier residents to pay higher costs for services and education, according to a 2012 study of “not in my back yard,” or NYMBY, opposition. These concerns are particularly acute when multiple projects are clustered closely together, reminding many Americans of public housing projects that concentrated poverty and crime in the mid-20th century.

But today’s affordable housing developments are different than those of the past, which were often cheaply built and poorly maintained. The Low-Income Housing Tax Credit program supports private developers who have an incentive to build high-quality buildings and implement good property management.

Although local homeowners often oppose these buildings, our results show that they are less cause for concern than people may think.

What still isn’t known

We didn’t measure the effects of the new developments on area rental prices, so we don’t know how the subsidized rental units affected rents in unsubsidized properties nearby. That is a subject for future research. Similarly, while we demonstrated statistically that the developments themselves catalyzed the positive changes in values, we did not examine which particular aspects of the developments were the primary drivers of that change.

What’s next

We’re currently finishing up our follow-up study in Los Angeles – another large city but with very different dynamics from Chicago’s. Our findings, which are currently undergoing peer review, show markedly similar effects, though we found the biggest gains in property values after multiple projects in a neighborhood.

We also are examining whether the observed property value effects differ when factoring in the size of the building, the presence of market-rate units and the type of developer.

Sean Zielenbach, president of SZ Consulting and a co-author of the study, contributed to this article.The Conversation

About the Author:

Anthony W. Orlando, Assistant Professor of Finance, Real Estate and Law, California State Polytechnic University, Pomona

This article is republished from The Conversation under a Creative Commons license. Read the original article.

RoboForex becomes the Official Sponsor of the South American Football Club Cienciano

October 27, 2022

Belize City, Belize

RoboForex, a leading global provider of services on financial markets, announces to become an official sponsor of the professional football club Cienciano. Cienciano is a professional football club based in Cusco, Peru that currently plays in the Peruvian Primera División. The contract is for the period 2022-2023.

RoboForex has among its priorities the realization of works with which it can demonstrate social responsibility. Without geographic limits, and without distinction of areas of concern (sports, health, environment, community, education…) this company tries to give back to society all the trust and solidarity that have been granted to it since the beginning of its operations. Recently, a part of this social responsibility has taken shape in Peru.

In this Latin American nation, RoboForex has built a productive and harmonious link with a football team that enjoys well-deserved and traditional popular support. Club Cienciano has to its credit two international trophies that place it on the world football stage. Born in Cusco on July 8, 1901, it is considered one of the oldest football clubs in the country and is called “America’s Dad”. Its stadium is named after a Spanish-Inca writer known as Inca Garcilaso de la Vega.

The outstanding trajectory of this club and its deep-rooted fans are the reasons why RoboForex participates in a sponsorship agreement that favours the training and performance of Cienciano football. Initially, this sponsorship agreement will be in force until 2023. It is expected that RoboForex’s contribution will help the club to increase its potential and win every match and every championship. In addition, it is projected that the city of Cusco and Peru as a whole will obtain important benefits that go beyond sports. RoboForex, in alliance with Club Cienciano, intends to carry out social works that have an impact on the welfare of several communities. Indeed, on September seventeenth of this year, two hundred football balls were donated. This donation benefited schools in Cusco that need support to develop their sports activities.

In the officialization activity the CBO of the RoboForex company in Latin America Sami Otman has expressed, “We have been captivated by Peru, by its people, its culture, its history and by the great club that is Cienciano. Which reaffirms the commitment RoboForex has made to the club and to all of Peru”

The cheers that Peruvians dedicate to their football club will encourage RoboForex’s performance as a financial company with social responsibility.

About RoboForex

RoboForex is a company which delivers brokerage services. The company provides traders who work in financial markets with access to its proprietary trading platforms. RoboForex Ltd has the brokerage licence FSC 000138/333. More detailed information about the Company’s products and activities can be found on the official website at roboforex.com.