By InvestMacro
Here are the latest charts and statistics for the Commitment of Traders (COT) reports data published by the Commodities Futures Trading Commission (CFTC).
The latest COT data is updated through Tuesday October 25th and shows a quick view of how large traders (for-profit speculators and commercial hedgers) were positioned in the futures markets.
Weekly Speculator Changes led by Eurodollar and 10-Year Bond
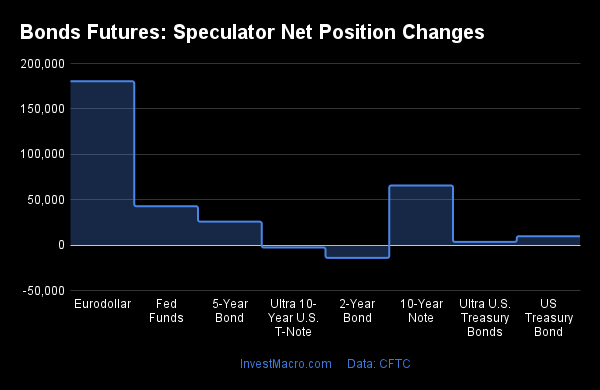
The COT bond market speculator bets were higher this week as six out of the eight bond markets we cover had higher positioning this week while two markets had lower contracts.
Leading the weekly gains for the bond markets was the Eurodollar (180,417 contracts) with the 10-Year Bond (65,690 contracts), the Fed Funds (42,830 contracts), the 5-Year Bond (25,832 contracts), the Long US Bond (9,780 contracts) and the Ultra US Bond (3,496 contracts)also showing a positive week.
The bond markets leading the weekly declines in speculator bets this week was the 2-Year Bond (-14,084 contracts) with the Ultra 10-Year (-2,695 contracts) also realizing lower bets on the week.
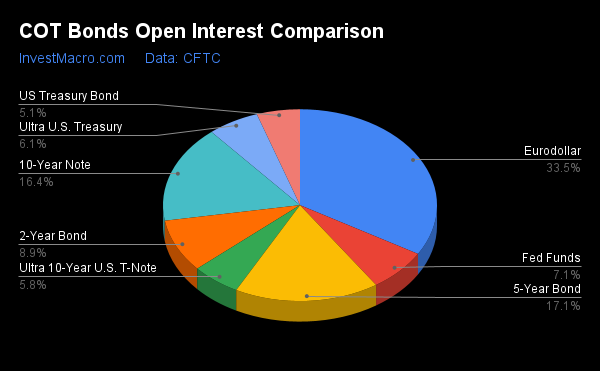
| Oct-25-2022 | OI | OI-Index | Spec-Net | Spec-Index | Com-Net | COM-Index | Smalls-Net | Smalls-Index |
|---|
| Eurodollar | 8,016,242 | 0 | -1,896,658 | 18 | 2,000,719 | 77 | -104,061 | 82 |
| FedFunds | 1,710,395 | 60 | 72,351 | 49 | -64,838 | 52 | -7,513 | 41 |
| 2-Year | 2,133,135 | 15 | -349,596 | 12 | 421,363 | 96 | -71,767 | 20 |
| Long T-Bond | 1,223,914 | 48 | -76,559 | 60 | 47,904 | 28 | 28,655 | 75 |
| 10-Year | 3,929,010 | 60 | -247,748 | 35 | 296,692 | 57 | -48,944 | 68 |
| 5-Year | 4,087,748 | 56 | -461,745 | 16 | 546,157 | 80 | -84,412 | 58 |
Strength Scores led by US Long Treasury Bond
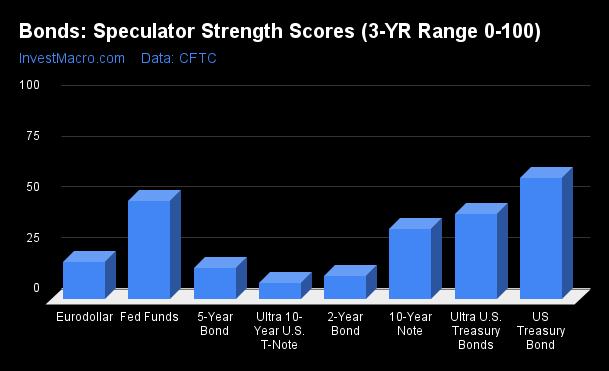
Strength Scores (a normalized measure of Speculator positions over a 3-Year range, from 0 to 100 where above 80 is extreme bullish and below 20 is extreme bearish) showed that the US Treasury Bond (59.7 percent) continues to lead the bonds category this week.
On the downside, the Ultra 10-Year Bond (8.2 percent), the 2-Year Bond (11.7 percent), 5-Year Bond (15.7 percent) and the Eurodollar (18.2 percent) come in at the lowest strength levels currently and are all in bearish extreme positions (below 20 percent).
Strength Statistics:
Fed Funds (48.6 percent) vs Fed Funds previous week (43.3 percent)
2-Year Bond (11.7 percent) vs 2-Year Bond previous week (14.5 percent)
5-Year Bond (15.7 percent) vs 5-Year Bond previous week (11.8 percent)
10-Year Bond (34.8 percent) vs 10-Year Bond previous week (24.8 percent)
Ultra 10-Year Bond (8.2 percent) vs Ultra 10-Year Bond previous week (8.9 percent)
US Treasury Bond (59.7 percent) vs US Treasury Bond previous week (56.5 percent)
Ultra US Treasury Bond (42.0 percent) vs Ultra US Treasury Bond previous week (40.6 percent)
Eurodollar (18.2 percent) vs Eurodollar previous week (14.9 percent)
Eurodollar leads the weekly Strength Trends
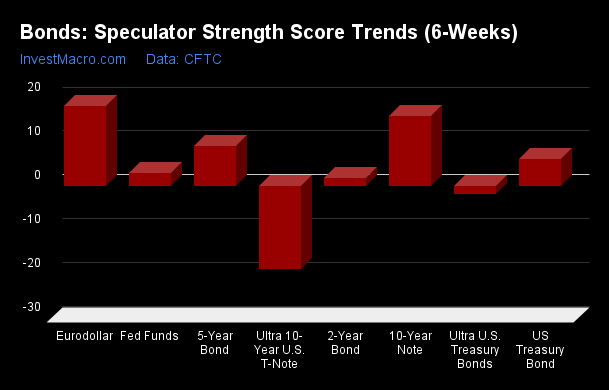
Strength Score Trends (or move index, calculates the 6-week changes in strength scores) showed that the Eurodollar (18.1 percent) leads the past six weeks trends for bonds. The 10-Year Bond (16.0 percent), the 5-Year Bond (9.0 percent)and the US Treasury Bond (6.0 percent) fill out the next top movers in the latest trends data.
The Ultra 10-Year Bond (-18.9 percent) leads the downside trend scores currently while the next market with lower trend scores was the Ultra US Treasury Bond (-1.8 percent).
Strength Trend Statistics:
Fed Funds (3.0 percent) vs Fed Funds previous week (1.3 percent)
2-Year Bond (1.7 percent) vs 2-Year Bond previous week (-1.8 percent)
5-Year Bond (9.0 percent) vs 5-Year Bond previous week (2.8 percent)
10-Year Bond (16.0 percent) vs 10-Year Bond previous week (9.6 percent)
Ultra 10-Year Bond (-18.9 percent) vs Ultra 10-Year Bond previous week (-14.0 percent)
US Treasury Bond (6.0 percent) vs US Treasury Bond previous week (-0.4 percent)
Ultra US Treasury Bond (-1.8 percent) vs Ultra US Treasury Bond previous week (1.2 percent)
Eurodollar (18.1 percent) vs Eurodollar previous week (13.0 percent)
Individual Bond Markets:
3-Month Eurodollars Futures:
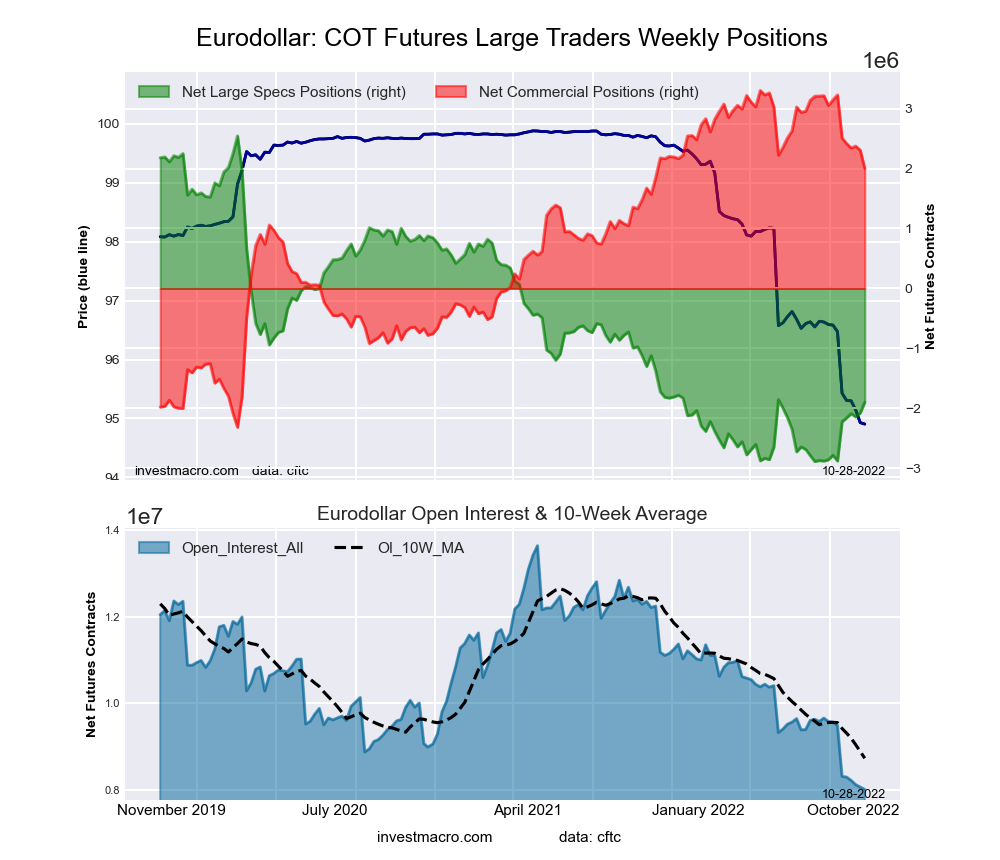 The 3-Month Eurodollars large speculator standing this week totaled a net position of -1,896,658 contracts in the data reported through Tuesday. This was a weekly advance of 180,417 contracts from the previous week which had a total of -2,077,075 net contracts.
This week’s current strength score (the trader positioning range over the past three years, measured from 0 to 100) shows the speculators are currently Bearish-Extreme with a score of 18.2 percent. The commercials are Bullish with a score of 76.9 percent and the small traders (not shown in chart) are Bullish-Extreme with a score of 81.6 percent.
| 3-Month Eurodollars Statistics | SPECULATORS | COMMERCIALS | SMALL TRADERS |
| – Percent of Open Interest Longs: | 8.0 | 65.8 | 7.2 |
| – Percent of Open Interest Shorts: | 31.6 | 40.9 | 8.5 |
| – Net Position: | -1,896,658 | 2,000,719 | -104,061 |
| – Gross Longs: | 638,484 | 5,275,368 | 577,900 |
| – Gross Shorts: | 2,535,142 | 3,274,649 | 681,961 |
| – Long to Short Ratio: | 0.3 to 1 | 1.6 to 1 | 0.8 to 1 |
| NET POSITION TREND: | | | |
| – Strength Index Score (3 Year Range Pct): | 18.2 | 76.9 | 81.6 |
| – Strength Index Reading (3 Year Range): | Bearish-Extreme | Bullish | Bullish-Extreme |
| NET POSITION MOVEMENT INDEX: | | | |
| – 6-Week Change in Strength Index: | 18.1 | -21.8 | 54.1 |
30-Day Federal Funds Futures:
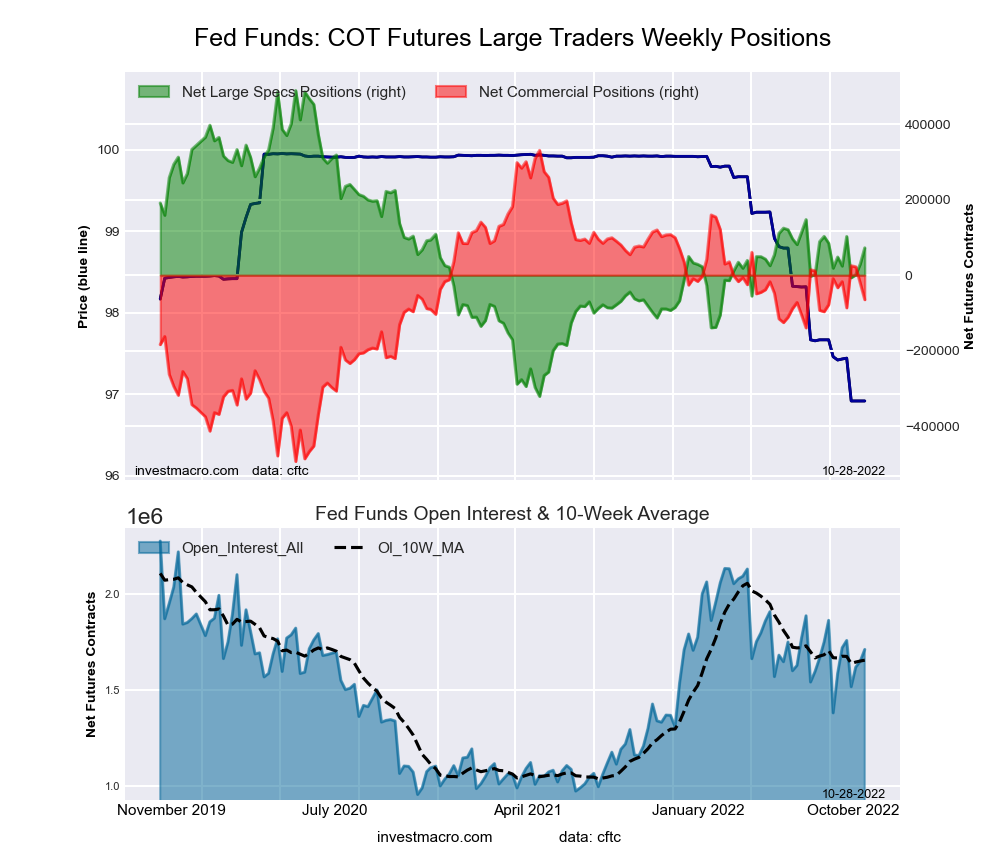 The 30-Day Federal Funds large speculator standing this week totaled a net position of 72,351 contracts in the data reported through Tuesday. This was a weekly advance of 42,830 contracts from the previous week which had a total of 29,521 net contracts.
This week’s current strength score (the trader positioning range over the past three years, measured from 0 to 100) shows the speculators are currently Bearish with a score of 48.6 percent. The commercials are Bullish with a score of 52.0 percent and the small traders (not shown in chart) are Bearish with a score of 40.5 percent.
| 30-Day Federal Funds Statistics | SPECULATORS | COMMERCIALS | SMALL TRADERS |
| – Percent of Open Interest Longs: | 16.0 | 68.8 | 1.6 |
| – Percent of Open Interest Shorts: | 11.7 | 72.6 | 2.1 |
| – Net Position: | 72,351 | -64,838 | -7,513 |
| – Gross Longs: | 273,129 | 1,177,282 | 27,698 |
| – Gross Shorts: | 200,778 | 1,242,120 | 35,211 |
| – Long to Short Ratio: | 1.4 to 1 | 0.9 to 1 | 0.8 to 1 |
| NET POSITION TREND: | | | |
| – Strength Index Score (3 Year Range Pct): | 48.6 | 52.0 | 40.5 |
| – Strength Index Reading (3 Year Range): | Bearish | Bullish | Bearish |
| NET POSITION MOVEMENT INDEX: | | | |
| – 6-Week Change in Strength Index: | 3.0 | -3.8 | 18.6 |
2-Year Treasury Note Futures:
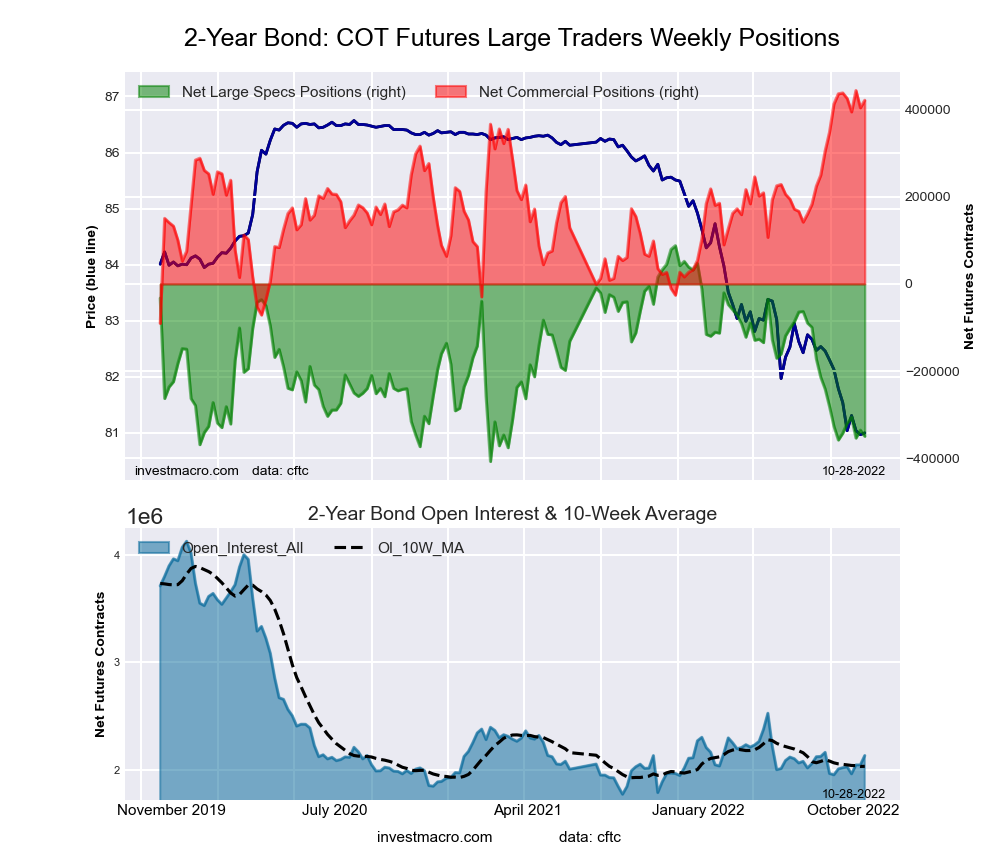 The 2-Year Treasury Note large speculator standing this week totaled a net position of -349,596 contracts in the data reported through Tuesday. This was a weekly reduction of -14,084 contracts from the previous week which had a total of -335,512 net contracts.
This week’s current strength score (the trader positioning range over the past three years, measured from 0 to 100) shows the speculators are currently Bearish-Extreme with a score of 11.7 percent. The commercials are Bullish-Extreme with a score of 95.7 percent and the small traders (not shown in chart) are Bearish with a score of 20.0 percent.
| 2-Year Treasury Note Statistics | SPECULATORS | COMMERCIALS | SMALL TRADERS |
| – Percent of Open Interest Longs: | 7.1 | 83.1 | 7.5 |
| – Percent of Open Interest Shorts: | 23.5 | 63.4 | 10.9 |
| – Net Position: | -349,596 | 421,363 | -71,767 |
| – Gross Longs: | 151,517 | 1,773,452 | 159,922 |
| – Gross Shorts: | 501,113 | 1,352,089 | 231,689 |
| – Long to Short Ratio: | 0.3 to 1 | 1.3 to 1 | 0.7 to 1 |
| NET POSITION TREND: | | | |
| – Strength Index Score (3 Year Range Pct): | 11.7 | 95.7 | 20.0 |
| – Strength Index Reading (3 Year Range): | Bearish-Extreme | Bullish-Extreme | Bearish |
| NET POSITION MOVEMENT INDEX: | | | |
| – 6-Week Change in Strength Index: | 1.7 | -2.9 | 2.8 |
5-Year Treasury Note Futures:
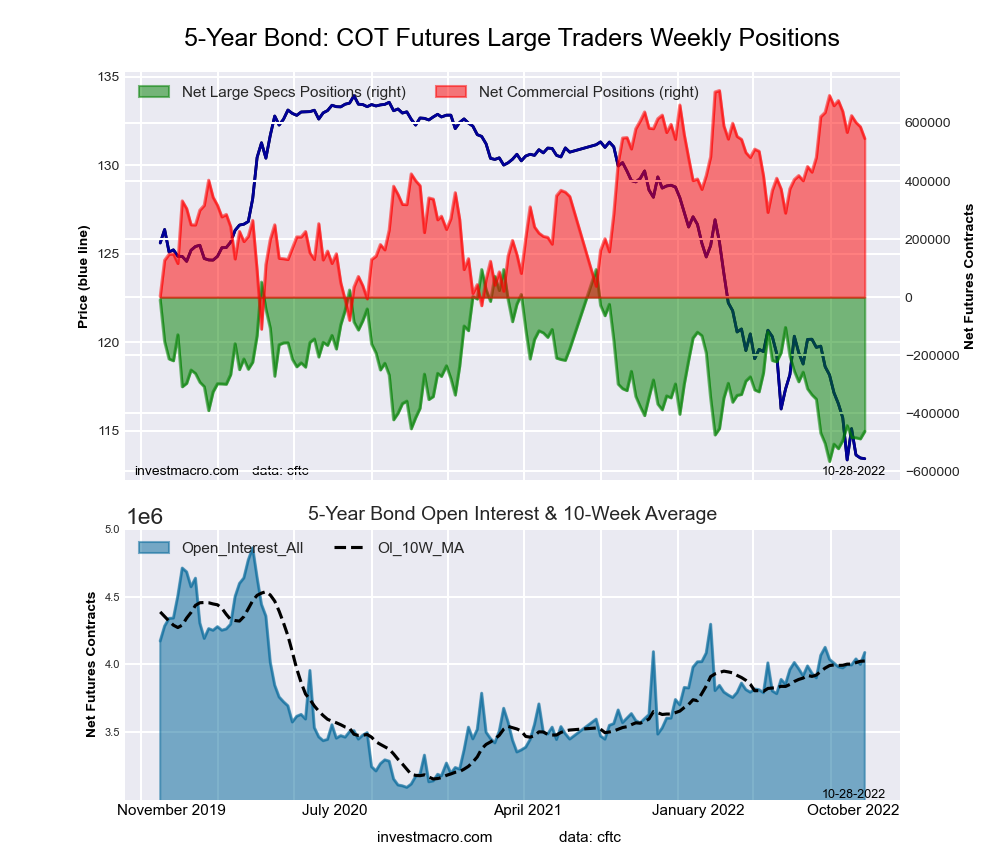 The 5-Year Treasury Note large speculator standing this week totaled a net position of -461,745 contracts in the data reported through Tuesday. This was a weekly rise of 25,832 contracts from the previous week which had a total of -487,577 net contracts.
This week’s current strength score (the trader positioning range over the past three years, measured from 0 to 100) shows the speculators are currently Bearish-Extreme with a score of 15.7 percent. The commercials are Bullish with a score of 79.9 percent and the small traders (not shown in chart) are Bullish with a score of 57.9 percent.
| 5-Year Treasury Note Statistics | SPECULATORS | COMMERCIALS | SMALL TRADERS |
| – Percent of Open Interest Longs: | 5.9 | 85.1 | 7.8 |
| – Percent of Open Interest Shorts: | 17.2 | 71.8 | 9.9 |
| – Net Position: | -461,745 | 546,157 | -84,412 |
| – Gross Longs: | 239,313 | 3,479,211 | 320,339 |
| – Gross Shorts: | 701,058 | 2,933,054 | 404,751 |
| – Long to Short Ratio: | 0.3 to 1 | 1.2 to 1 | 0.8 to 1 |
| NET POSITION TREND: | | | |
| – Strength Index Score (3 Year Range Pct): | 15.7 | 79.9 | 57.9 |
| – Strength Index Reading (3 Year Range): | Bearish-Extreme | Bullish | Bullish |
| NET POSITION MOVEMENT INDEX: | | | |
| – 6-Week Change in Strength Index: | 9.0 | -15.9 | 19.5 |
10-Year Treasury Note Futures:
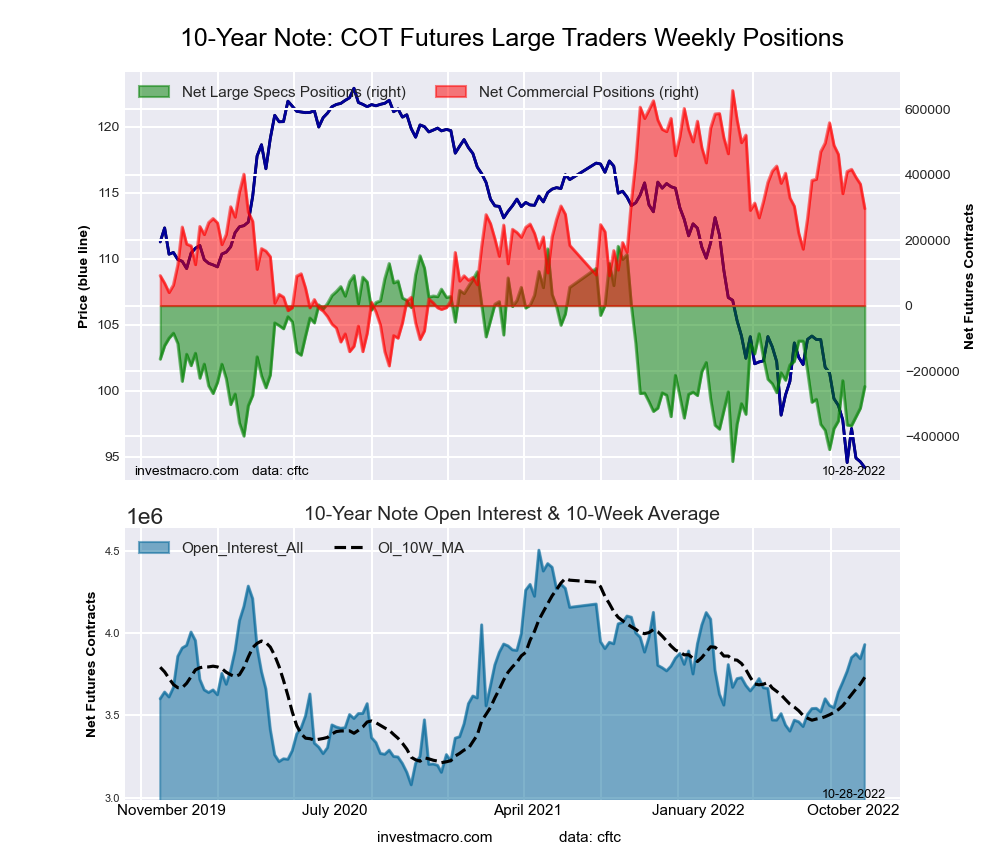 The 10-Year Treasury Note large speculator standing this week totaled a net position of -247,748 contracts in the data reported through Tuesday. This was a weekly increase of 65,690 contracts from the previous week which had a total of -313,438 net contracts.
This week’s current strength score (the trader positioning range over the past three years, measured from 0 to 100) shows the speculators are currently Bearish with a score of 34.8 percent. The commercials are Bullish with a score of 57.1 percent and the small traders (not shown in chart) are Bullish with a score of 68.4 percent.
| 10-Year Treasury Note Statistics | SPECULATORS | COMMERCIALS | SMALL TRADERS |
| – Percent of Open Interest Longs: | 11.5 | 76.8 | 9.3 |
| – Percent of Open Interest Shorts: | 17.9 | 69.3 | 10.5 |
| – Net Position: | -247,748 | 296,692 | -48,944 |
| – Gross Longs: | 453,643 | 3,019,262 | 363,812 |
| – Gross Shorts: | 701,391 | 2,722,570 | 412,756 |
| – Long to Short Ratio: | 0.6 to 1 | 1.1 to 1 | 0.9 to 1 |
| NET POSITION TREND: | | | |
| – Strength Index Score (3 Year Range Pct): | 34.8 | 57.1 | 68.4 |
| – Strength Index Reading (3 Year Range): | Bearish | Bullish | Bullish |
| NET POSITION MOVEMENT INDEX: | | | |
| – 6-Week Change in Strength Index: | 16.0 | -19.7 | 14.4 |
Ultra 10-Year Notes Futures:
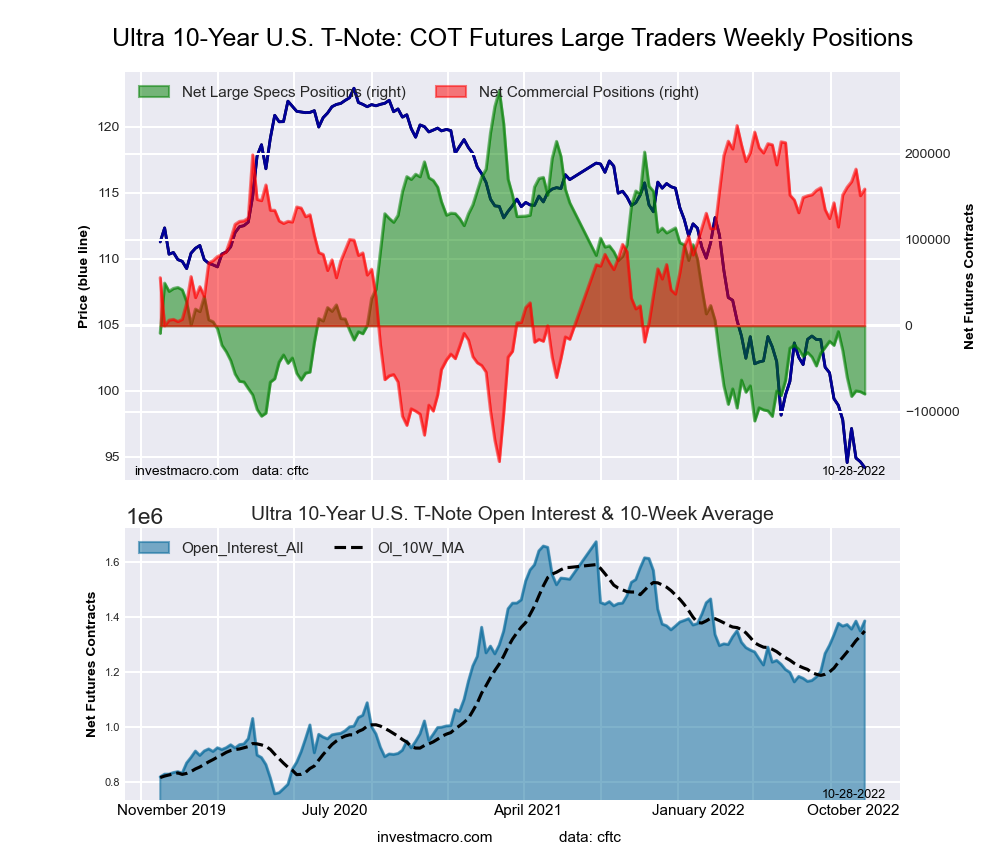 The Ultra 10-Year Notes large speculator standing this week totaled a net position of -79,346 contracts in the data reported through Tuesday. This was a weekly lowering of -2,695 contracts from the previous week which had a total of -76,651 net contracts.
This week’s current strength score (the trader positioning range over the past three years, measured from 0 to 100) shows the speculators are currently Bearish-Extreme with a score of 8.2 percent. The commercials are Bullish-Extreme with a score of 81.1 percent and the small traders (not shown in chart) are Bullish with a score of 74.1 percent.
| Ultra 10-Year Notes Statistics | SPECULATORS | COMMERCIALS | SMALL TRADERS |
| – Percent of Open Interest Longs: | 7.2 | 81.2 | 10.9 |
| – Percent of Open Interest Shorts: | 12.9 | 69.7 | 16.6 |
| – Net Position: | -79,346 | 159,023 | -79,677 |
| – Gross Longs: | 100,026 | 1,124,960 | 150,789 |
| – Gross Shorts: | 179,372 | 965,937 | 230,466 |
| – Long to Short Ratio: | 0.6 to 1 | 1.2 to 1 | 0.7 to 1 |
| NET POSITION TREND: | | | |
| – Strength Index Score (3 Year Range Pct): | 8.2 | 81.1 | 74.1 |
| – Strength Index Reading (3 Year Range): | Bearish-Extreme | Bullish-Extreme | Bullish |
| NET POSITION MOVEMENT INDEX: | | | |
| – 6-Week Change in Strength Index: | -18.9 | 11.3 | 18.8 |
US Treasury Bonds Futures:
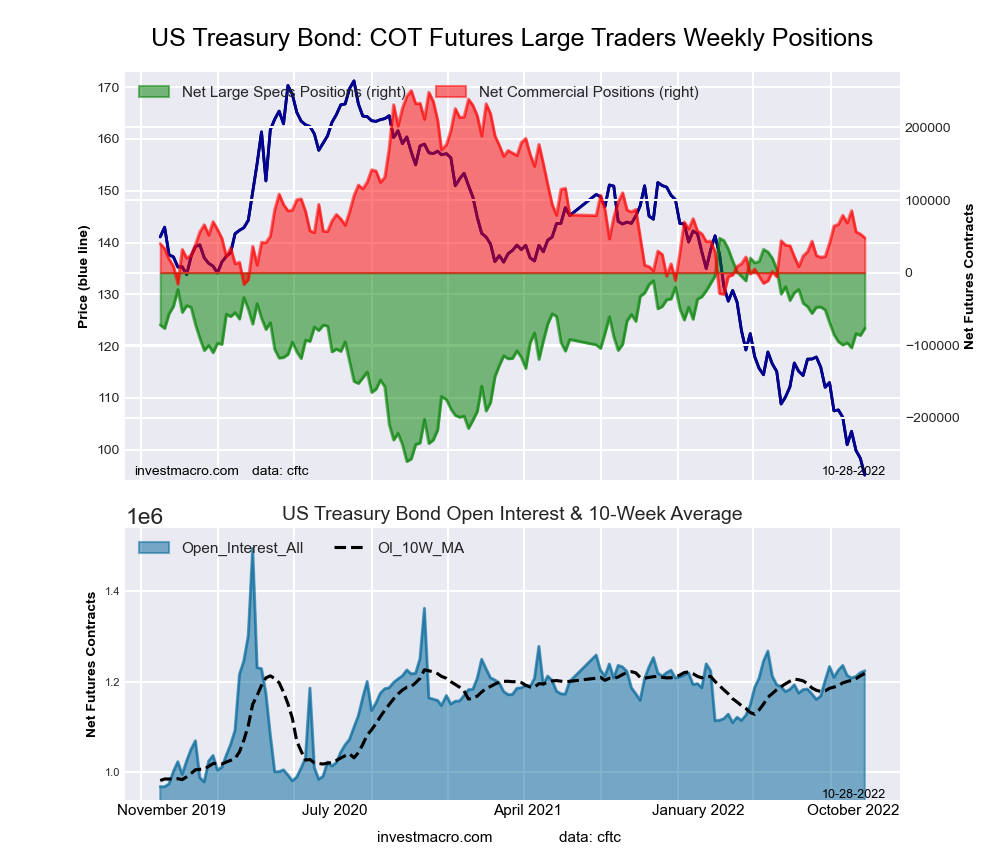 The US Treasury Bonds large speculator standing this week totaled a net position of -76,559 contracts in the data reported through Tuesday. This was a weekly increase of 9,780 contracts from the previous week which had a total of -86,339 net contracts.
This week’s current strength score (the trader positioning range over the past three years, measured from 0 to 100) shows the speculators are currently Bullish with a score of 59.7 percent. The commercials are Bearish with a score of 27.7 percent and the small traders (not shown in chart) are Bullish with a score of 75.3 percent.
| US Treasury Bonds Statistics | SPECULATORS | COMMERCIALS | SMALL TRADERS |
| – Percent of Open Interest Longs: | 6.9 | 78.0 | 14.0 |
| – Percent of Open Interest Shorts: | 13.2 | 74.1 | 11.7 |
| – Net Position: | -76,559 | 47,904 | 28,655 |
| – Gross Longs: | 84,406 | 954,865 | 171,735 |
| – Gross Shorts: | 160,965 | 906,961 | 143,080 |
| – Long to Short Ratio: | 0.5 to 1 | 1.1 to 1 | 1.2 to 1 |
| NET POSITION TREND: | | | |
| – Strength Index Score (3 Year Range Pct): | 59.7 | 27.7 | 75.3 |
| – Strength Index Reading (3 Year Range): | Bullish | Bearish | Bullish |
| NET POSITION MOVEMENT INDEX: | | | |
| – 6-Week Change in Strength Index: | 6.0 | -6.6 | 0.2 |
Ultra US Treasury Bonds Futures:
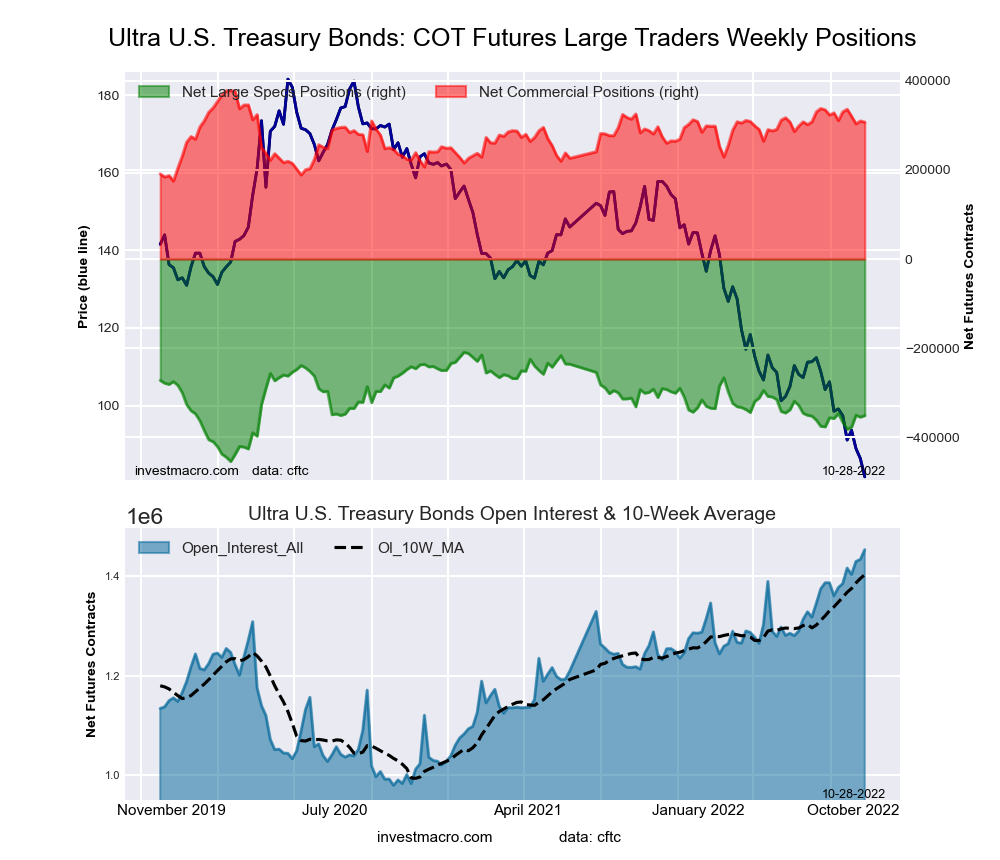 The Ultra US Treasury Bonds large speculator standing this week totaled a net position of -351,022 contracts in the data reported through Tuesday. This was a weekly rise of 3,496 contracts from the previous week which had a total of -354,518 net contracts.
This week’s current strength score (the trader positioning range over the past three years, measured from 0 to 100) shows the speculators are currently Bearish with a score of 42.0 percent. The commercials are Bullish with a score of 62.5 percent and the small traders (not shown in chart) are Bullish with a score of 68.0 percent.
| Ultra US Treasury Bonds Statistics | SPECULATORS | COMMERCIALS | SMALL TRADERS |
| – Percent of Open Interest Longs: | 6.6 | 81.6 | 11.3 |
| – Percent of Open Interest Shorts: | 30.7 | 60.5 | 8.3 |
| – Net Position: | -351,022 | 307,021 | 44,001 |
| – Gross Longs: | 95,630 | 1,185,802 | 164,658 |
| – Gross Shorts: | 446,652 | 878,781 | 120,657 |
| – Long to Short Ratio: | 0.2 to 1 | 1.3 to 1 | 1.4 to 1 |
| NET POSITION TREND: | | | |
| – Strength Index Score (3 Year Range Pct): | 42.0 | 62.5 | 68.0 |
| – Strength Index Reading (3 Year Range): | Bearish | Bullish | Bullish |
| NET POSITION MOVEMENT INDEX: | | | |
| – 6-Week Change in Strength Index: | -1.8 | -1.9 | 6.5 |
Article By InvestMacro – Receive our weekly COT Newsletter
*COT Report: The COT data, released weekly to the public each Friday, is updated through the most recent Tuesday (data is 3 days old) and shows a quick view of how large speculators or non-commercials (for-profit traders) were positioned in the futures markets.
The CFTC categorizes trader positions according to commercial hedgers (traders who use futures contracts for hedging as part of the business), non-commercials (large traders who speculate to realize trading profits) and nonreportable traders (usually small traders/speculators) as well as their open interest (contracts open in the market at time of reporting). See CFTC criteria here.


