Expert Michael Ballanger reviews recent updates in the stock market to tell you where he believes it is headed and why he thinks October was “The Bear Killer,” with countless bear markets ending and bull markets possibly beginning today, November 1, 2022.
People familiar with my missives over the past couple of decades know me well enough to expect sudden and hard-to-explain shifts in positioning at the drop of a hat and with little or no advanced notice.
You also have grown to appreciate that technical analysis, an analytical tool increasingly use (and abused) by generations of relative novices to the world of securities analysis, today dominates everything.
How many times have I written about the dangers of “false breakouts” with the even more insidious “false breakdowns” as mortal traps to avoid?
On September 25 of last month, I penned Email Alert 2022-87, where I highlighted massive trend breakdowns in every major index in North America.
I was fully prepared to call a major sell signal until three days later when the Bank of England reversed their embarkation into QT and decided instead to return to QE to save their pension funds from certain implosion.
That was “the most important headline of 2022” because it confirmed the vulnerability of not just U.K. pension funds but literally every pension fund on the planet striving to meet their minimum 7.5% return needed to meet pensioner obligations. Why I deemed that as a significant event goes back to 1977 while in training with the venerable brokerage firm McLeod, Young & Weir Ltd.
Barring any surprises on Monday, the S&P 500 will clock in at its second-best or best performance month of the year, once again proving that, as I have been writing about all through September, October is known as “The Bear Killer” with countless bear markets ending and bull markets beginning by November 1, 2022.
I was working in the “quant” section, which was headed up by an English gentleman by the name of Peter Williams.
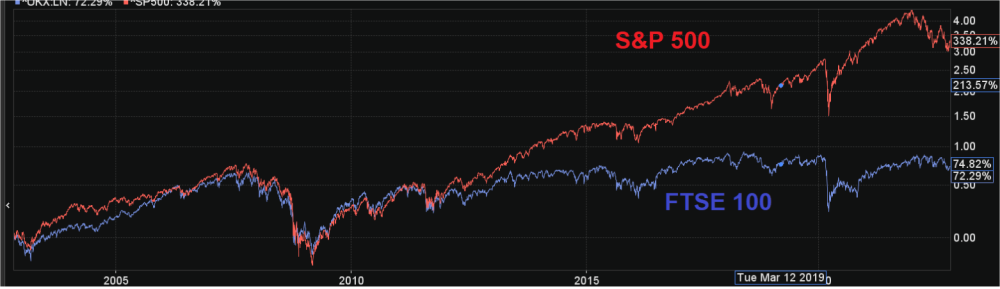
This was long before personal computers or cellular phones or the internet, so all pricing data had to be inputted manually, and while I was updating the prices for all major North American exchanges, I came across the chart of the “FTSE” (Financial Times Stock Index) which, I was soon to learn, was the British version of the Dow Jones Industrials.
I asked Peter why it was necessary to use a foreign stock market when all of our clients were North American. He proceeded to tell me that what happens to stock market trends in the U.K. always shows up in North America in due course.
Over the lunch hour, I drew an overlay of the FTSE onto the S&P chart and what materialized was a lead indicator for North American stocks in the form of the FTSE. Now, since the central banks hijacked the equity markets under Greenspan starting in the late 1980s, it is no longer as pronounced, but the significance lies in the event as opposed to the response.
Pension fund stress brought about by excessive leverage in the 10-year gilts market will unquestionably show up across the pond in North America, and it will include the insurance companies as well striving to meet their actuarial benchmarks.
Most importantly, do not think for a New York minute that Jerome Powell is unaware of this.
Needless to say, when the headline hit the tape about the Band of England’s sudden reversal from gilt seller to gilt buyer, I executed my own personal “pivot” and went from black bearish to pound-the-table bullish with my shift out of the volatility trade (UVXY:US) and into the double-leverage S&P 500 ETF known as UPRO:US (double leverage SPY:US).
The S&P 500 has since put on an 8.8% advance for the month of October, with only Halloween left on Monday.
To put this in perspective, the July rally was +9.11%, and that was before the FANGS (ex-Apple) decided to crater.
The Big Boys
All through October, I have had to answer a torrent of questions as to “Why are stocks rallying?” followed by a minimum of ten reasons they should actually be crashing.
The answer lies in three simple words — The Big Boys.
Who remembers the U.S. elections in November 2016 when the markets were in full “meltdown mode” due to a surprise victory by Republican Donald Trump?
The sheer panic of the post-results hours had stock investors in absolute terror as the S&P was down 8% by midnight. That was until Carl Icahn, and his billionaire buddies stepped up and took the futures straight north and just kept up the buying pressure until the early morning hours when stocks finally opened with wall-to-wall bids and CNBC in ecstasy.
All during the following post-election trading session, the financial news commentators, who were lambasting Trump the night before with stocks in freefall, suddenly changed their narrative such that the Trump victory went from bearish to bullish in less than twenty-four hours.
You really do not want any stock that is found in any of the heavily-leveraged S&P or NASDAQ ETFs because as leverage gets rinsed from the system, the names that dominate will be “on offer” for many more months.
Ever since J.P. Morgan stepped up and rescued Wall Street during the Panic of 1907, it has always been The Big Boys with their bottomless wallets and the ears of every desk trader on the planet that determine where stocks are going.
The secondary clue for me came in the form of a story leaked out of Blackrock that the Fed has already decided to pause, so despite what will still probably be a 75-beep rise in the FFR on Wednesday, the forward guidance will probably be construed as dovish.
Barring any surprises on Monday, the S&P 500 will clock in at its second-best or best performance month of the year, once again proving that, as I have been writing about all through September, October is known as “The Bear Killer” with countless bear markets ending and bull markets beginning by November 1, 2022.
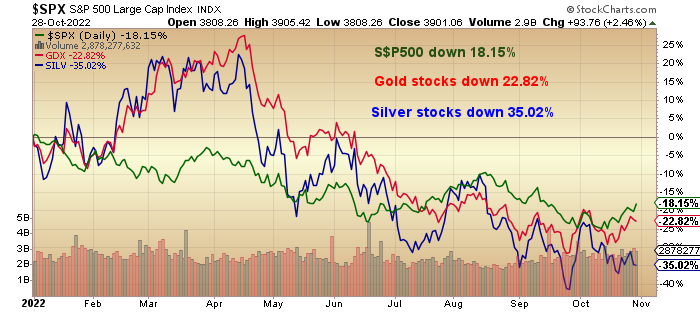
Make no mistake; the beautiful move in the UPRO call options and impending profits are pale when compared to the paper losses in the metals arena. Gold is down 13.43% YTD, with silver down 18.1% and copper off 22.98%.
Every single bullish narrative from 2020/2021 has been summarily vanquished by the 2022 bear market. In tightening cycles, that is what happens. You are repeating the mantra that “copper demand will rocket with the electrification movement,” and it matters not whether or not you turn out to be right on the money in 2023 because this is 2022 and the “electrification trade” is yesterday’s news.
Ditto the precious metals sector, where the senior producers are sporting pristine balance sheets and robust income statements, but no one cares about that because prices are in the tank.
Twenty years ago, Wall Street had thousands of stock analysts, usually C.P.A.’s, and usually C.F.A., that pored through thousands of annual reports and income statements in an attempt to discover an unknown gem commonly described as “undervalued.”
Today, there a perhaps a few dozen left. People that bought shares in companies like these were considered “value investors” as opposed to “growth investors,” and it is no secret that growth has outperformed value ever since the Fed hijacked markets.
Up until Jerome Powell told us all that he was no longer using the term “transitory” to describe the sharp rise in the cost of living, there was really no reason to own value stocks because they are typically lower risk, lower growth issues and with the Fed juicing the market every time it hiccupped, there was simply no need to own value because you were leaving a great portion of alpha (performance of an investment against a market index or benchmark that is considered to represent the market’s movement as a whole) on the table.
Markets that fail to go down into bad news are markets that should be bought.
The good news is that without the “Fed put” rescuing stocks at the faintest hint of corrective action, Wall Street is going to be forced to return to what the pundits like to call a “stock picker’s market,” which means that extraordinary value plays like the gold miners are going to come back onto the radar screens of the big funds.
That means that you really do not want any stock that is found in any of the heavily-leveraged S&P or NASDAQ ETFs because as leverage gets rinsed from the system, the names that dominate will be “on offer” for many more months.
What will avoid leverage purging are the value stocks that live and breathe on their own merits and without the artificial perpetual bids that arrive at the beginning of every month from these passive funds. The supply of stock that will need to be sold in the passive funds will be in stark contrast to the companies that never made it to the dance (inclusion in the ETF baskets).
The Junior Resource Sector
So where, pray tell, does that leave the junior resource sector?
Firstly, the junior gold stocks (producers, developers, and explorers) could not be expected to enter any kind of a mania resembling crypto or cannabis, or tech, with a gold price down 21.1% since August 2020.
In the period since that peak, we have seen massive fiscal and monetary stimulus, geopolitical turmoil, and bond market blow-ups, the nature of which in past eras would have money gushing into the metals.
However, the only place on the planet where that failed to occur was North America, where the dominance of the U.S. dollar neutralized any need for safe haven positioning because owning dollars (or living in a country that creates them) is the safe haven.
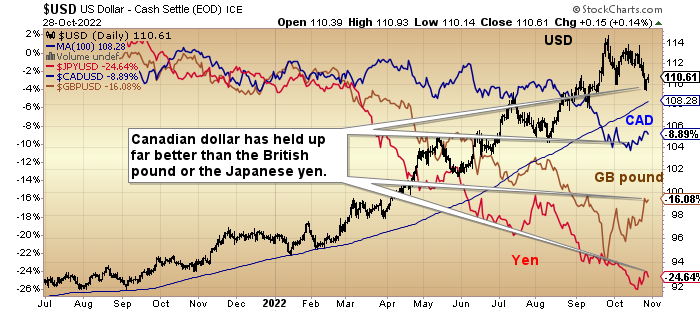
People in Turkey, Argentina, and Latin America have all seen their currencies decline against the greenback, so they have been buying vast quantities of gold and silver and benefitting greatly, in addition to moving huge amounts of domestic savings into the dollar.
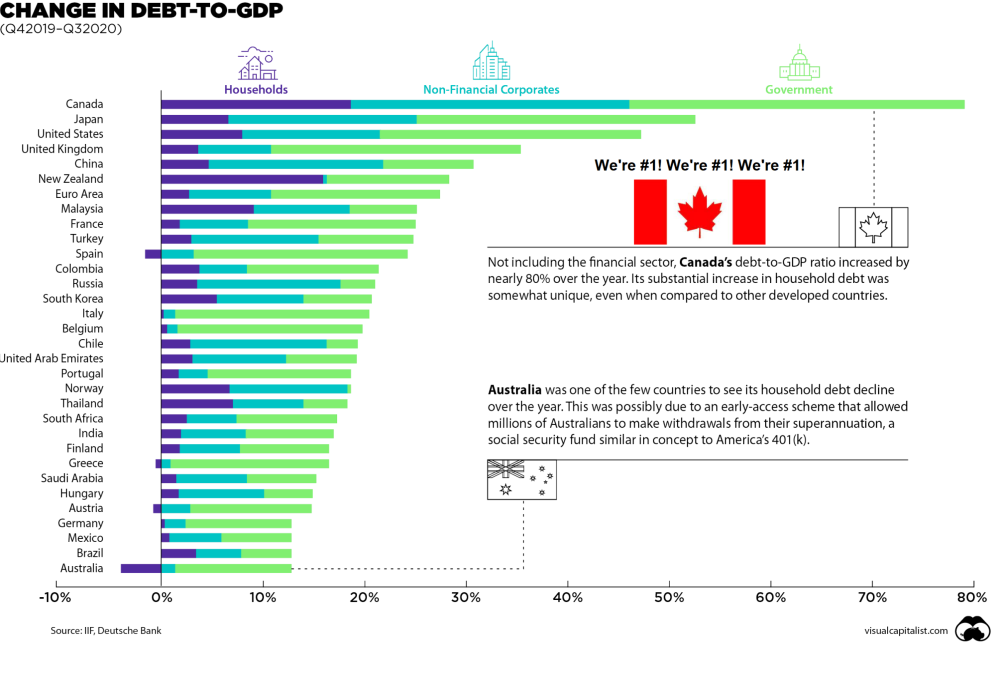
Canadian investors have seen their currency hold up incredibly well versus the USD, and for the life of me, I do not know why. Household debt-to-income levels are magnitudes higher than American levels pre-GFC in 2008.
The national debt-to-GDP numbers have Canada ahead of the U.S., Japan, the U.K., and China amidst the largest real estate bubble in the history of modern record-keeping.
One would think that of all the countries in the world in need of safe havens, Canada would be at the forefront.
The problem is that, unlike the U.S., Canada does not hold a reserve currency status, so no one is stockpiling Canadian dollars as an insurance policy against sovereign default.
The Canadian banks operate like miniature versions of the big U.S. banks, so currency traders focus on what the banks are doing rather than on what the government is doing, and therein lies the opportunity.
If anyone making investment decisions were watching the fiscal train wreck lying on the horizon, the CAD would be in the low CA$0.60’s versus the USD.
Canadian and American speculators once used the TSX Venture Exchange as their preferred non-casino location for gambling — owning those Canadian resource companies famous the world over for a) delivering phenomenal mineral discoveries resulting in enormous capital gains and b) fulfilling Mark Twain’s definition of a gold mine: “A hole in the ground with a liar at the top.”
Canadian exploration companies have indeed delivered some amazing returns but what must be recognized is the role of the promoter — the jockey — in advancing the project.
By default, the expectation levels are inflated because the only way to raise risk capital is to “sell the dream,” and while statistically, the odds of making a major discovery are long, that dream of owning an early-stage position in Hemlo or Eskay Creek or Voisey’s Bay remains firmly in place.
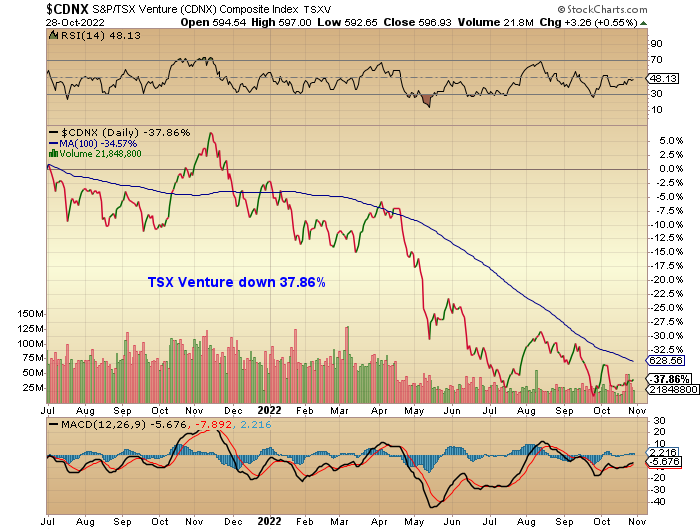
What the TSX Venture exchange needs desperately is for a series of new developments:
- S. dollar top
- New discovery with the attendant share price explosion
- Major market stability
- Commodity price reversal
All of the above conditions will occur at the point where financial system instability leaps ahead of price stability in the minds and actions of the U.S. Fed, along with the rest of the global central bank cabal. It is really that simple.
Since the first share of stock ever traded with owners back in Amsterdam in the 1600s, there have been speculators.
In fact, in the 70s, the old-time brokers would lecture me on the importance of being an investor where all one owned was high-quality bonds.
Stocks were for speculators, and bonds were for investors, but the fact remains that in the Canadian resource sector, new discoveries are 100%-funded by speculators.
In a world that has been devoid of any new discoveries and a huge drop-off in CAPEX related to exploration for and development of new deposits, there is going to be an enormous need for new discoveries, which means out of absolute necessity, exploration activity will increase dramatically.
Junior developers with growing resources — Getchell Gold Corp. (GTCH:CSE; GGLDF:OTCQB), Western Uranium & Vanadium Corp. (WUC:CSE; WSTRF:OTCQX). (WUC:CSE; WSTRF:OTCQX), Northisle Copper and Gold Inc. (NCX:TSX; NTCPF:OTCPK) — will be the first to catch a bid, followed by explorers that have large, district-scale land positions — MAX Resource Corp. (MAX:TSX.V; MXROF:OTCBB), Norseman Silver Ltd. (NOC:TSX.V; NOCSF:OTCQB), Goldcliff Resource Corp. (GCN:TSX.V; GCFFF:OTCBB).
The ones I own are all funded, eliminating the need for any panicking.
Have We Entered a New Bull Market?
Do I think we have entered a new bull market?
Was the low on October 13, 20222, “the low”?
I have no clue, but I will say this: Markets that fail to go down into bad news (earnings disappointments from AMZN, META, MSFT, and NFLX) are markets that should be bought.
The larger question is: “Can I buy stocks here for a seasonal trade into Q1/2023 that works?” I think so.
Maybe we wait until markets pull back after the big institutional money flows are finished allocating Tuesday-Thursday next week. With the corporate buyback blackout period ending at month-end, some US$5 billion in new buyback bids are going to get posted, giving more ammo to a market still dominated by put buyers and short sellers.
In fact, the Twitter feeds I get are rife with gnashing and gnarling of teeth over rising stock prices and an absolute bombardment of outrage that people would be so stupid as to actually think that the Fed will pivot. In other words, they missed the rally.
And there is nothing sourer than a FOMO/YOLO trader left out of the second-best move of the year. That tells me that sentiment is perfectly positioned for a Q3 rally into January, assuming, of course, that the Fed does nothing silly like ramp up the hawkish rhetoric.
The history books tell me that we are just about to exit the month known as “The Bear Killer,” and here in 2022, it lived up to expectations. Scrub from your minds the notion of all-time highs of US$200 silver or US$10 copper.
Instead, I will be focusing on companies that I see as undervalued in commodity sectors experiencing near-shortage conditions. As the markets heal, the bullish narratives for copper and uranium will return, with gold and silver still the two most mispriced metals on the planet.
Michael Ballanger Disclaimer:
This letter makes no guarantee or warranty on the accuracy or completeness of the data provided. Nothing contained herein is intended or shall be deemed to be investment advice, implied or otherwise. This letter represents my views and replicates trades that I am making but nothing more than that. Always consult your registered advisor to assist you with your investments. I accept no liability for any loss arising from the use of the data contained on this letter. Options and junior mining stocks contain a high level of risk that may result in the loss of part or all invested capital and therefore are suitable for experienced and professional investors and traders only. One should be familiar with the risks involved in junior mining and options trading and we recommend consulting a financial adviser if you feel you do not understand the risks involved.
Disclosures:
1) Michael J. Ballanger: I, or members of my immediate household or family, own securities of the following companies mentioned in this article: All. I personally am, or members of my immediate household or family are, paid by the following companies mentioned in this article: My company, Bonaventure Explorations Ltd., has a consulting relationship with Norseman Silver.
2) The following companies mentioned in this article are billboard sponsors of Streetwise Reports: None. Click here for important disclosures about sponsor fees. As of the date of this article, an affiliate of Streetwise Reports has a consulting relationship with Western Uranium & Vanadium Corp. Please click here for more information.
3) Statements and opinions expressed are the opinions of the author and not of Streetwise Reports or its officers. The author is wholly responsible for the validity of the statements. The author was not paid by Streetwise Reports for this article. Streetwise Reports was not paid by the author to publish or syndicate this article. Streetwise Reports requires contributing authors to disclose any shareholdings in, or economic relationships with, companies that they write about. Streetwise Reports relies upon the authors to accurately provide this information and Streetwise Reports has no means of verifying its accuracy.
4) This article does not constitute investment advice. Each reader is encouraged to consult with his or her individual financial professional and any action a reader takes as a result of information presented here is his or her own responsibility. By opening this page, each reader accepts and agrees to Streetwise Reports’ terms of use and full legal disclaimer. This article is not a solicitation for investment. Streetwise Reports does not render general or specific investment advice and the information on Streetwise Reports should not be considered a recommendation to buy or sell any security. Streetwise Reports does not endorse or recommend the business, products, services or securities of any company mentioned on Streetwise Reports.
5) From time to time, Streetwise Reports LLC and its directors, officers, employees or members of their families, as well as persons interviewed for articles and interviews on the site, may have a long or short position in securities mentioned. Directors, officers, employees or members of their immediate families are prohibited from making purchases and/or sales of those securities in the open market or otherwise from the time of the decision to publish an article until three business days after the publication of the article. The foregoing prohibition does not apply to articles that in substance only restate previously published company releases.
As of the date of this article, officers and/or employees of Streetwise Reports LLC (including members of their household) own securities of Getchell Gold Corp., Norseman Silver Ltd., and Western Uranium & Vanadium Corp., companies mentioned in this article.