
By InvestMacro | COT | Data Tables | COT Leaders | Downloads | COT Newsletter
Here are the latest charts and statistics for the Commitment of Traders (COT) data published by the Commodities Futures Trading Commission (CFTC).
The latest COT data is updated through Tuesday January 4th 2022 and shows a quick view of how large traders (for-profit speculators and commercial entities) were positioned in the futures markets.
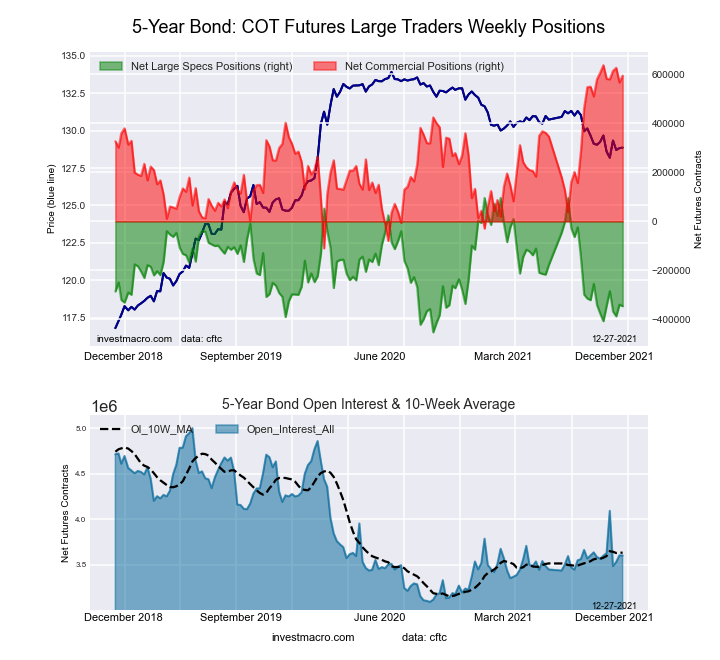
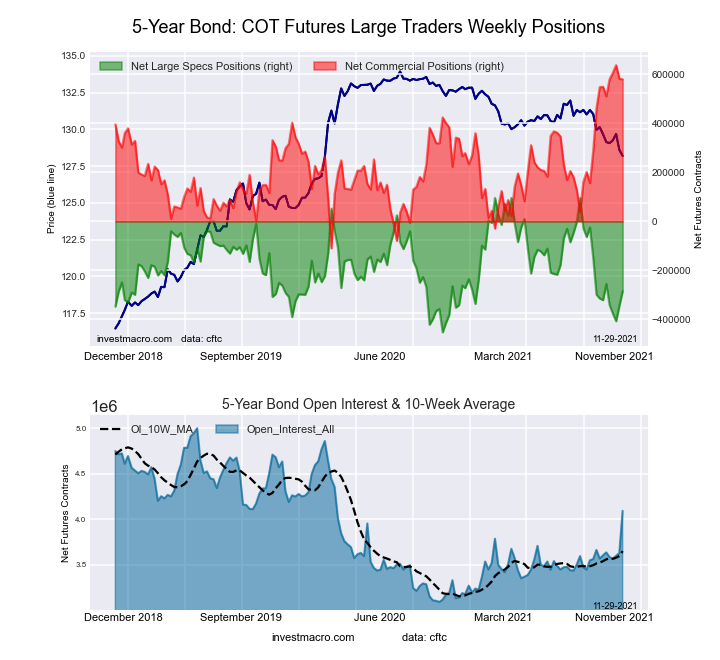
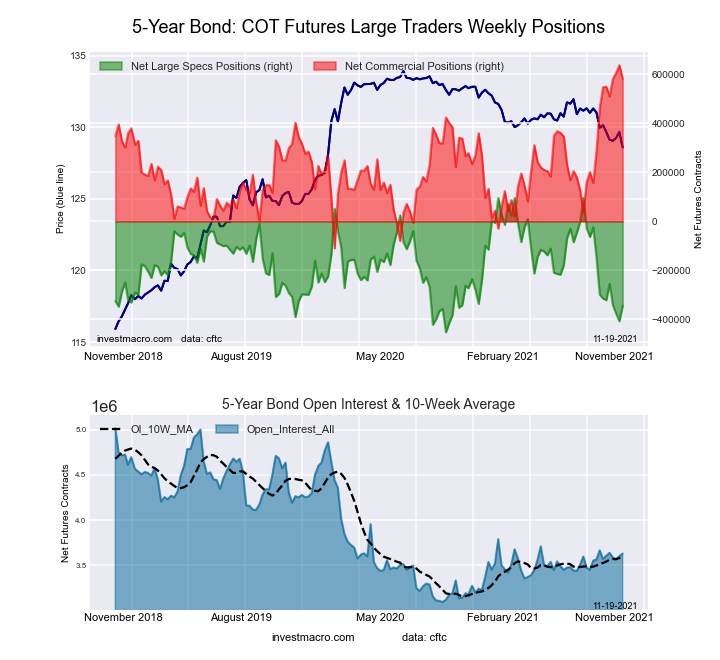
Highlighting the COT bonds data is the sharp drop in the 5-Year Bond futures bets. The speculators net position this week fell by -104,188 contracts which marked the largest one-week decline since September and brought the overall net position down to -402,875 contracts. This is the most bearish speculator standing since November 9th and the second most in the past year. The current speculator strength score (current level compared to past three years of data where above 80 is bullish-extreme and below 20 is bearish-extreme) shows a bearish-extreme reading at just a 9.1 percent score for the week.
The speculator positions that rose this week were the Eurodollar (18,792 contracts), FedFunds (8,038 contracts) and the Ultra US Bond (11,116 contracts) while decreasing bets were seen in the 2-Year Bond (-45,805 contracts), 5-Year (-104,188 contracts), 10-Year (-63,613 contracts), Ultra 10-Year (-17,211 contracts) and the Long US Bond (-29,595 contracts).
| Jan-04-2022 | OI | OI-Index | Spec-Net | Spec-Index | Com-Net | COM-Index | Smalls-Net | Smalls-Index |
|---|---|---|---|---|---|---|---|---|
| Eurodollar | 11,248,084 | 50 | -1,809,056 | 0 | 2,193,324 | 100 | -384,268 | 23 |
| FedFunds | 1,306,160 | 24 | -85,291 | 29 | 99,441 | 72 | -14,150 | 27 |
| 2-Year | 1,947,598 | 7 | 41,999 | 91 | 26,847 | 26 | -68,846 | 2 |
| Long T-Bond | 1,210,353 | 51 | -49,550 | 76 | 27,261 | 29 | 22,289 | 70 |
| 10-Year | 3,875,093 | 56 | -276,923 | 29 | 516,075 | 86 | -239,152 | 23 |
| 5-Year | 3,702,047 | 32 | -402,875 | 9 | 661,633 | 100 | -258,758 | 10 |
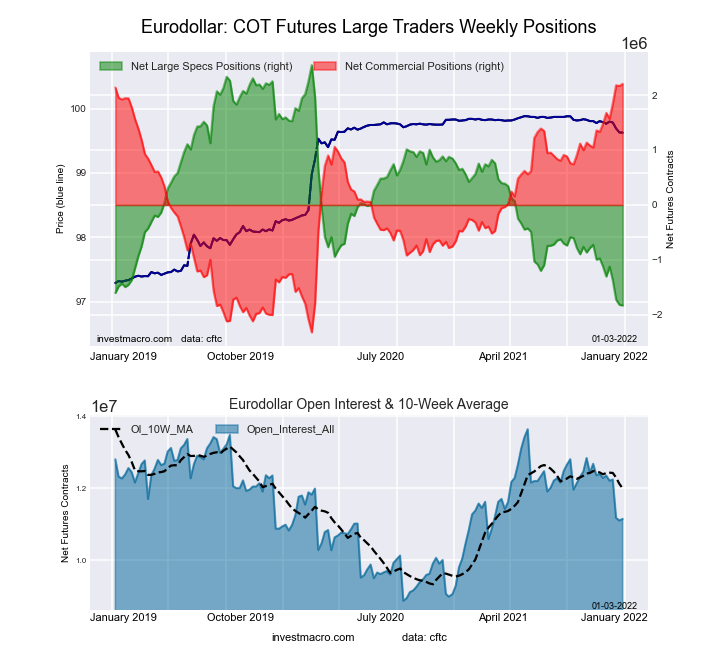
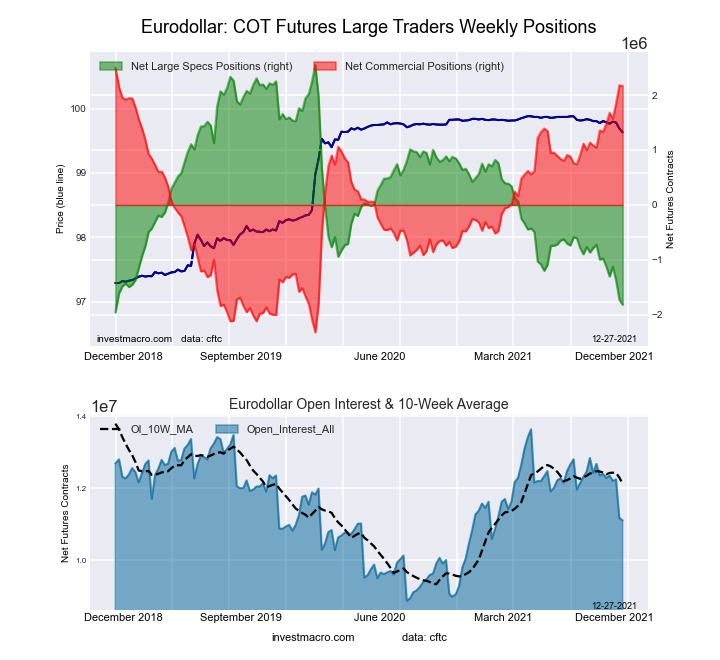
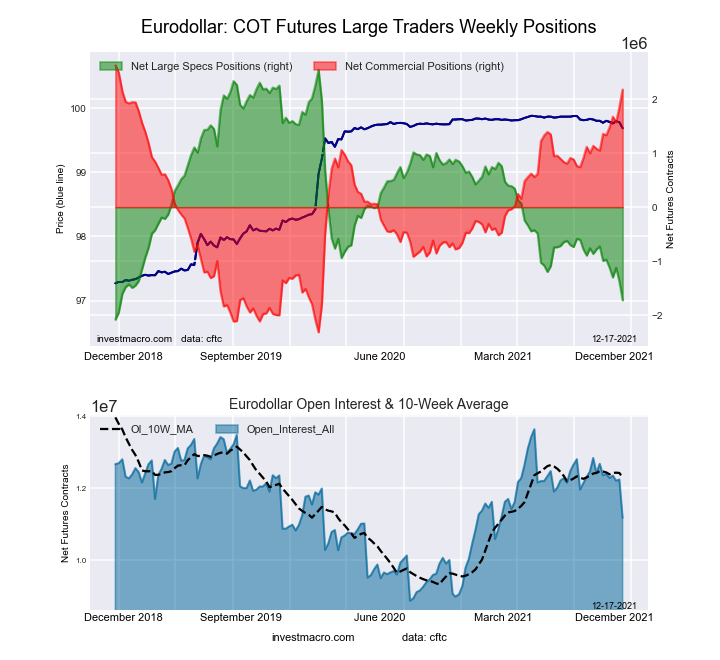
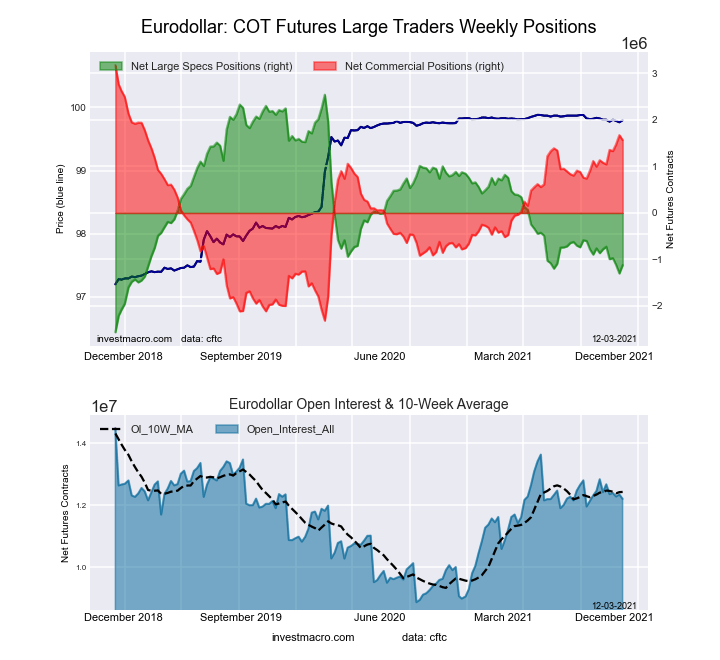
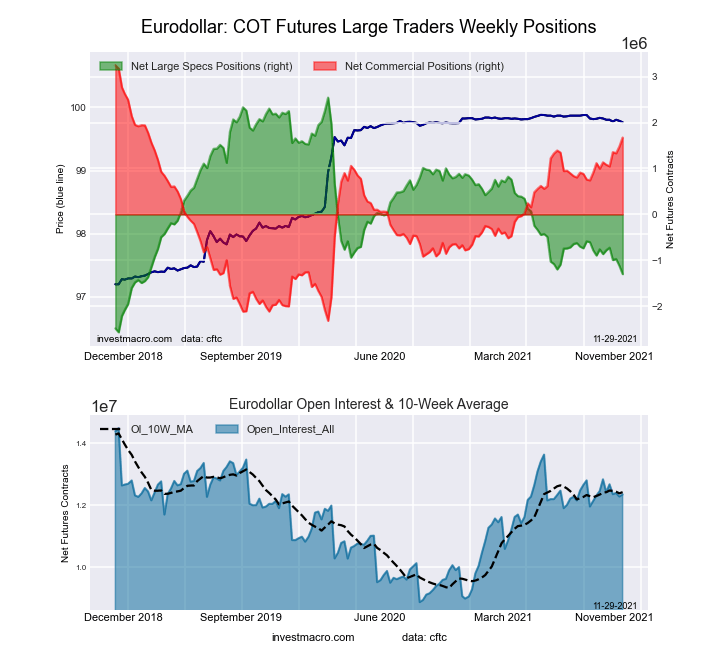
3-Month Eurodollars Futures:
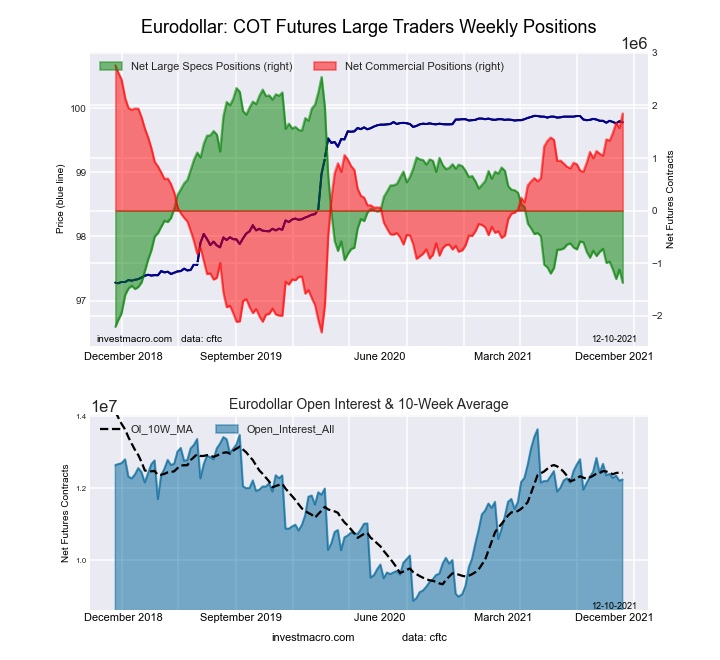
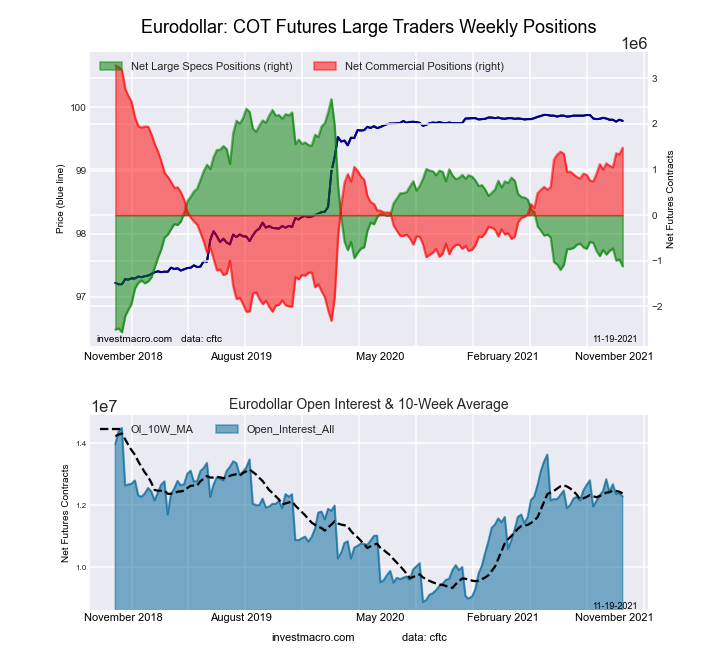
 The 3-Month Eurodollars large speculator standing this week resulted in a net position of -1,809,056 contracts in the data reported through Tuesday. This was a weekly gain of 18,792 contracts from the previous week which had a total of -1,827,848 net contracts.
This week’s current strength score (the trader positioning range over the past three years, measured from 0 to 100) shows the speculators are currently Bearish-Extreme with a score of 0.4 percent. The commercials are Bullish-Extreme with a score of 99.8 percent and the small traders (not shown in chart) are Bearish with a score of 22.5 percent.
| 3-Month Eurodollars Statistics | SPECULATORS | COMMERCIALS | SMALL TRADERS |
| – Percent of Open Interest Longs: | 6.9 | 72.1 | 4.0 |
| – Percent of Open Interest Shorts: | 23.0 | 52.6 | 7.4 |
| – Net Position: | -1,809,056 | 2,193,324 | -384,268 |
| – Gross Longs: | 778,014 | 8,113,367 | 453,162 |
| – Gross Shorts: | 2,587,070 | 5,920,043 | 837,430 |
| – Long to Short Ratio: | 0.3 to 1 | 1.4 to 1 | 0.5 to 1 |
| NET POSITION TREND: | |||
| – Strength Index Score (3 Year Range Pct): | 0.4 | 99.8 | 22.5 |
| – Strength Index Reading (3 Year Range): | Bearish-Extreme | Bullish-Extreme | Bearish |
| NET POSITION MOVEMENT INDEX: | |||
| – 6-Week Change in Strength Index: | -11.6 | 11.5 | -2.4 |
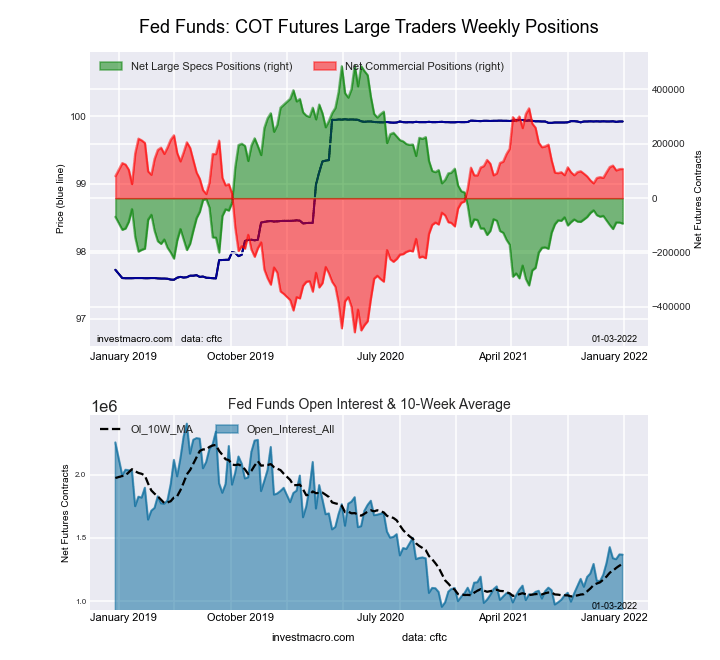
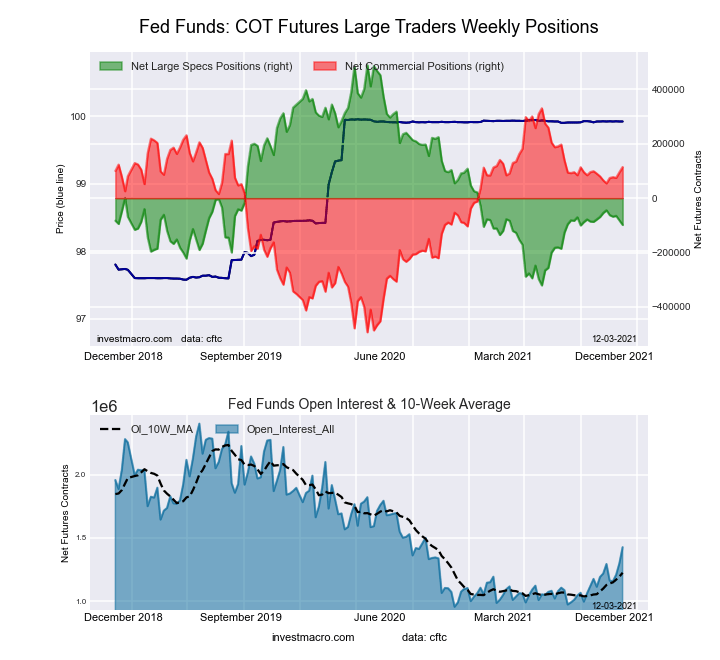
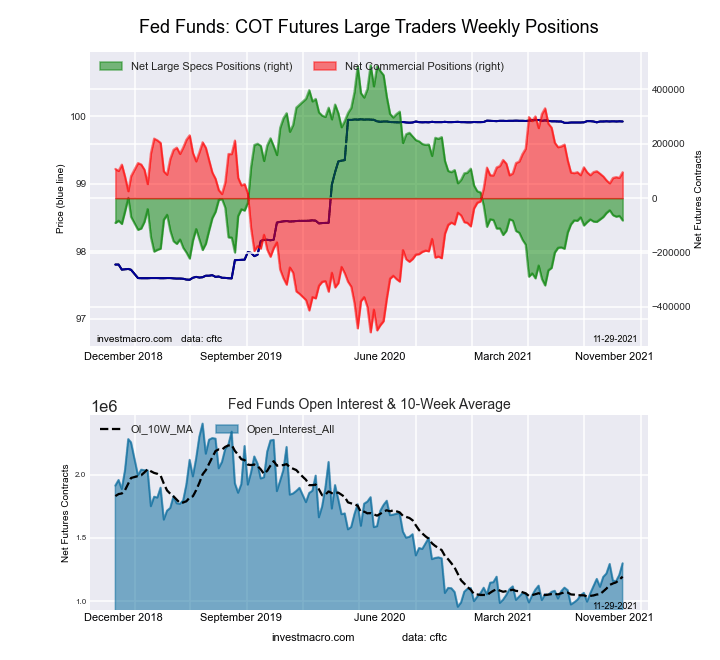
30-Day Federal Funds Futures:
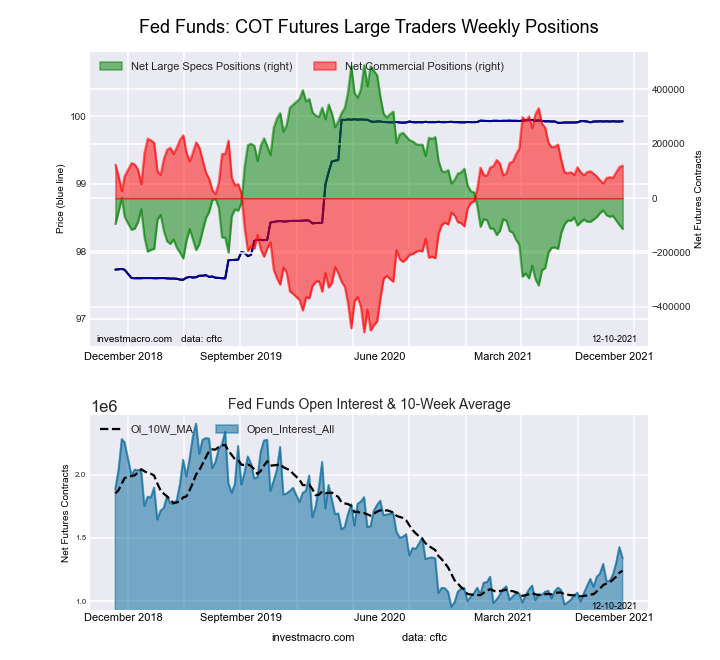
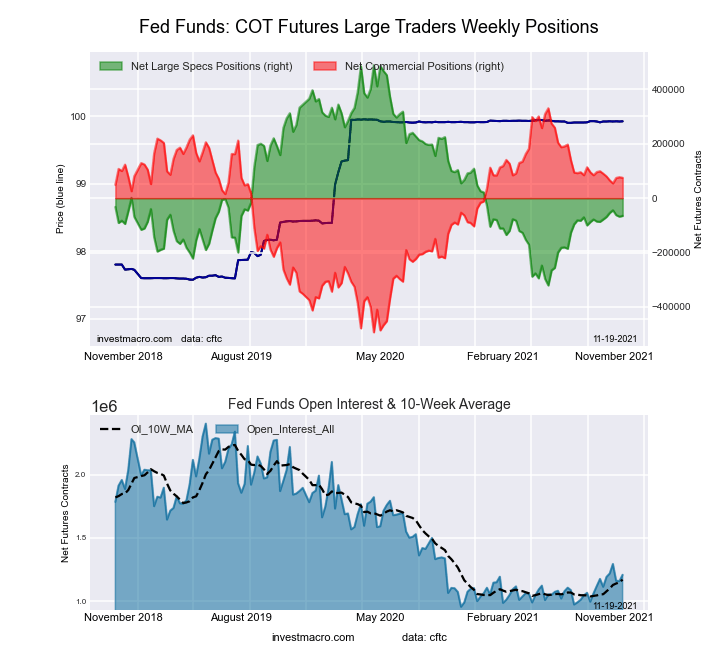
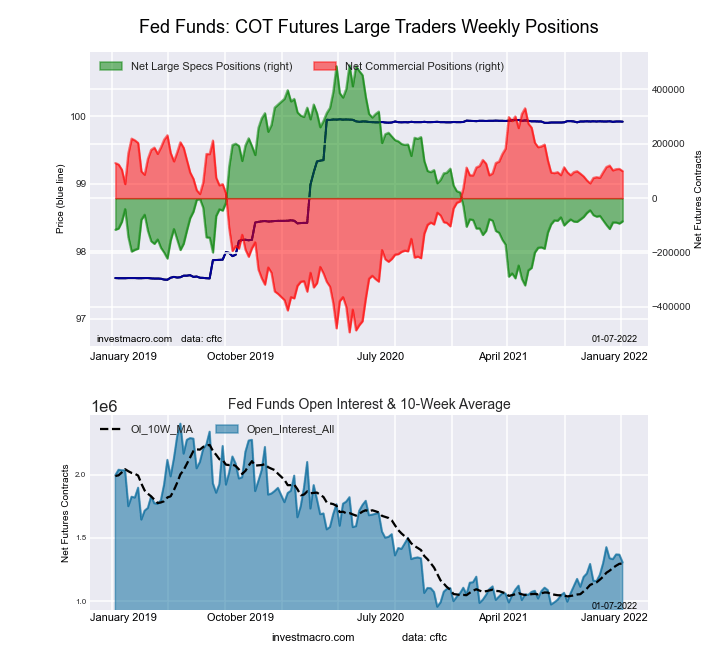 The 30-Day Federal Funds large speculator standing this week resulted in a net position of -85,291 contracts in the data reported through Tuesday. This was a weekly gain of 8,038 contracts from the previous week which had a total of -93,329 net contracts.
This week’s current strength score (the trader positioning range over the past three years, measured from 0 to 100) shows the speculators are currently Bearish with a score of 29.1 percent. The commercials are Bullish with a score of 72.0 percent and the small traders (not shown in chart) are Bearish with a score of 26.6 percent.
| 30-Day Federal Funds Statistics | SPECULATORS | COMMERCIALS | SMALL TRADERS |
| – Percent of Open Interest Longs: | 3.2 | 83.4 | 1.8 |
| – Percent of Open Interest Shorts: | 9.8 | 75.8 | 2.9 |
| – Net Position: | -85,291 | 99,441 | -14,150 |
| – Gross Longs: | 42,380 | 1,089,969 | 23,990 |
| – Gross Shorts: | 127,671 | 990,528 | 38,140 |
| – Long to Short Ratio: | 0.3 to 1 | 1.1 to 1 | 0.6 to 1 |
| NET POSITION TREND: | |||
| – Strength Index Score (3 Year Range Pct): | 29.1 | 72.0 | 26.6 |
| – Strength Index Reading (3 Year Range): | Bearish | Bullish | Bearish |
| NET POSITION MOVEMENT INDEX: | |||
| – 6-Week Change in Strength Index: | -0.4 | 0.5 | -2.1 |
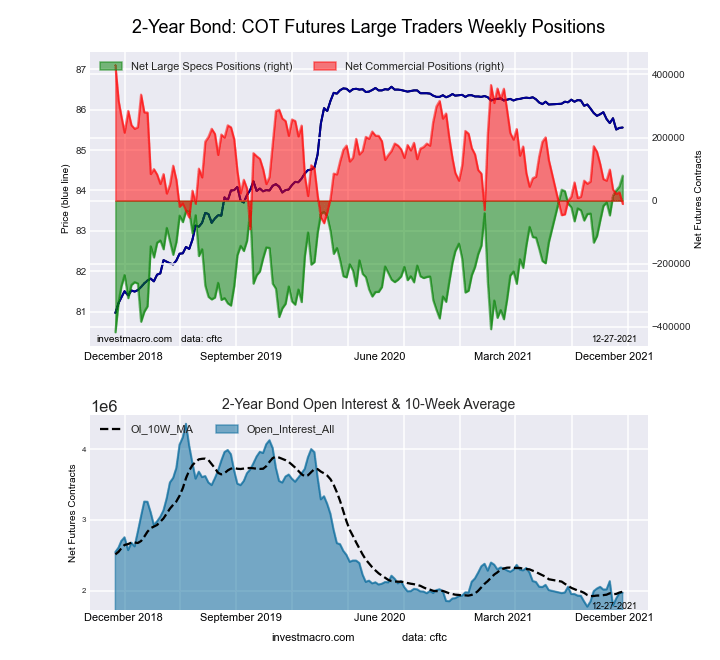
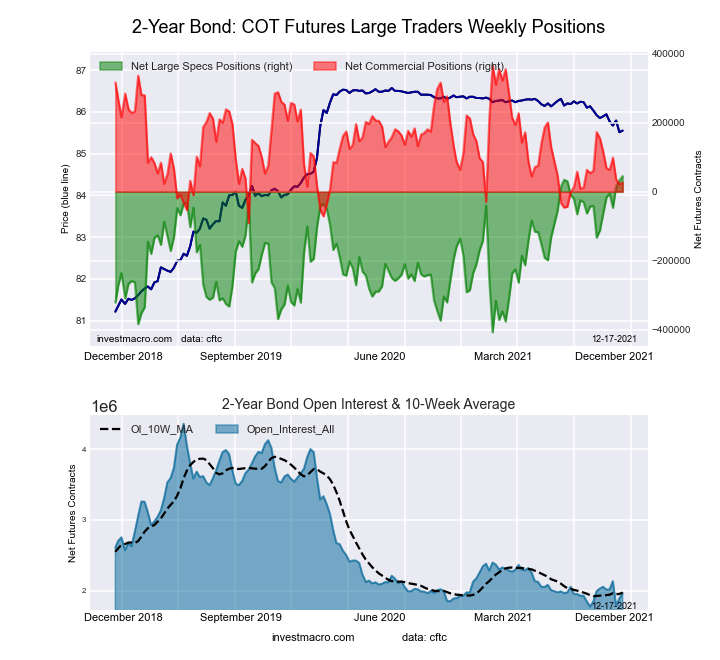
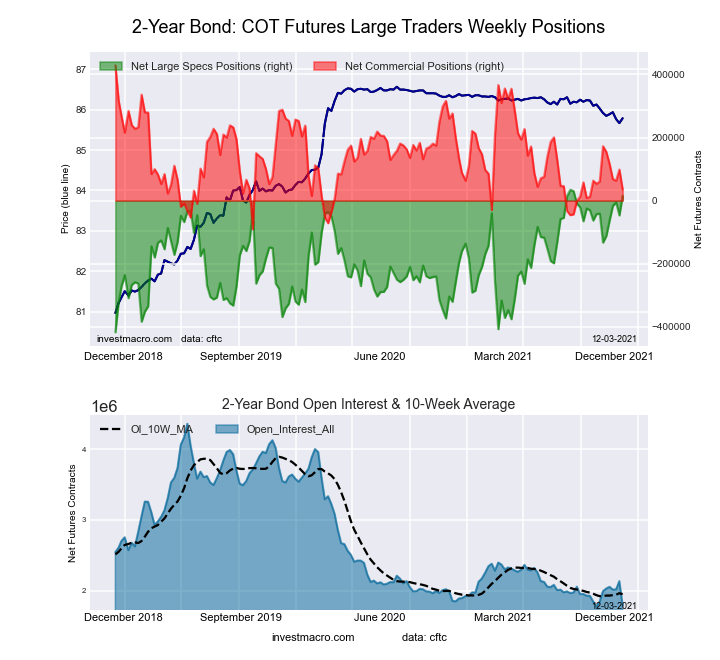
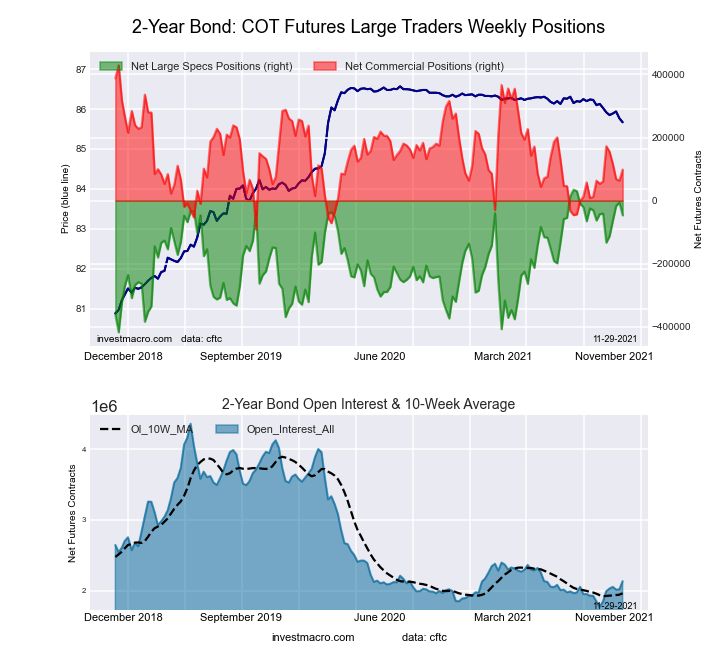
2-Year Treasury Note Futures:
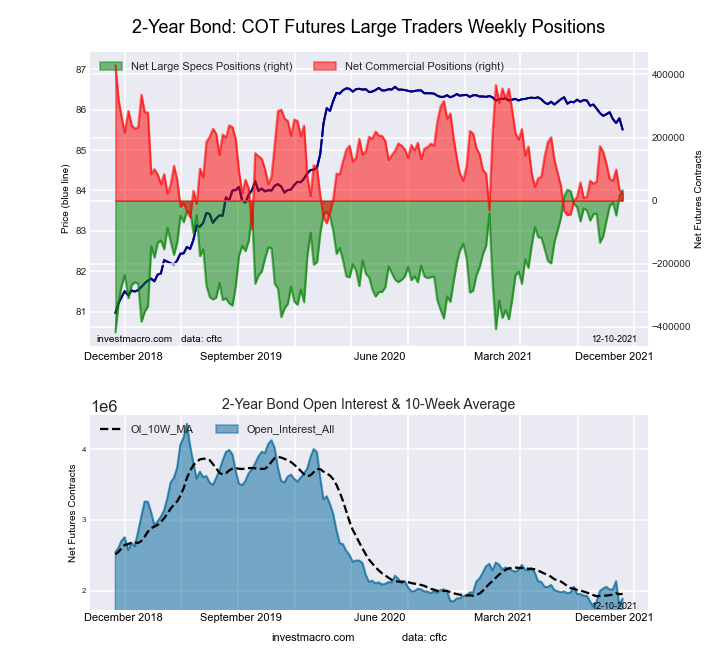
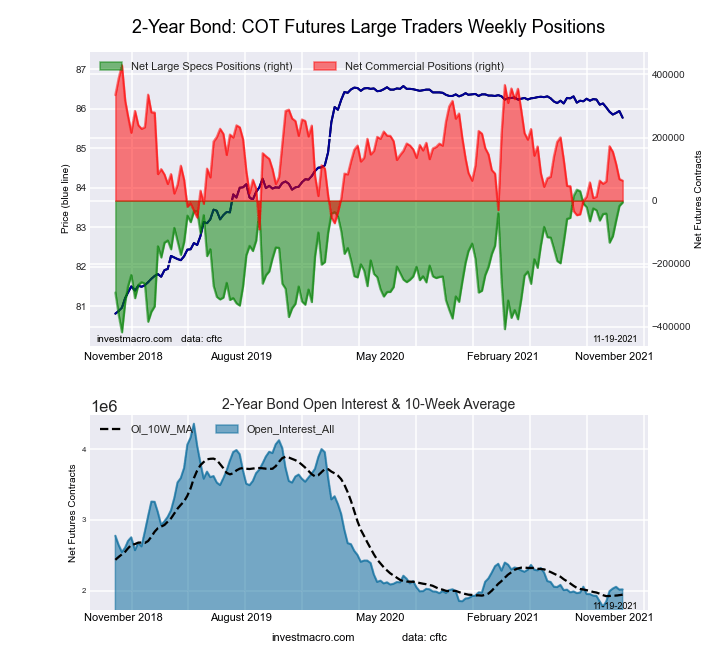
 The 2-Year Treasury Note large speculator standing this week resulted in a net position of 41,999 contracts in the data reported through Tuesday. This was a weekly decrease of -45,805 contracts from the previous week which had a total of 87,804 net contracts.
This week’s current strength score (the trader positioning range over the past three years, measured from 0 to 100) shows the speculators are currently Bullish-Extreme with a score of 90.7 percent. The commercials are Bearish with a score of 25.7 percent and the small traders (not shown in chart) are Bearish-Extreme with a score of 1.5 percent.
| 2-Year Treasury Note Statistics | SPECULATORS | COMMERCIALS | SMALL TRADERS |
| – Percent of Open Interest Longs: | 19.5 | 70.0 | 6.2 |
| – Percent of Open Interest Shorts: | 17.4 | 68.6 | 9.7 |
| – Net Position: | 41,999 | 26,847 | -68,846 |
| – Gross Longs: | 380,295 | 1,363,672 | 120,511 |
| – Gross Shorts: | 338,296 | 1,336,825 | 189,357 |
| – Long to Short Ratio: | 1.1 to 1 | 1.0 to 1 | 0.6 to 1 |
| NET POSITION TREND: | |||
| – Strength Index Score (3 Year Range Pct): | 90.7 | 25.7 | 1.5 |
| – Strength Index Reading (3 Year Range): | Bullish-Extreme | Bearish | Bearish-Extreme |
| NET POSITION MOVEMENT INDEX: | |||
| – 6-Week Change in Strength Index: | 17.9 | -15.7 | -8.7 |
5-Year Treasury Note Futures:
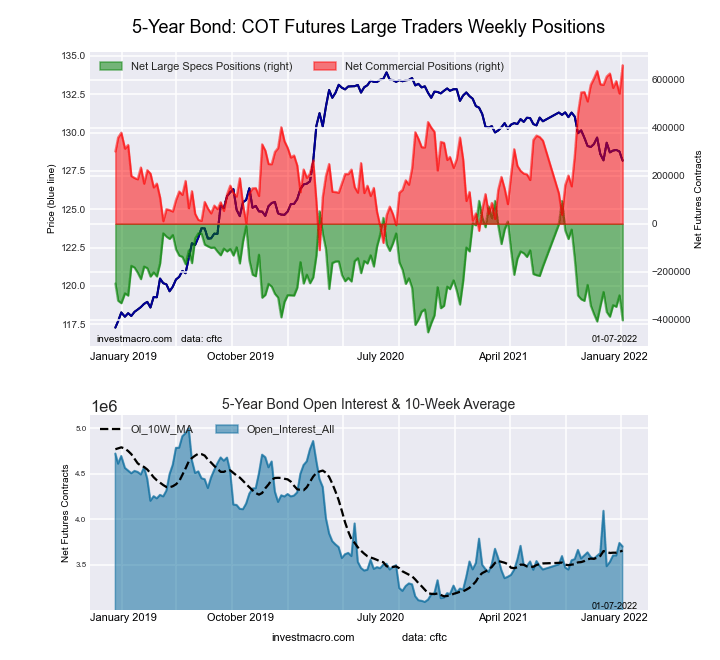 The 5-Year Treasury Note large speculator standing this week resulted in a net position of -402,875 contracts in the data reported through Tuesday. This was a weekly decline of -104,188 contracts from the previous week which had a total of -298,687 net contracts.
This week’s current strength score (the trader positioning range over the past three years, measured from 0 to 100) shows the speculators are currently Bearish-Extreme with a score of 9.1 percent. The commercials are Bullish-Extreme with a score of 100.0 percent and the small traders (not shown in chart) are Bearish-Extreme with a score of 10.0 percent.
| 5-Year Treasury Note Statistics | SPECULATORS | COMMERCIALS | SMALL TRADERS |
| – Percent of Open Interest Longs: | 6.9 | 83.3 | 6.6 |
| – Percent of Open Interest Shorts: | 17.8 | 65.4 | 13.6 |
| – Net Position: | -402,875 | 661,633 | -258,758 |
| – Gross Longs: | 255,298 | 3,082,881 | 243,889 |
| – Gross Shorts: | 658,173 | 2,421,248 | 502,647 |
| – Long to Short Ratio: | 0.4 to 1 | 1.3 to 1 | 0.5 to 1 |
| NET POSITION TREND: | |||
| – Strength Index Score (3 Year Range Pct): | 9.1 | 100.0 | 10.0 |
| – Strength Index Reading (3 Year Range): | Bearish-Extreme | Bullish-Extreme | Bearish-Extreme |
| NET POSITION MOVEMENT INDEX: | |||
| – 6-Week Change in Strength Index: | -21.5 | 10.6 | 10.0 |
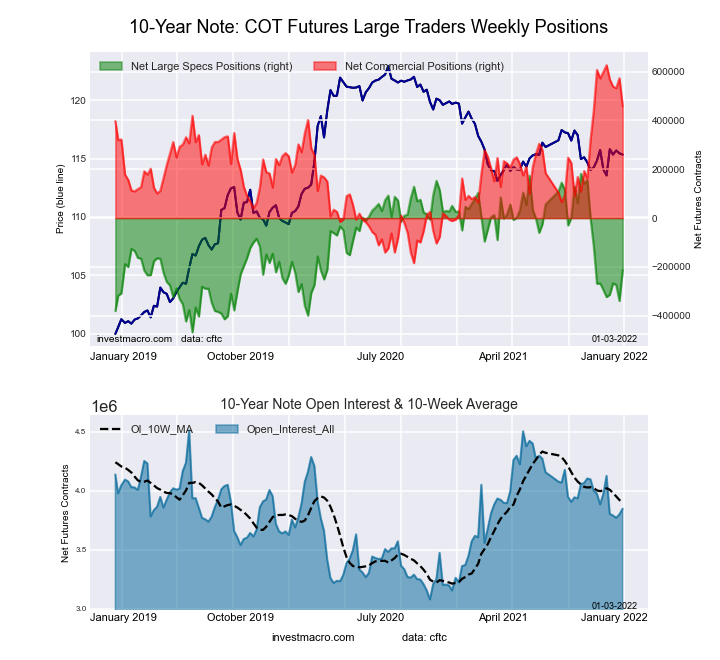
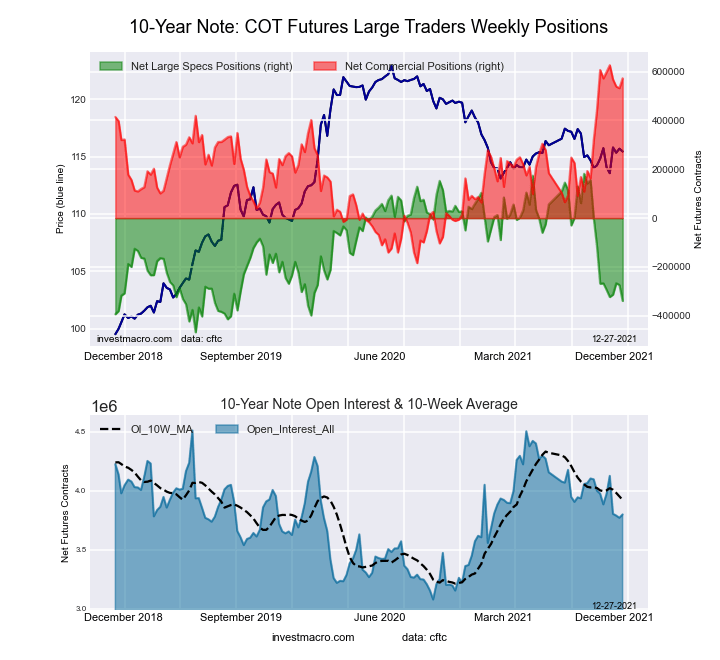
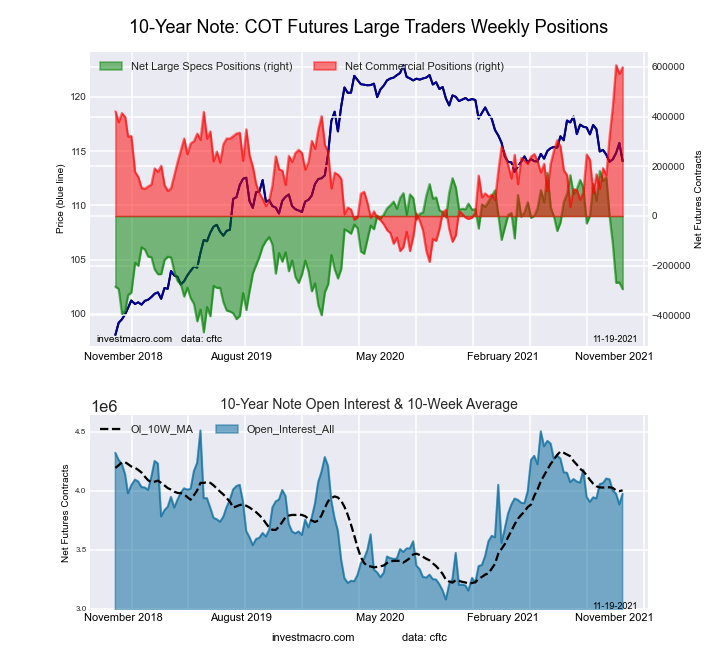
10-Year Treasury Note Futures:
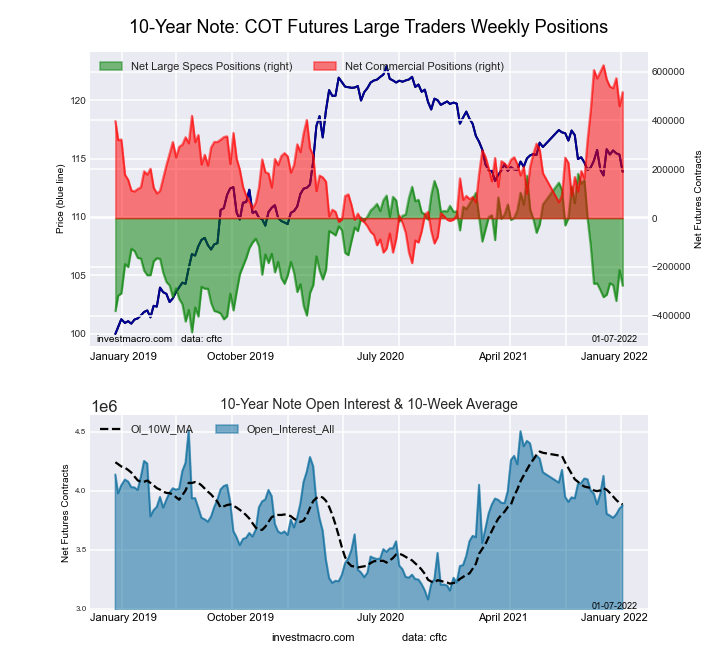 The 10-Year Treasury Note large speculator standing this week resulted in a net position of -276,923 contracts in the data reported through Tuesday. This was a weekly fall of -63,613 contracts from the previous week which had a total of -213,310 net contracts.
This week’s current strength score (the trader positioning range over the past three years, measured from 0 to 100) shows the speculators are currently Bearish with a score of 29.4 percent. The commercials are Bullish-Extreme with a score of 86.4 percent and the small traders (not shown in chart) are Bearish with a score of 23.0 percent.
| 10-Year Treasury Note Statistics | SPECULATORS | COMMERCIALS | SMALL TRADERS |
| – Percent of Open Interest Longs: | 12.7 | 76.1 | 8.0 |
| – Percent of Open Interest Shorts: | 19.8 | 62.8 | 14.2 |
| – Net Position: | -276,923 | 516,075 | -239,152 |
| – Gross Longs: | 491,806 | 2,950,609 | 309,950 |
| – Gross Shorts: | 768,729 | 2,434,534 | 549,102 |
| – Long to Short Ratio: | 0.6 to 1 | 1.2 to 1 | 0.6 to 1 |
| NET POSITION TREND: | |||
| – Strength Index Score (3 Year Range Pct): | 29.4 | 86.4 | 23.0 |
| – Strength Index Reading (3 Year Range): | Bearish | Bullish-Extreme | Bearish |
| NET POSITION MOVEMENT INDEX: | |||
| – 6-Week Change in Strength Index: | 7.2 | -13.6 | 14.8 |
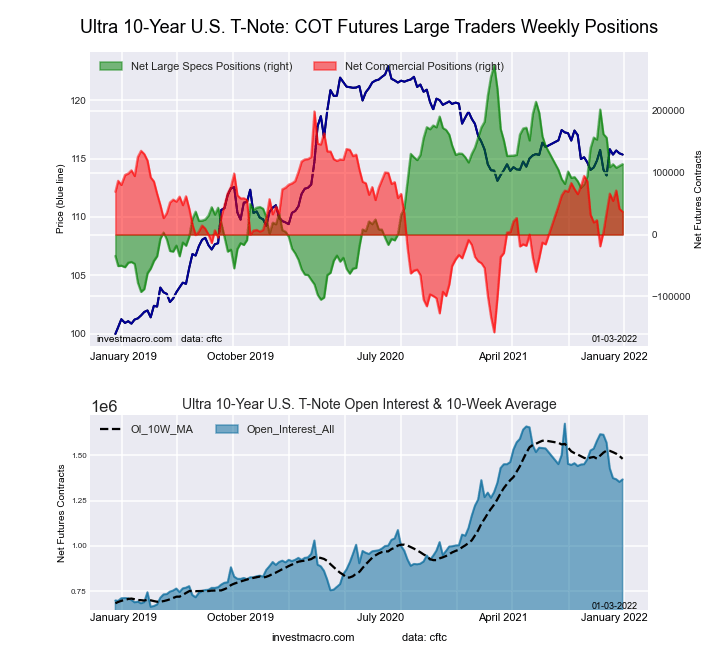
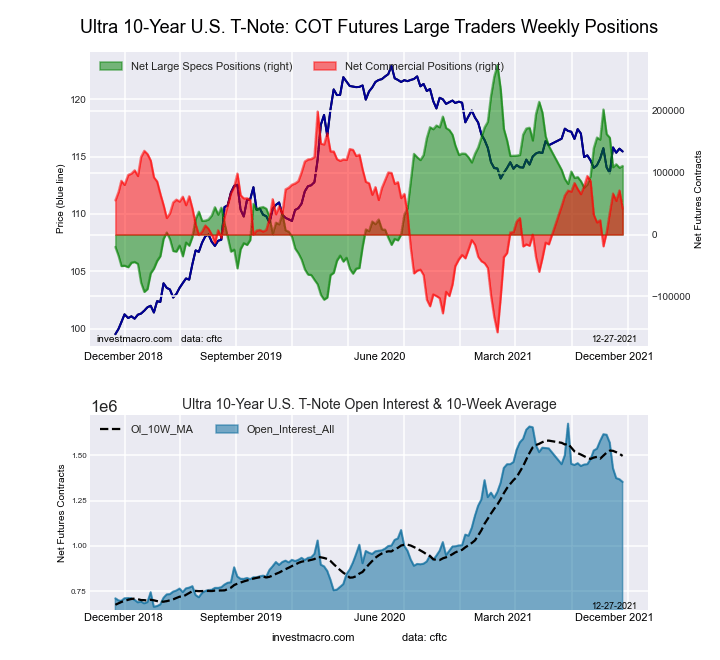
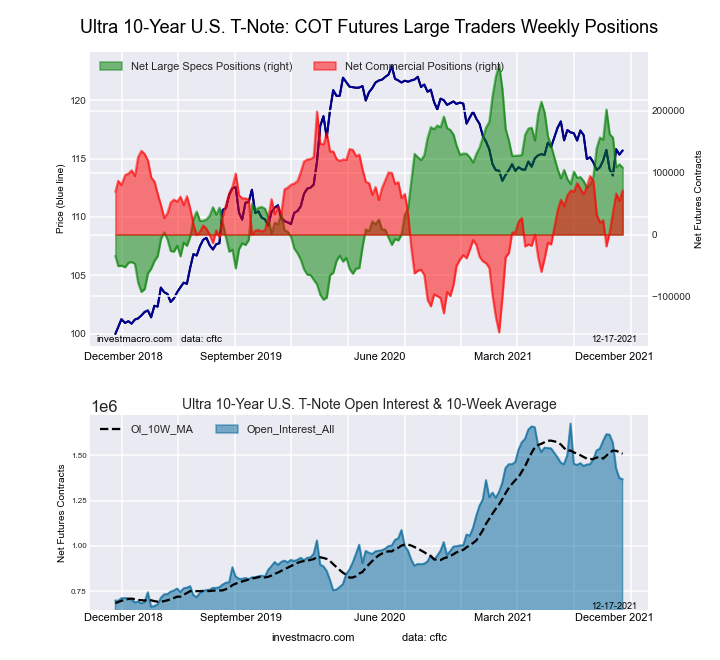
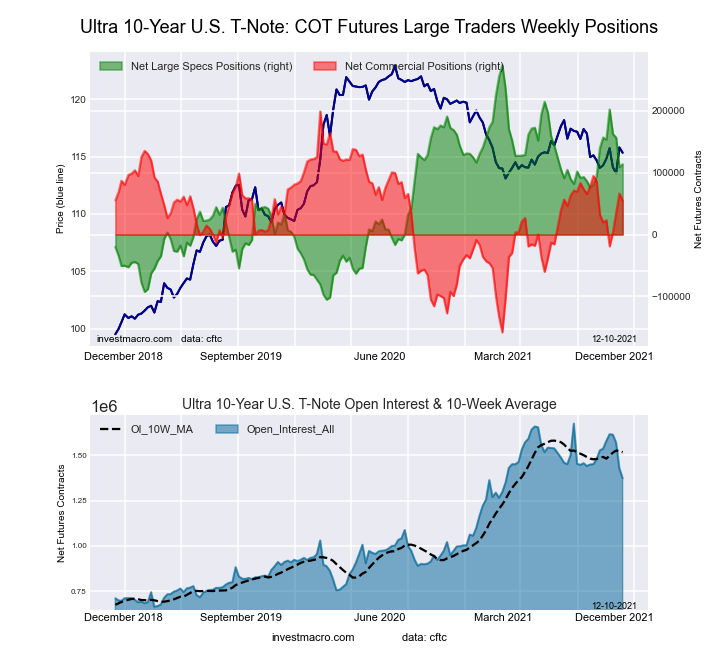
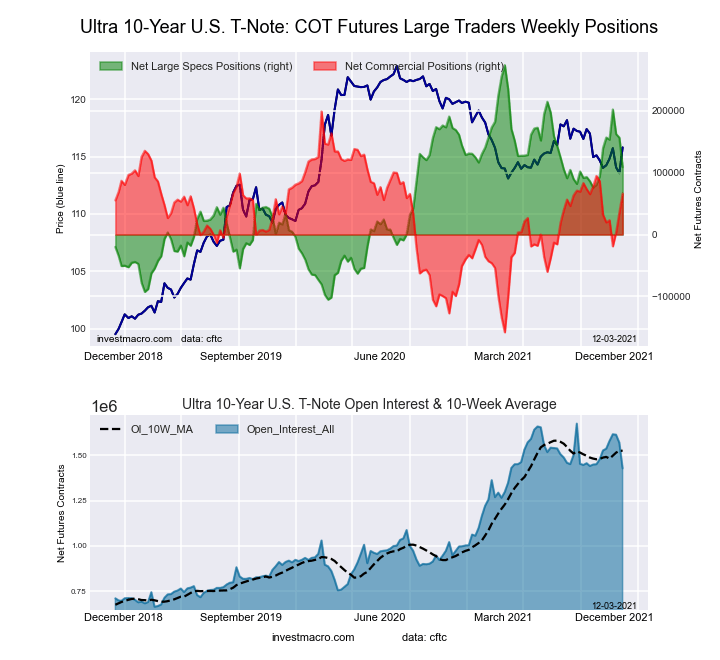
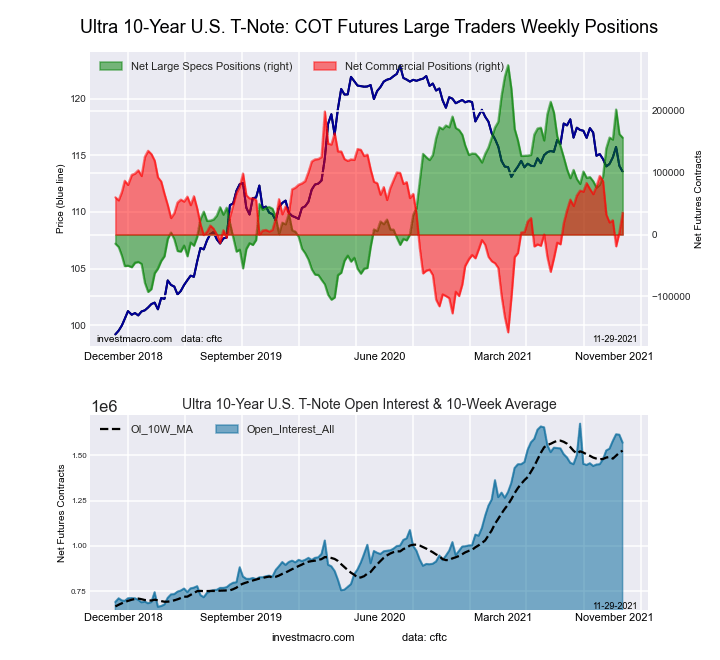
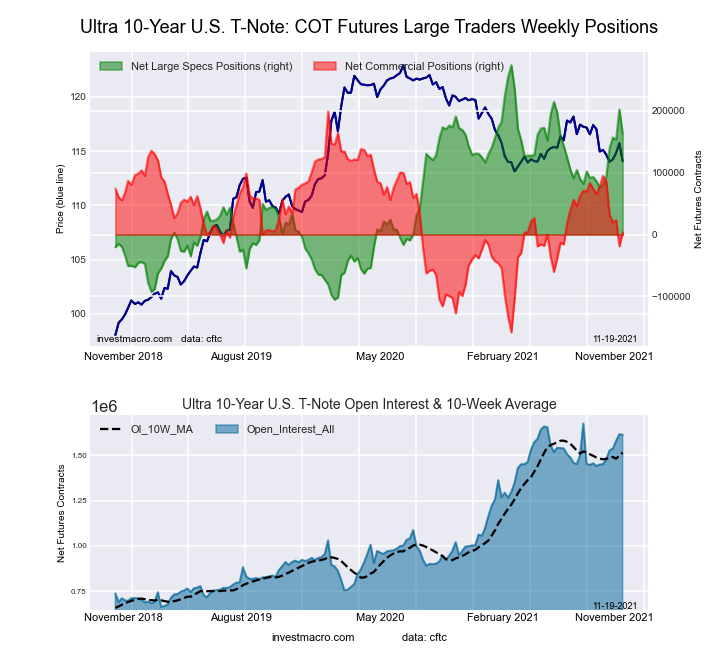
Ultra 10-Year Notes Futures:
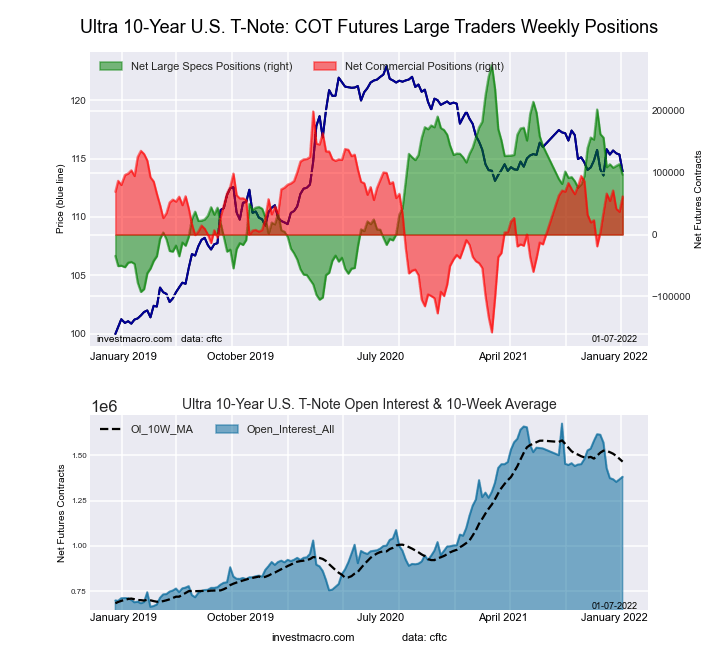 The Ultra 10-Year Notes large speculator standing this week resulted in a net position of 96,605 contracts in the data reported through Tuesday. This was a weekly fall of -17,211 contracts from the previous week which had a total of 113,816 net contracts.
This week’s current strength score (the trader positioning range over the past three years, measured from 0 to 100) shows the speculators are currently Bullish with a score of 53.3 percent. The commercials are Bullish with a score of 61.5 percent and the small traders (not shown in chart) are Bearish with a score of 20.3 percent.
| Ultra 10-Year Notes Statistics | SPECULATORS | COMMERCIALS | SMALL TRADERS |
| – Percent of Open Interest Longs: | 20.2 | 70.2 | 8.7 |
| – Percent of Open Interest Shorts: | 13.2 | 65.8 | 20.1 |
| – Net Position: | 96,605 | 61,515 | -158,120 |
| – Gross Longs: | 278,884 | 970,515 | 119,844 |
| – Gross Shorts: | 182,279 | 909,000 | 277,964 |
| – Long to Short Ratio: | 1.5 to 1 | 1.1 to 1 | 0.4 to 1 |
| NET POSITION TREND: | |||
| – Strength Index Score (3 Year Range Pct): | 53.3 | 61.5 | 20.3 |
| – Strength Index Reading (3 Year Range): | Bullish | Bullish | Bearish |
| NET POSITION MOVEMENT INDEX: | |||
| – 6-Week Change in Strength Index: | -15.8 | 7.3 | 20.3 |
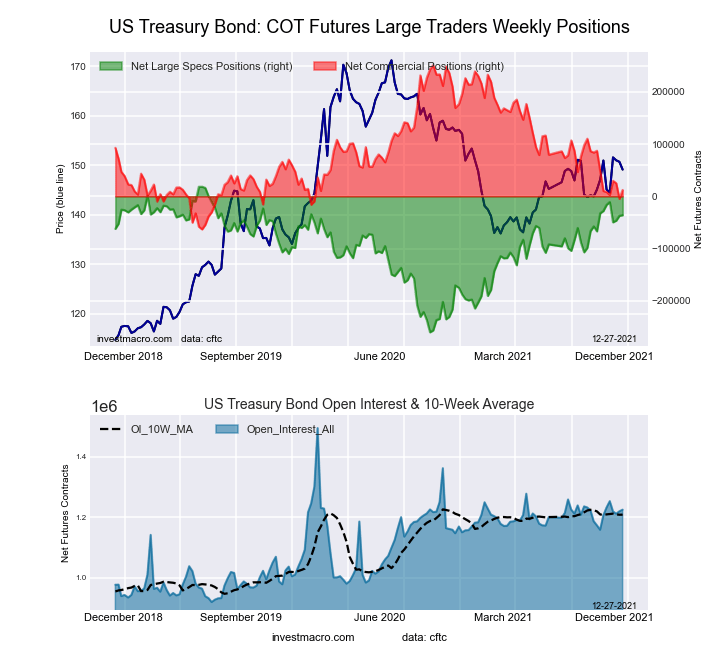
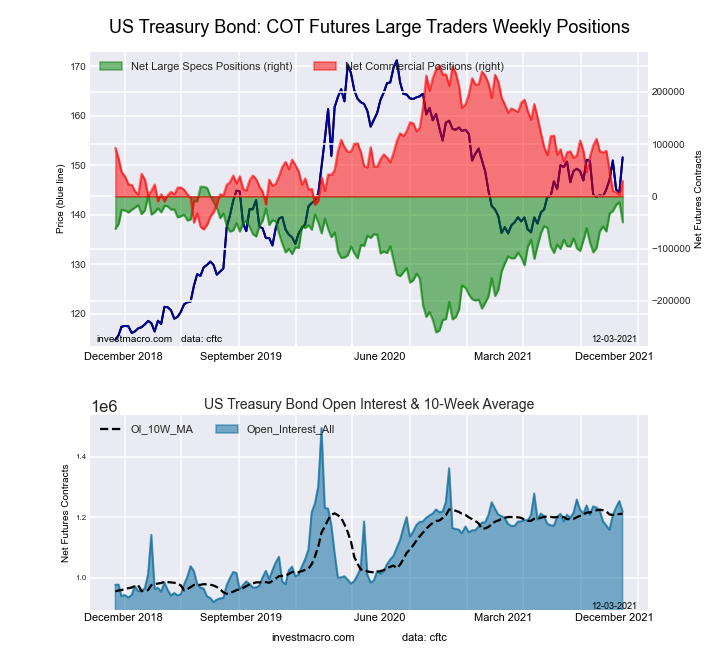
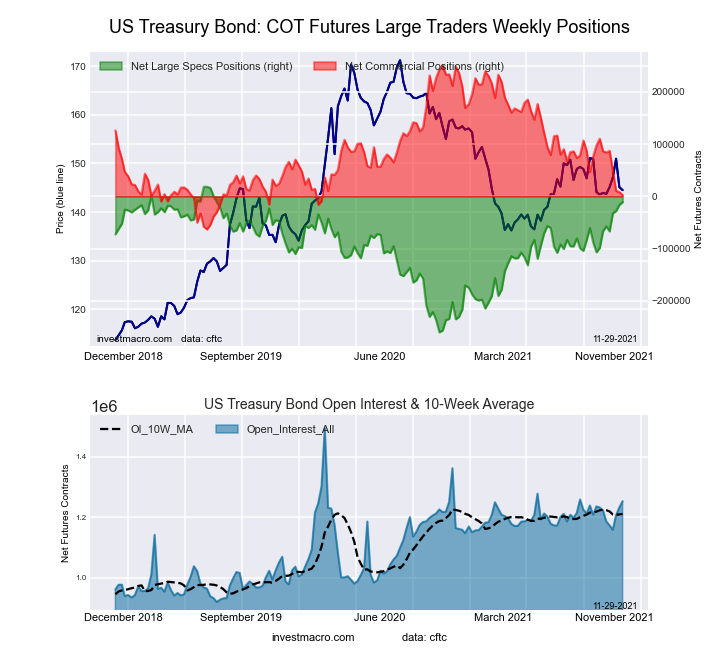
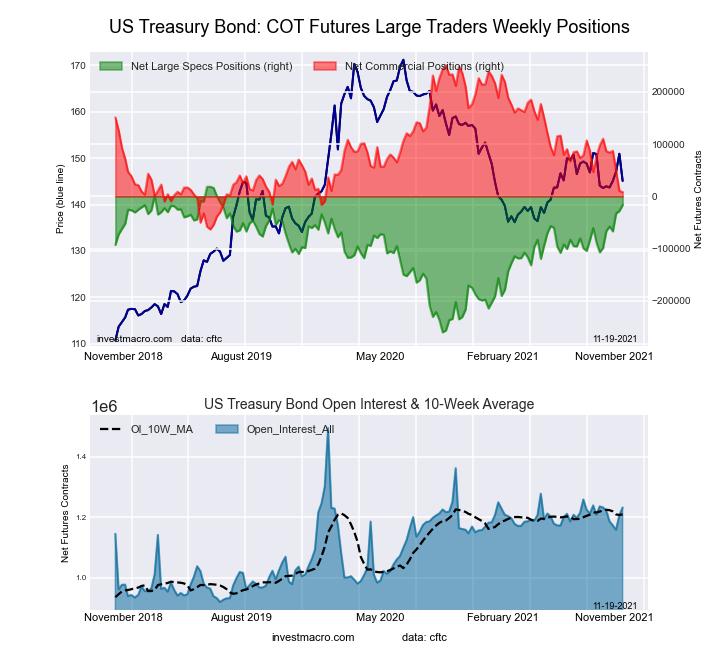
US Treasury Bonds Futures:
 The US Treasury Bonds large speculator standing this week resulted in a net position of -49,550 contracts in the data reported through Tuesday. This was a weekly decrease of -29,595 contracts from the previous week which had a total of -19,955 net contracts.
This week’s current strength score (the trader positioning range over the past three years, measured from 0 to 100) shows the speculators are currently Bullish with a score of 75.6 percent. The commercials are Bearish with a score of 28.8 percent and the small traders (not shown in chart) are Bullish with a score of 70.3 percent.
| US Treasury Bonds Statistics | SPECULATORS | COMMERCIALS | SMALL TRADERS |
| – Percent of Open Interest Longs: | 11.9 | 70.9 | 15.1 |
| – Percent of Open Interest Shorts: | 16.0 | 68.6 | 13.2 |
| – Net Position: | -49,550 | 27,261 | 22,289 |
| – Gross Longs: | 144,496 | 858,118 | 182,266 |
| – Gross Shorts: | 194,046 | 830,857 | 159,977 |
| – Long to Short Ratio: | 0.7 to 1 | 1.0 to 1 | 1.1 to 1 |
| NET POSITION TREND: | |||
| – Strength Index Score (3 Year Range Pct): | 75.6 | 28.8 | 70.3 |
| – Strength Index Reading (3 Year Range): | Bullish | Bearish | Bullish |
| NET POSITION MOVEMENT INDEX: | |||
| – 6-Week Change in Strength Index: | -13.8 | 7.9 | 11.0 |
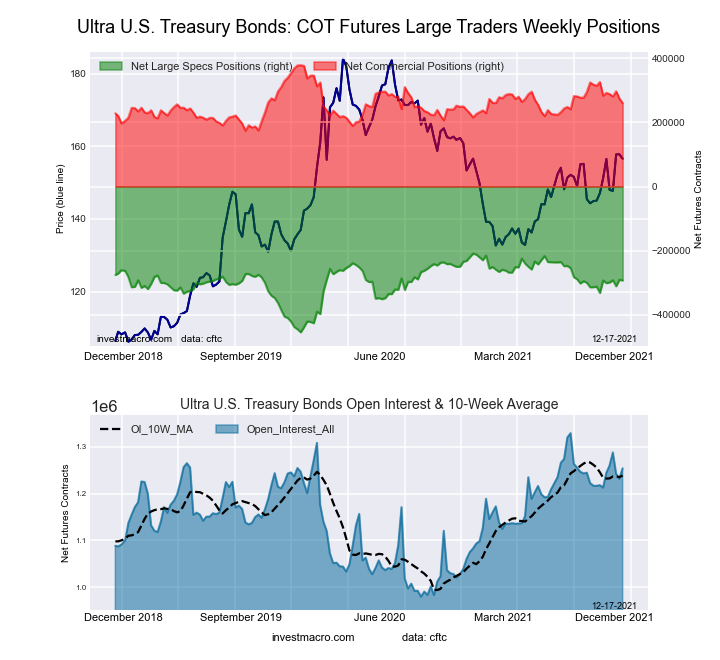
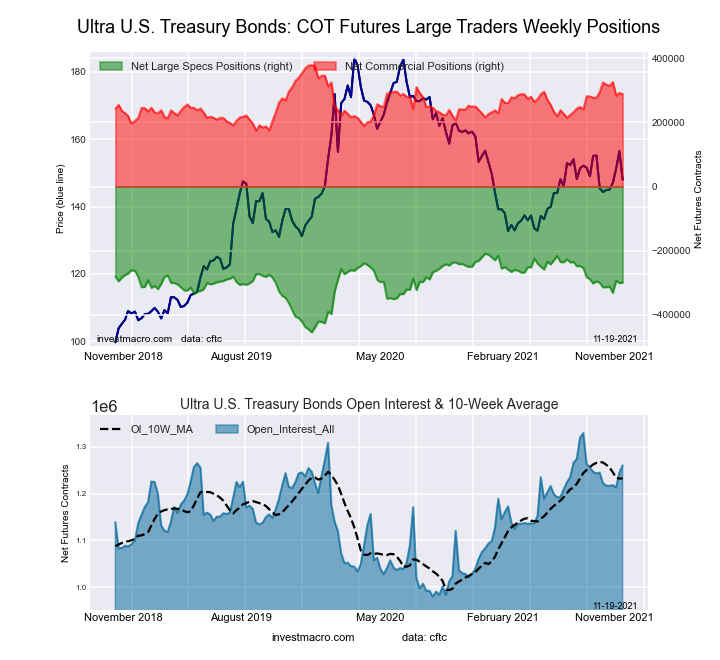
Ultra US Treasury Bonds Futures:
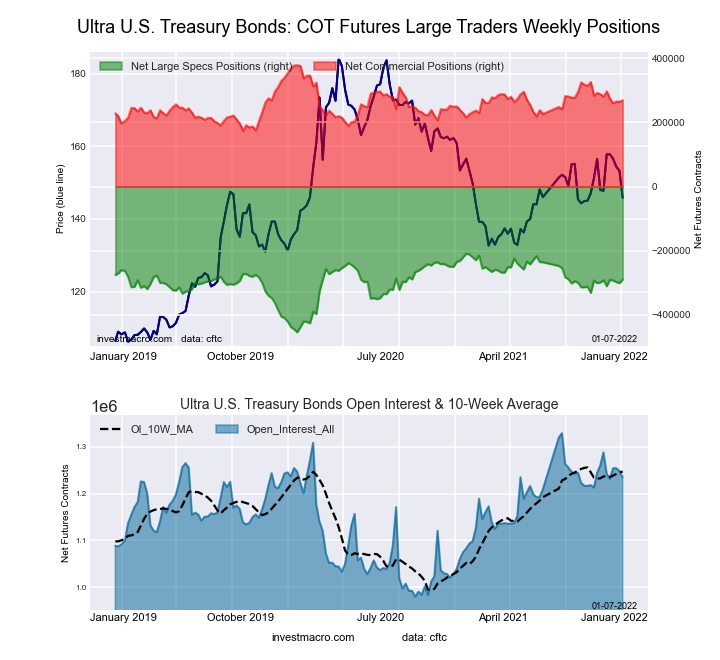 The Ultra US Treasury Bonds large speculator standing this week resulted in a net position of -289,601 contracts in the data reported through Tuesday. This was a weekly increase of 11,116 contracts from the previous week which had a total of -300,717 net contracts.
This week’s current strength score (the trader positioning range over the past three years, measured from 0 to 100) shows the speculators are currently Bullish with a score of 67.1 percent. The commercials are Bearish with a score of 46.5 percent and the small traders (not shown in chart) are Bearish with a score of 43.1 percent.
| Ultra US Treasury Bonds Statistics | SPECULATORS | COMMERCIALS | SMALL TRADERS |
| – Percent of Open Interest Longs: | 6.4 | 80.7 | 12.4 |
| – Percent of Open Interest Shorts: | 29.8 | 58.9 | 10.7 |
| – Net Position: | -289,601 | 268,878 | 20,723 |
| – Gross Longs: | 78,495 | 996,061 | 153,251 |
| – Gross Shorts: | 368,096 | 727,183 | 132,528 |
| – Long to Short Ratio: | 0.2 to 1 | 1.4 to 1 | 1.2 to 1 |
| NET POSITION TREND: | |||
| – Strength Index Score (3 Year Range Pct): | 67.1 | 46.5 | 43.1 |
| – Strength Index Reading (3 Year Range): | Bullish | Bearish | Bearish |
| NET POSITION MOVEMENT INDEX: | |||
| – 6-Week Change in Strength Index: | 0.9 | -5.7 | 6.8 |
Article By InvestMacro – Receive our weekly COT Reports by Email
*COT Report: The COT data, released weekly to the public each Friday, is updated through the most recent Tuesday (data is 3 days old) and shows a quick view of how large speculators or non-commercials (for-profit traders) were positioned in the futures markets.
The CFTC categorizes trader positions according to commercial hedgers (traders who use futures contracts for hedging as part of the business), non-commercials (large traders who speculate to realize trading profits) and nonreportable traders (usually small traders/speculators) as well as their open interest (contracts open in the market at time of reporting).See CFTC criteria here.


