
By InvestMacro | COT | Data Tables | COT Leaders | Downloads | COT Newsletter
Here are the latest charts and statistics for the Commitment of Traders (COT) data published by the Commodities Futures Trading Commission (CFTC) on Monday due to the Thanksgiving holiday last week.
The latest COT data is updated through Tuesday November 23 2021 and shows a quick view of how large traders (for-profit speculators and commercial entities) were positioned in the futures markets.
| Nov-23-2021 | OI | OI-Index | Spec-Net | Spec-Index | Com-Net | COM-Index | Smalls-Net | Smalls-Index |
|---|---|---|---|---|---|---|---|---|
| Eurodollar | 12,349,444 | 62 | -1,300,481 | 25 | 1,673,242 | 72 | -372,761 | 53 |
| FedFunds | 1,298,421 | 24 | -82,005 | 29 | 95,280 | 71 | -13,275 | 37 |
| 2-Year | 2,132,720 | 14 | -46,620 | 82 | 98,539 | 36 | -51,919 | 3 |
| Long T-Bond | 1,252,959 | 58 | -11,025 | 89 | 2,535 | 21 | 8,490 | 59 |
| 10-Year | 4,124,886 | 73 | -323,415 | 22 | 626,237 | 100 | -302,822 | 8 |
| 5-Year | 4,093,700 | 52 | -284,883 | 31 | 580,200 | 92 | -295,317 | 0 |
3-Month Eurodollars Futures:
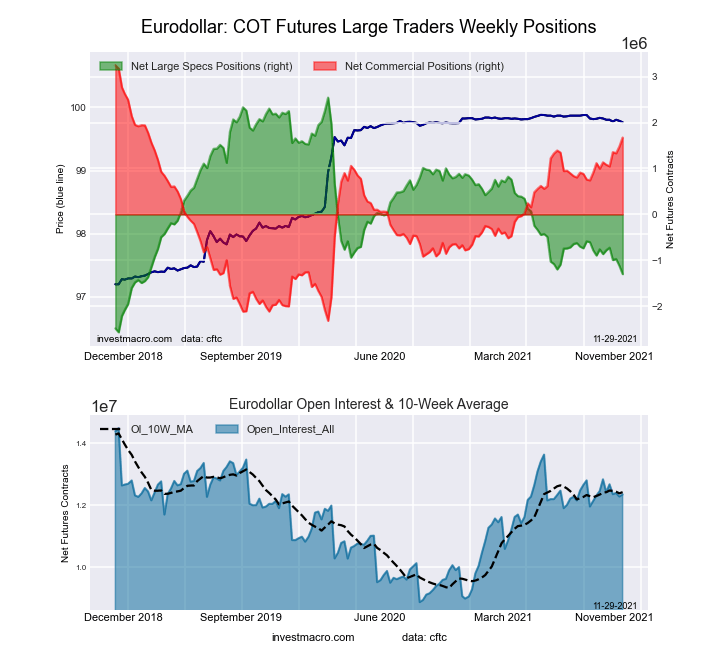 The 3-Month Eurodollars large speculator standing this week equaled a net position of -1,300,481 contracts in the data reported through Tuesday. This was a weekly fall of -181,198 contracts from the previous week which had a total of -1,119,283 net contracts.
This week’s current strength score (the trader positioning range over the past three years, measured from 0 to 100) shows the speculators are currently Bearish with a score of 24.8 percent. The commercials are Bullish with a score of 71.7 percent and the small traders (not shown in chart) are Bullish with a score of 52.7 percent.
Free Reports:
 Get our Weekly Commitment of Traders Reports - See where the biggest traders (Hedge Funds and Commercial Hedgers) are positioned in the futures markets on a weekly basis.
 Sign Up for Our Stock Market Newsletter – Get updated on News, Charts & Rankings of Public Companies when you join our Stocks Newsletter
| 3-Month Eurodollars Statistics | SPECULATORS | COMMERCIALS | SMALL TRADERS |
| – Percent of Open Interest Longs: | 11.4 | 66.5 | 4.2 |
| – Percent of Open Interest Shorts: | 21.9 | 53.0 | 7.2 |
| – Net Position: | -1,300,481 | 1,673,242 | -372,761 |
| – Gross Longs: | 1,402,059 | 8,214,489 | 521,653 |
| – Gross Shorts: | 2,702,540 | 6,541,247 | 894,414 |
| – Long to Short Ratio: | 0.5 to 1 | 1.3 to 1 | 0.6 to 1 |
| NET POSITION TREND: | |||
| – COT Index Score (3 Year Range Pct): | 24.8 | 71.7 | 52.7 |
| – COT Index Reading (3 Year Range): | Bearish | Bullish | Bullish |
| NET POSITION MOVEMENT INDEX: | |||
| – 6-Week Change in Strength Index: | -8.6 | 9.7 | -13.8 |
30-Day Federal Funds Futures:
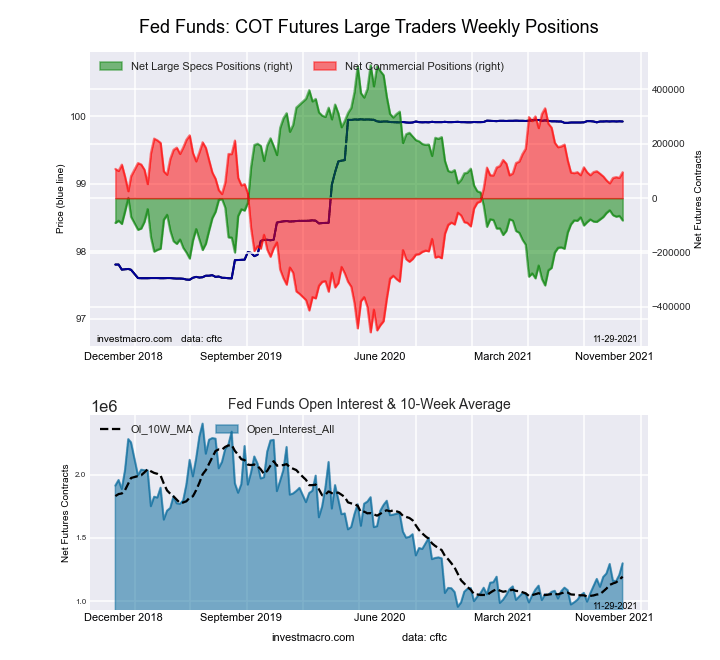 The 30-Day Federal Funds large speculator standing this week equaled a net position of -82,005 contracts in the data reported through Tuesday. This was a weekly reduction of -16,799 contracts from the previous week which had a total of -65,206 net contracts.
This week’s current strength score (the trader positioning range over the past three years, measured from 0 to 100) shows the speculators are currently Bearish with a score of 29.5 percent. The commercials are Bullish with a score of 71.4 percent and the small traders (not shown in chart) are Bearish with a score of 36.6 percent.
| 30-Day Federal Funds Statistics | SPECULATORS | COMMERCIALS | SMALL TRADERS |
| – Percent of Open Interest Longs: | 4.8 | 81.2 | 1.4 |
| – Percent of Open Interest Shorts: | 11.1 | 73.9 | 2.5 |
| – Net Position: | -82,005 | 95,280 | -13,275 |
| – Gross Longs: | 62,546 | 1,054,351 | 18,787 |
| – Gross Shorts: | 144,551 | 959,071 | 32,062 |
| – Long to Short Ratio: | 0.4 to 1 | 1.1 to 1 | 0.6 to 1 |
| NET POSITION TREND: | |||
| – COT Index Score (3 Year Range Pct): | 29.5 | 71.4 | 36.6 |
| – COT Index Reading (3 Year Range): | Bearish | Bullish | Bearish |
| NET POSITION MOVEMENT INDEX: | |||
| – 6-Week Change in Strength Index: | -1.6 | 1.9 | -5.1 |
2-Year Treasury Note Futures:
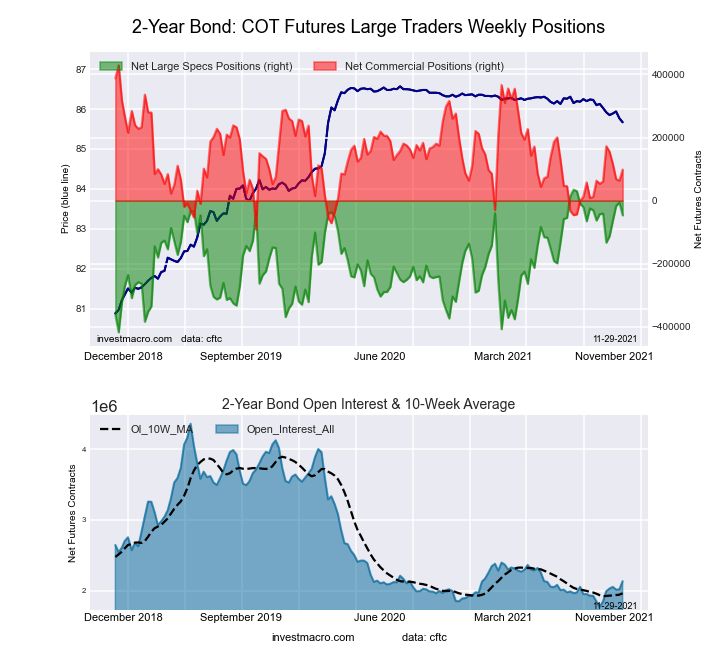 The 2-Year Treasury Note large speculator standing this week equaled a net position of -46,620 contracts in the data reported through Tuesday. This was a weekly decrease of -41,175 contracts from the previous week which had a total of -5,445 net contracts.
This week’s current strength score (the trader positioning range over the past three years, measured from 0 to 100) shows the speculators are currently Bullish-Extreme with a score of 82.0 percent. The commercials are Bearish with a score of 36.4 percent and the small traders (not shown in chart) are Bearish-Extreme with a score of 3.4 percent.
| 2-Year Treasury Note Statistics | SPECULATORS | COMMERCIALS | SMALL TRADERS |
| – Percent of Open Interest Longs: | 14.2 | 73.1 | 6.5 |
| – Percent of Open Interest Shorts: | 16.4 | 68.5 | 8.9 |
| – Net Position: | -46,620 | 98,539 | -51,919 |
| – Gross Longs: | 302,567 | 1,558,485 | 138,934 |
| – Gross Shorts: | 349,187 | 1,459,946 | 190,853 |
| – Long to Short Ratio: | 0.9 to 1 | 1.1 to 1 | 0.7 to 1 |
| NET POSITION TREND: | |||
| – COT Index Score (3 Year Range Pct): | 82.0 | 36.4 | 3.4 |
| – COT Index Reading (3 Year Range): | Bullish-Extreme | Bearish | Bearish-Extreme |
| NET POSITION MOVEMENT INDEX: | |||
| – 6-Week Change in Strength Index: | -1.3 | 7.2 | -17.6 |
5-Year Treasury Note Futures:
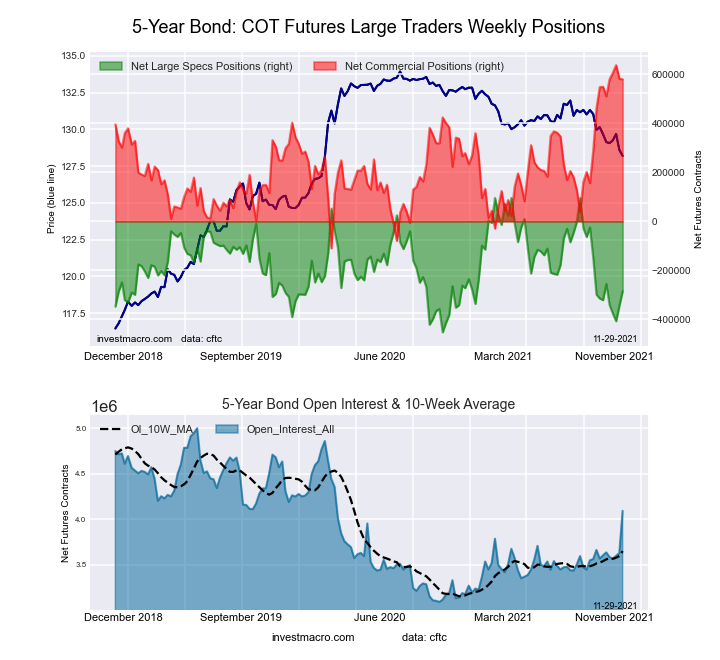 The 5-Year Treasury Note large speculator standing this week equaled a net position of -284,883 contracts in the data reported through Tuesday. This was a weekly rise of 59,712 contracts from the previous week which had a total of -344,595 net contracts.
This week’s current strength score (the trader positioning range over the past three years, measured from 0 to 100) shows the speculators are currently Bearish with a score of 30.6 percent. The commercials are Bullish-Extreme with a score of 92.3 percent and the small traders (not shown in chart) are Bearish-Extreme with a score of 0.0 percent.
| 5-Year Treasury Note Statistics | SPECULATORS | COMMERCIALS | SMALL TRADERS |
| – Percent of Open Interest Longs: | 8.2 | 77.3 | 7.6 |
| – Percent of Open Interest Shorts: | 15.1 | 63.1 | 14.8 |
| – Net Position: | -284,883 | 580,200 | -295,317 |
| – Gross Longs: | 335,148 | 3,165,060 | 310,719 |
| – Gross Shorts: | 620,031 | 2,584,860 | 606,036 |
| – Long to Short Ratio: | 0.5 to 1 | 1.2 to 1 | 0.5 to 1 |
| NET POSITION TREND: | |||
| – COT Index Score (3 Year Range Pct): | 30.6 | 92.3 | 0.0 |
| – COT Index Reading (3 Year Range): | Bearish | Bullish-Extreme | Bearish-Extreme |
| NET POSITION MOVEMENT INDEX: | |||
| – 6-Week Change in Strength Index: | 6.7 | 4.1 | -18.4 |
10-Year Treasury Note Futures:
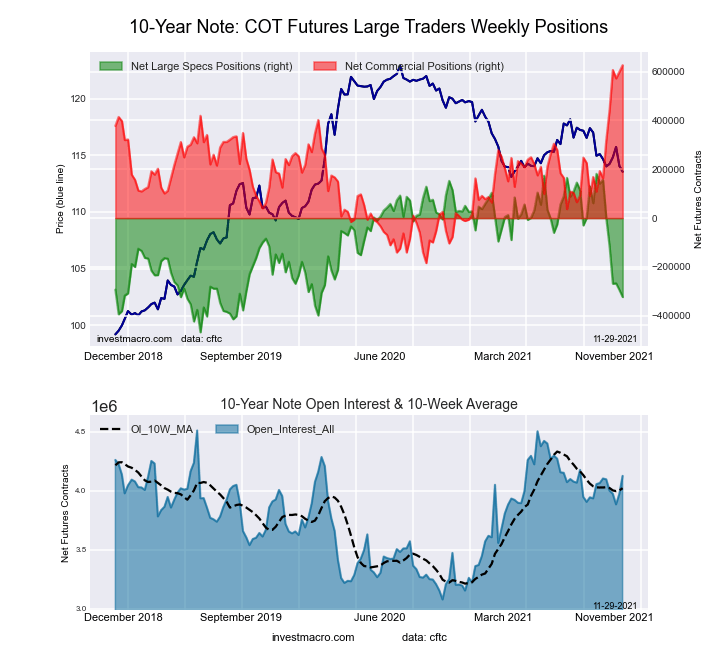 The 10-Year Treasury Note large speculator standing this week equaled a net position of -323,415 contracts in the data reported through Tuesday. This was a weekly decrease of -29,274 contracts from the previous week which had a total of -294,141 net contracts.
This week’s current strength score (the trader positioning range over the past three years, measured from 0 to 100) shows the speculators are currently Bearish with a score of 22.2 percent. The commercials are Bullish-Extreme with a score of 100.0 percent and the small traders (not shown in chart) are Bearish-Extreme with a score of 8.2 percent.
| 10-Year Treasury Note Statistics | SPECULATORS | COMMERCIALS | SMALL TRADERS |
| – Percent of Open Interest Longs: | 10.6 | 77.0 | 8.5 |
| – Percent of Open Interest Shorts: | 18.5 | 61.8 | 15.8 |
| – Net Position: | -323,415 | 626,237 | -302,822 |
| – Gross Longs: | 437,867 | 3,176,597 | 350,623 |
| – Gross Shorts: | 761,282 | 2,550,360 | 653,445 |
| – Long to Short Ratio: | 0.6 to 1 | 1.2 to 1 | 0.5 to 1 |
| NET POSITION TREND: | |||
| – COT Index Score (3 Year Range Pct): | 22.2 | 100.0 | 8.2 |
| – COT Index Reading (3 Year Range): | Bearish | Bullish-Extreme | Bearish-Extreme |
| NET POSITION MOVEMENT INDEX: | |||
| – 6-Week Change in Strength Index: | -73.9 | 57.1 | 3.8 |
Ultra 10-Year Notes Futures:
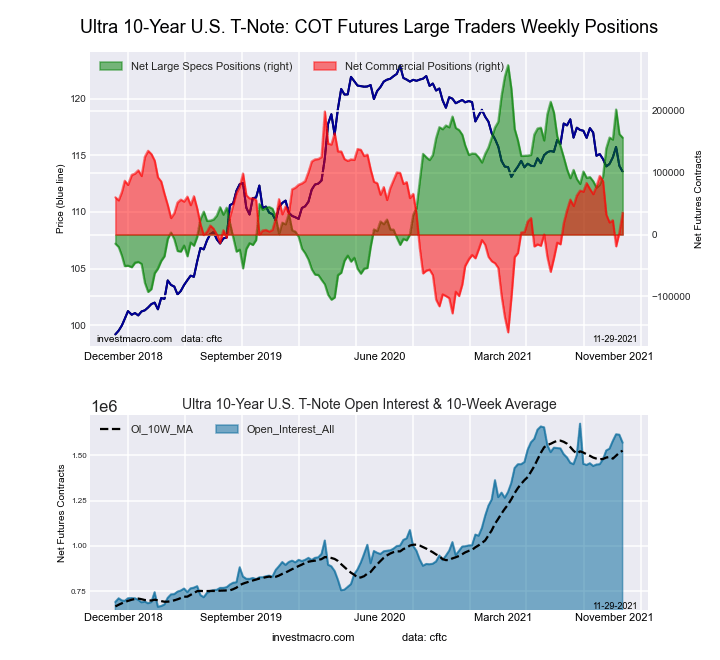 The Ultra 10-Year Notes large speculator standing this week equaled a net position of 156,586 contracts in the data reported through Tuesday. This was a weekly reduction of -5,824 contracts from the previous week which had a total of 162,410 net contracts.
This week’s current strength score (the trader positioning range over the past three years, measured from 0 to 100) shows the speculators are currently Bullish with a score of 69.1 percent. The commercials are Bullish with a score of 54.2 percent and the small traders (not shown in chart) are Bearish-Extreme with a score of 0.0 percent.
| Ultra 10-Year Notes Statistics | SPECULATORS | COMMERCIALS | SMALL TRADERS |
| – Percent of Open Interest Longs: | 18.9 | 71.7 | 7.4 |
| – Percent of Open Interest Shorts: | 9.0 | 69.4 | 19.6 |
| – Net Position: | 156,586 | 35,408 | -191,994 |
| – Gross Longs: | 297,229 | 1,125,042 | 115,416 |
| – Gross Shorts: | 140,643 | 1,089,634 | 307,410 |
| – Long to Short Ratio: | 2.1 to 1 | 1.0 to 1 | 0.4 to 1 |
| NET POSITION TREND: | |||
| – COT Index Score (3 Year Range Pct): | 69.1 | 54.2 | 0.0 |
| – COT Index Reading (3 Year Range): | Bullish | Bullish | Bearish-Extreme |
| NET POSITION MOVEMENT INDEX: | |||
| – 6-Week Change in Strength Index: | 16.5 | -14.3 | -6.9 |
US Treasury Bonds Futures:
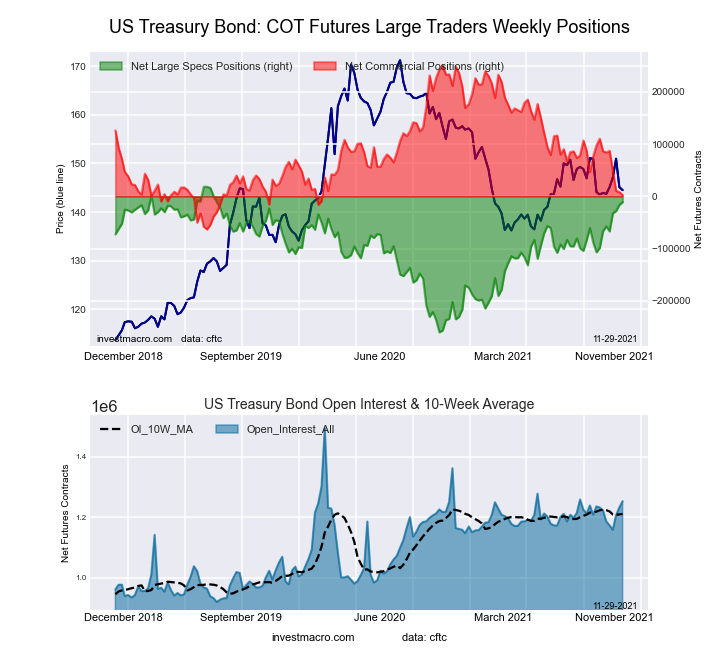 The US Treasury Bonds large speculator standing this week equaled a net position of -11,025 contracts in the data reported through Tuesday. This was a weekly advance of 5,343 contracts from the previous week which had a total of -16,368 net contracts.
This week’s current strength score (the trader positioning range over the past three years, measured from 0 to 100) shows the speculators are currently Bullish-Extreme with a score of 89.5 percent. The commercials are Bearish with a score of 20.9 percent and the small traders (not shown in chart) are Bullish with a score of 59.3 percent.
| US Treasury Bonds Statistics | SPECULATORS | COMMERCIALS | SMALL TRADERS |
| – Percent of Open Interest Longs: | 12.3 | 69.9 | 14.8 |
| – Percent of Open Interest Shorts: | 13.1 | 69.7 | 14.1 |
| – Net Position: | -11,025 | 2,535 | 8,490 |
| – Gross Longs: | 153,738 | 876,170 | 185,217 |
| – Gross Shorts: | 164,763 | 873,635 | 176,727 |
| – Long to Short Ratio: | 0.9 to 1 | 1.0 to 1 | 1.0 to 1 |
| NET POSITION TREND: | |||
| – COT Index Score (3 Year Range Pct): | 89.5 | 20.9 | 59.3 |
| – COT Index Reading (3 Year Range): | Bullish-Extreme | Bearish | Bullish |
| NET POSITION MOVEMENT INDEX: | |||
| – 6-Week Change in Strength Index: | 20.0 | -26.7 | 22.4 |
Ultra US Treasury Bonds Futures:
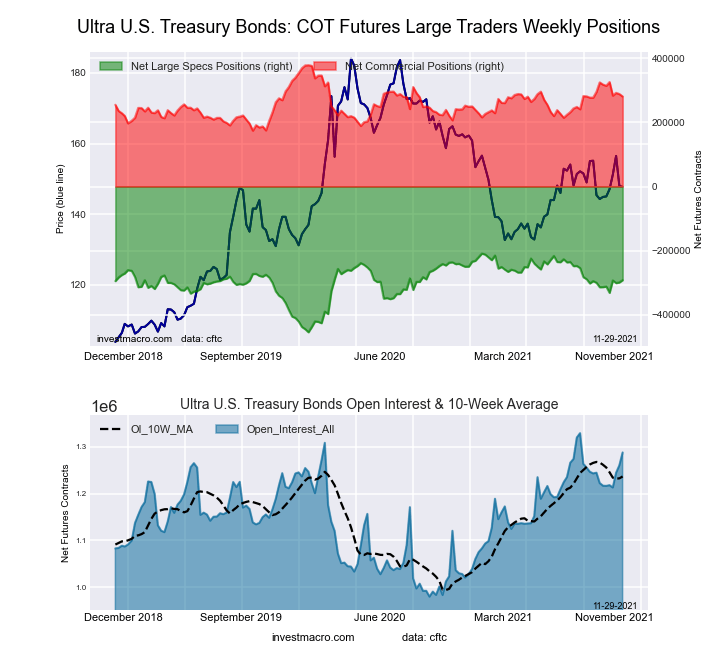 The Ultra US Treasury Bonds large speculator standing this week equaled a net position of -291,720 contracts in the data reported through Tuesday. This was a weekly boost of 7,159 contracts from the previous week which had a total of -298,879 net contracts.
This week’s current strength score (the trader positioning range over the past three years, measured from 0 to 100) shows the speculators are currently Bullish with a score of 66.2 percent. The commercials are Bullish with a score of 52.2 percent and the small traders (not shown in chart) are Bearish with a score of 36.3 percent.
| Ultra US Treasury Bonds Statistics | SPECULATORS | COMMERCIALS | SMALL TRADERS |
| – Percent of Open Interest Longs: | 5.8 | 80.0 | 13.0 |
| – Percent of Open Interest Shorts: | 28.5 | 58.2 | 12.1 |
| – Net Position: | -291,720 | 280,496 | 11,224 |
| – Gross Longs: | 75,005 | 1,029,708 | 167,388 |
| – Gross Shorts: | 366,725 | 749,212 | 156,164 |
| – Long to Short Ratio: | 0.2 to 1 | 1.4 to 1 | 1.1 to 1 |
| NET POSITION TREND: | |||
| – COT Index Score (3 Year Range Pct): | 66.2 | 52.2 | 36.3 |
| – COT Index Reading (3 Year Range): | Bullish | Bullish | Bearish |
| NET POSITION MOVEMENT INDEX: | |||
| – 6-Week Change in Strength Index: | 8.9 | -18.1 | 10.9 |
Article By InvestMacro – Receive our weekly COT Reports by Email
*COT Report: The COT data, released weekly to the public each Friday, is updated through the most recent Tuesday (data is 3 days old) and shows a quick view of how large speculators or non-commercials (for-profit traders) were positioned in the futures markets.
The CFTC categorizes trader positions according to commercial hedgers (traders who use futures contracts for hedging as part of the business), non-commercials (large traders who speculate to realize trading profits) and nonreportable traders (usually small traders/speculators) as well as their open interest (contracts open in the market at time of reporting).See CFTC criteria here.

- COT Metals Charts: Weekly Speculator Bets see small gains for Silver & Gold Jul 12, 2026
- COT Bonds Charts: Speculator Bets led by SOFR 3-Months & 2-Year Bonds Jul 12, 2026
- COT Energy Charts: Weekly Speculator Changes led by Brent Oil Jul 12, 2026
- COT Soft Commodities Charts: Weekly Speculator Changes led by Sugar, Corn & Soybeans Jul 12, 2026
- The US and European stock indices are rising again amid renewed investor interest in the AI industry. Jul 10, 2026
- USD/JPY Falls as Yen Recovers Weekly Losses Jul 10, 2026
- Crude oil prices surged sharply by 7% in reaction to the rapid escalation of the conflict in the Middle East Jul 9, 2026
- Middle East Tensions Weigh on Gold Jul 9, 2026
- Pound Awaits Tighter Policy from Bank of England Jul 8, 2026
- The United States carried out airstrikes on Iran after Iran’s attacked tankers in the Strait of Hormuz. The RBNZ raised the interest rate to 2.5% Jul 8, 2026