By InvestMacro
Here are the latest charts and statistics for the Commitment of Traders (COT) data published by the Commodities Futures Trading Commission (CFTC).
The latest COT data is updated through Tuesday May 5th and shows a quick view of how large traders (for-profit speculators and commercial entities) were positioned in the futures markets.
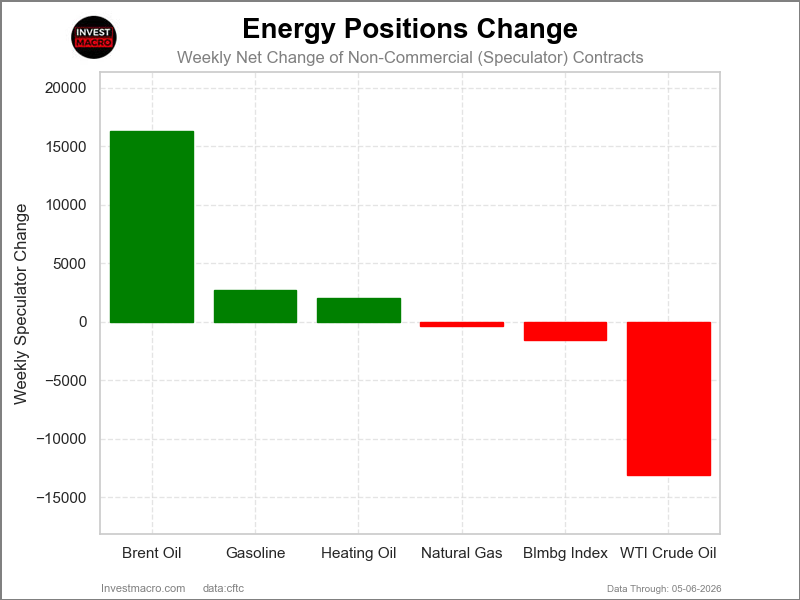
The COT energy market speculator bets were mixed this week as three out of the six energy markets we cover had higher positioning while the other three markets had lower speculator contracts.
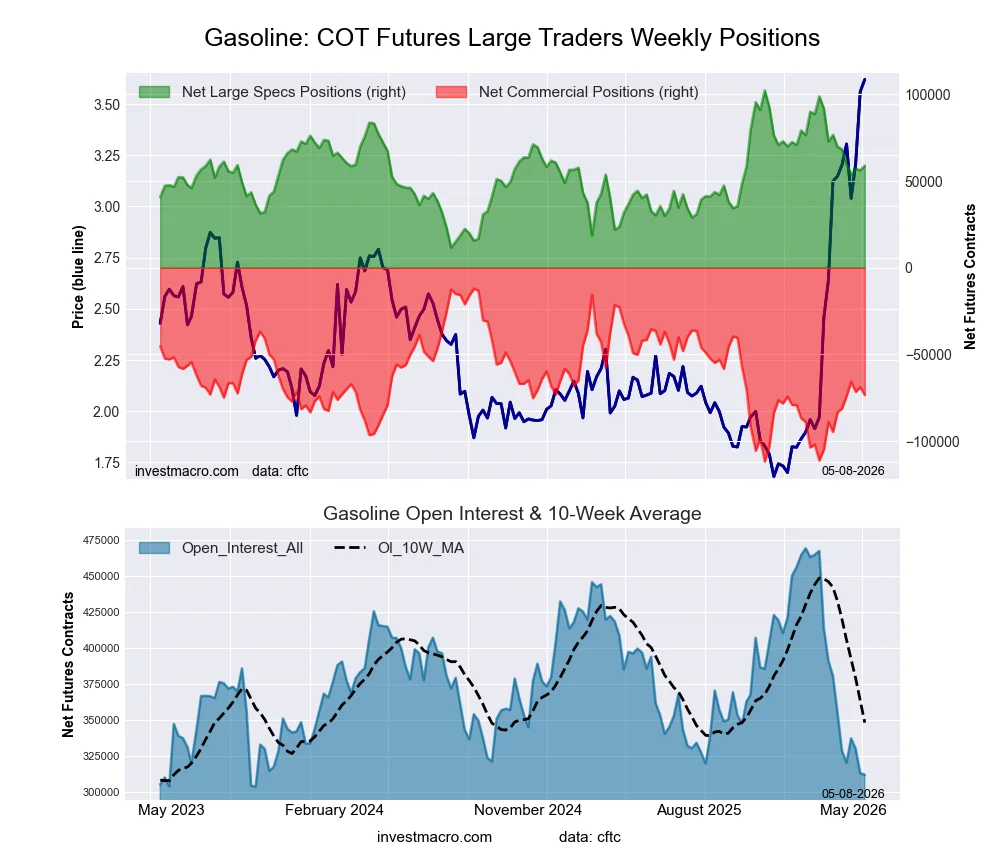
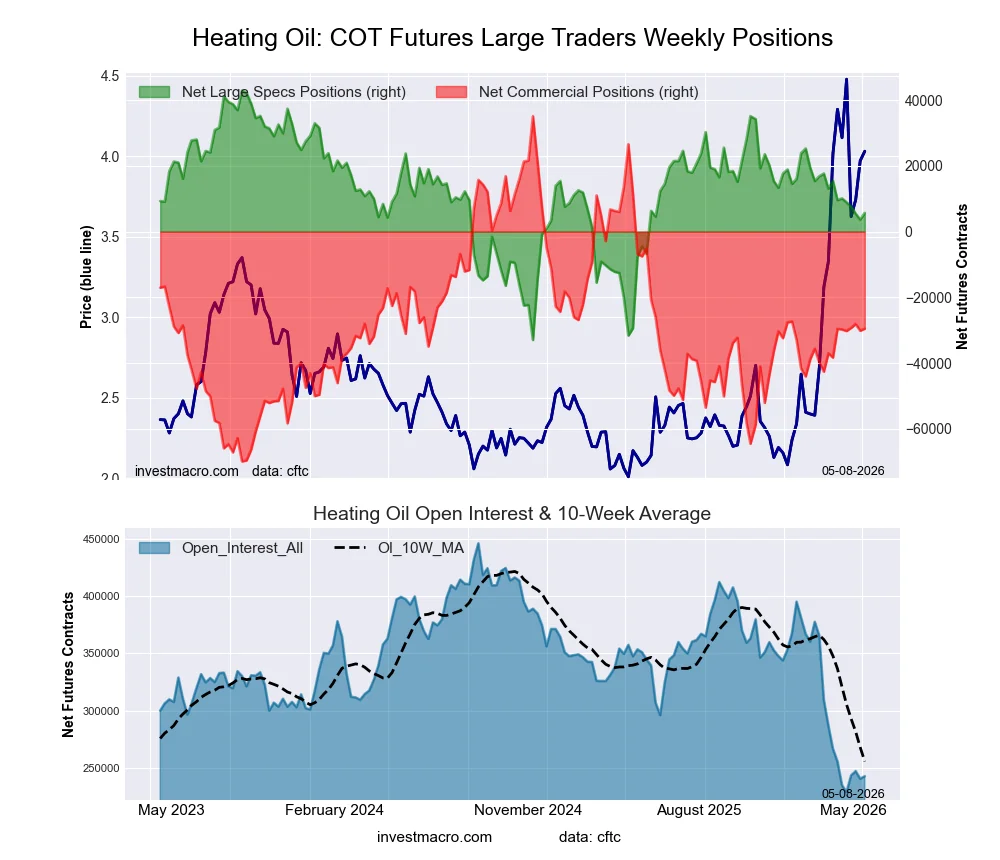
Leading the gains for the energy markets was Brent Oil (16,333 contracts) with Gasoline (2,677 contracts) and Heating Oil (2,022 contracts) also having positive weeks.
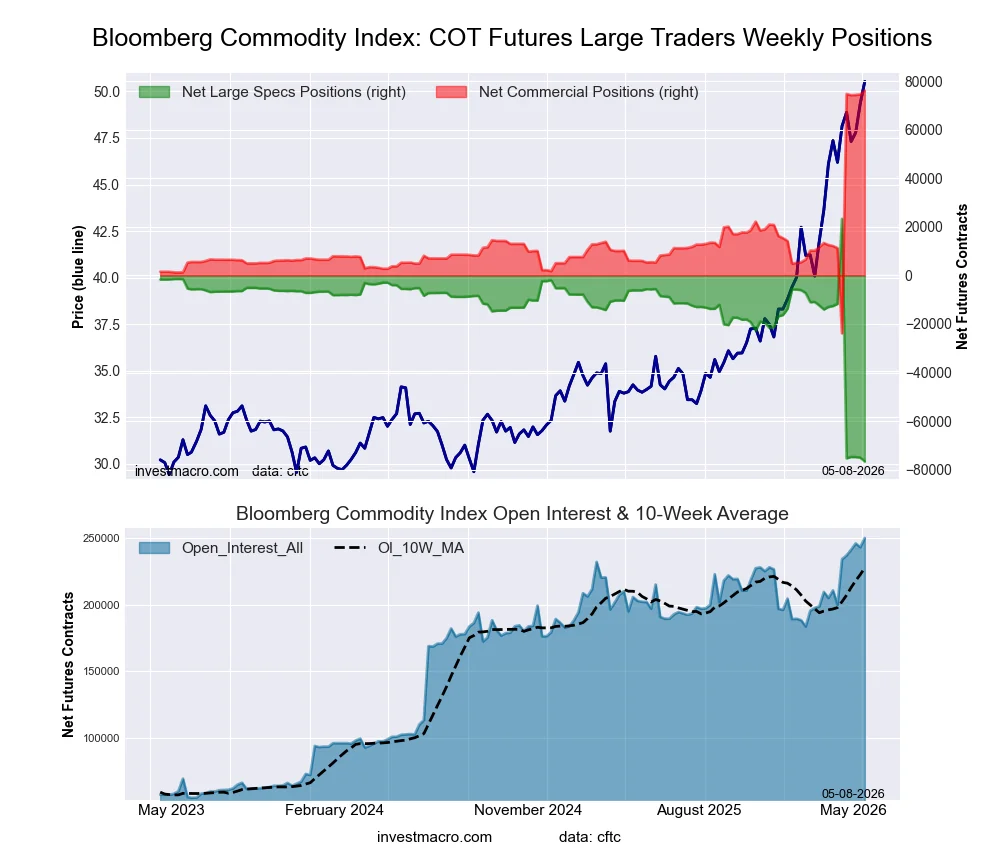
The markets with declines in speculator bets for the week were WTI Crude (-13,125 contracts), Bloomberg Index (-1,552 contracts) and Natural Gas (-373 contracts) also seeing lower bets on the week.
Free Reports:
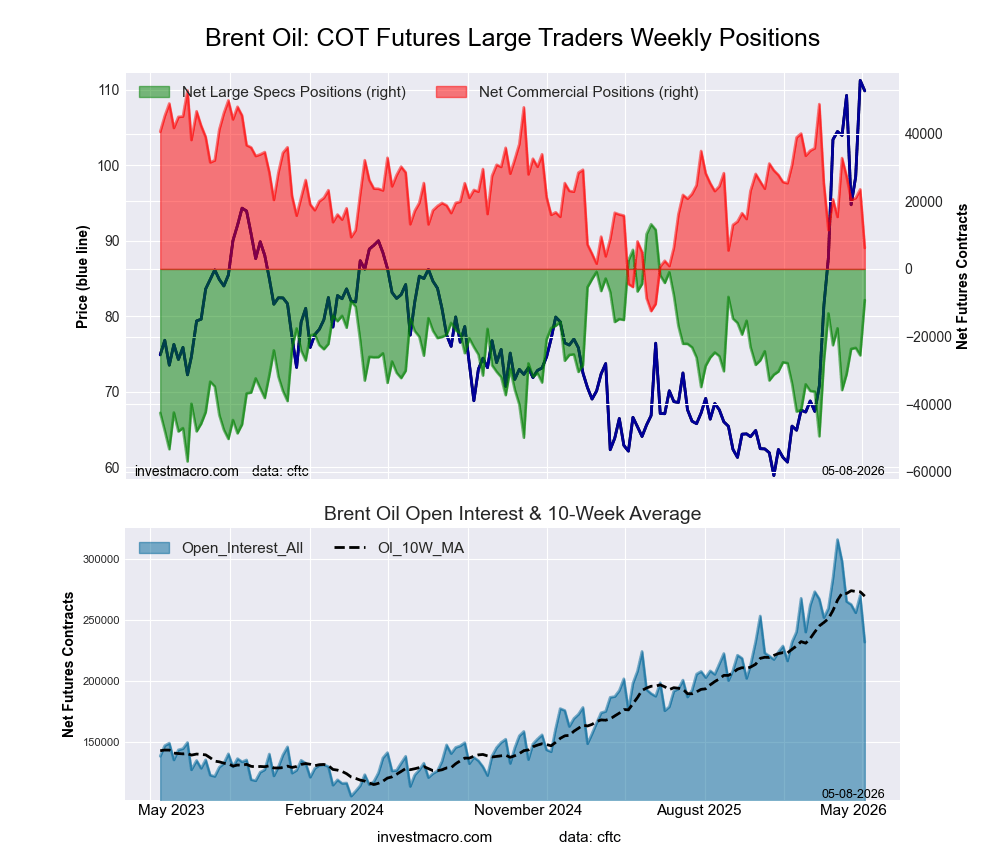
Highlighting Energy futures markets this week is Brent Crude Oil. This market saw a jump by over 16,000 speculative net contracts this week and this market has seen gains in seven out of the past 10 weeks. The Brent Crude Oil futures market traditionally has a negative net large speculator standing due to a lot of hedging activity. This week, however, the market is close to an almost neutral overall position with a total of -9,224 net contracts. This is the least bearish level for Brent Crude Oil since October 2025. Typically, when bets have fallen this low, the oil price is also low. The last two times the net position has been this low, the Brent Crude Oil price has been trading around $60 per barrel. But due to the Iran war, the oil price is currently over $100 per barrel with perhaps more risk to the upside at the moment.
In the Energy markets, In the Energy markets price performances, we saw lower markets all across the board for the week. Heating Oil dipped by -1.43%, followed by the Bloomberg Commodity Index, which fell by -1.63%.
Gasoline was lower by over 2% this week with a -2.02% decline. Natural Gas was also lower by -2.68%. Brent Oil fell by -6.58%, while WTI Crude Oil was the biggest negative returner on the week with a -7.32% decrease.
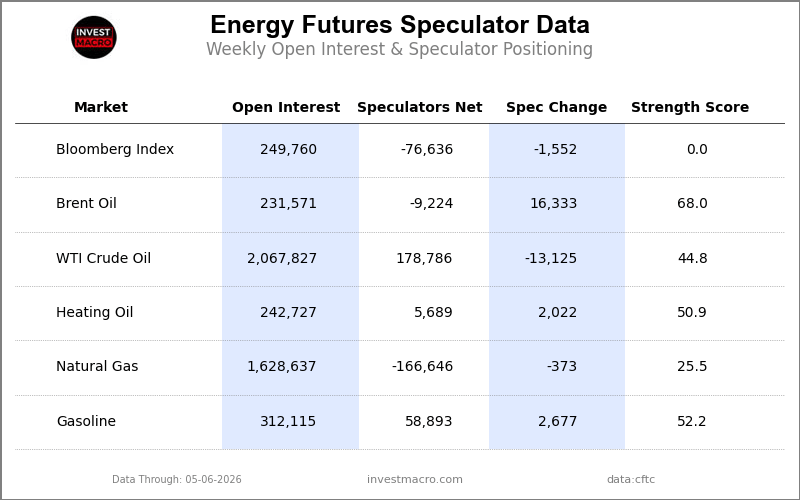
Legend: Weekly Speculators Change | Speculators Current Net Position | Speculators Strength Score compared to last 3-Years (0-100 range)
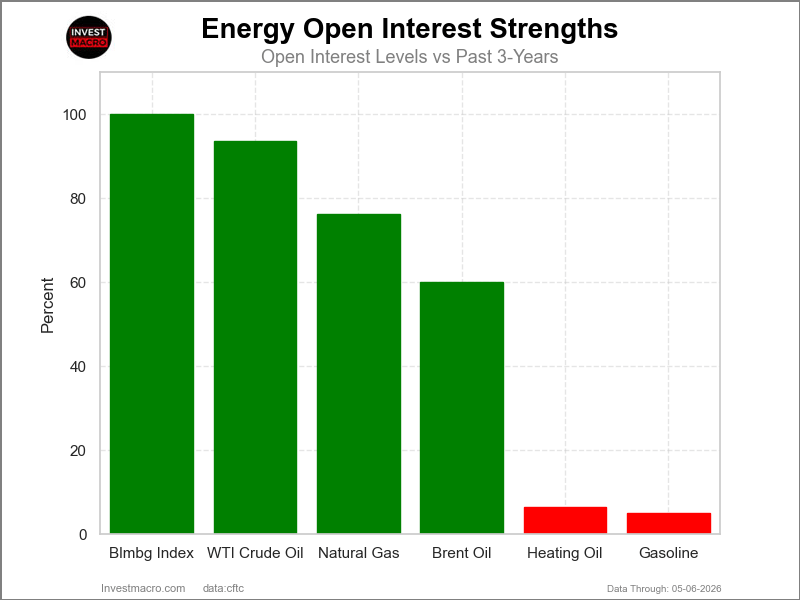
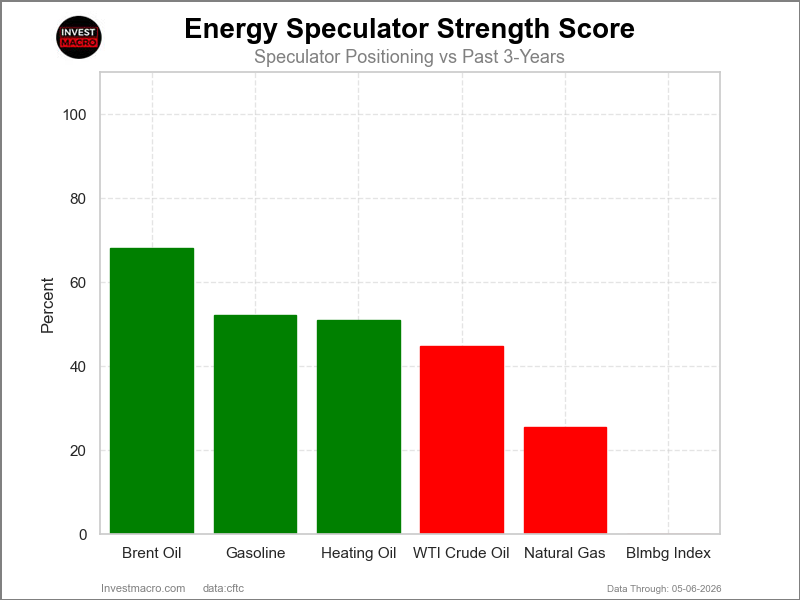
COT Strength Scores (a normalized measure of Speculator positions over a 3-Year range, from 0 to 100 where above 80 is Extreme-Bullish and below 20 is Extreme-Bearish) showed that Brent Oil (68.0 percent) and Gasoline (52.2 percent) lead the energy markets this week.
On the downside, the Bloomberg Index (0.0 percent) comes in at the lowest strength level currently and is in Extreme-Bearish territory (below 20 percent). The next lowest strength score was Natural Gas (25.5 percent).
Strength Statistics:
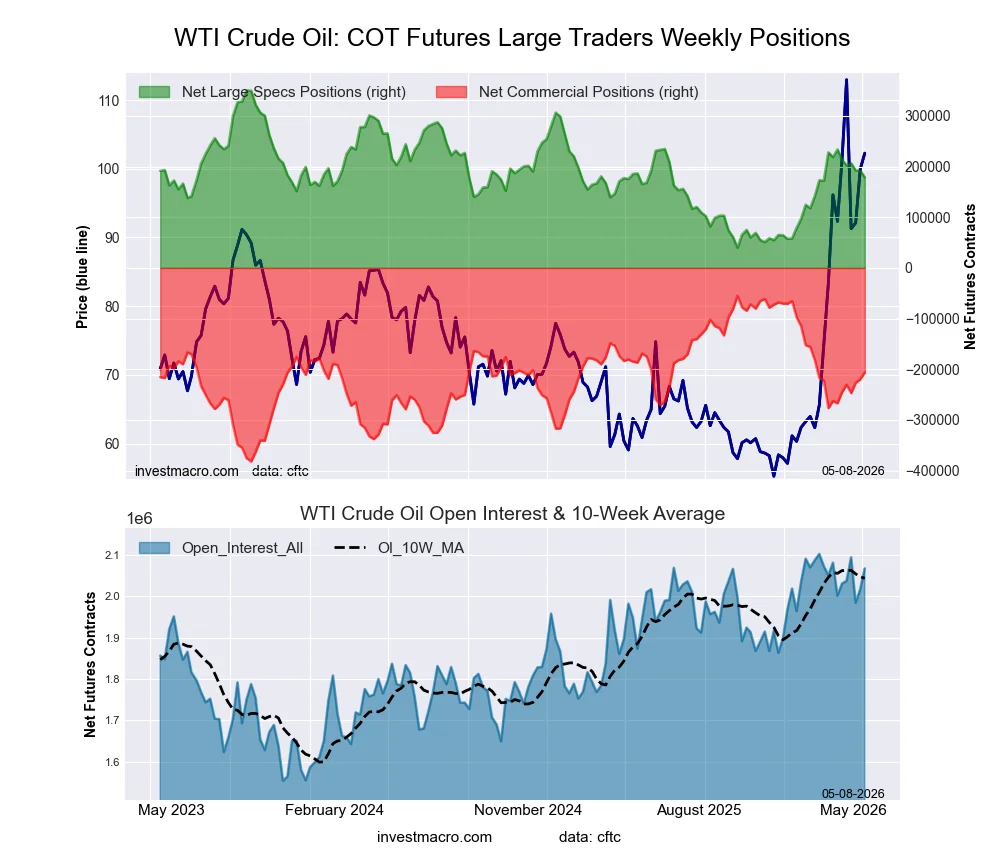
WTI Crude Oil (44.8 percent) vs WTI Crude Oil previous week (49.0 percent)
Brent Crude Oil (68.0 percent) vs Brent Crude Oil previous week (44.7 percent)
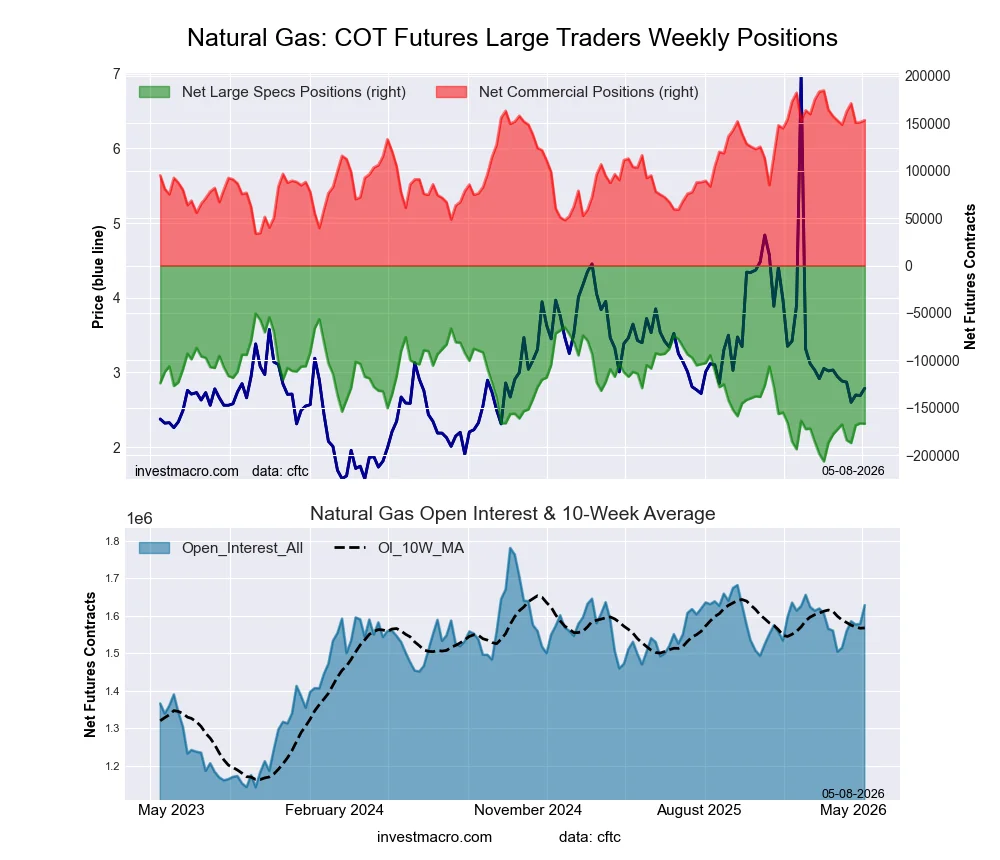
Natural Gas (25.5 percent) vs Natural Gas previous week (25.8 percent)
Gasoline (52.2 percent) vs Gasoline previous week (49.2 percent)
Heating Oil (50.9 percent) vs Heating Oil previous week (48.3 percent)
Bloomberg Commodity Index (0.0 percent) vs Bloomberg Commodity Index previous week (1.6 percent)
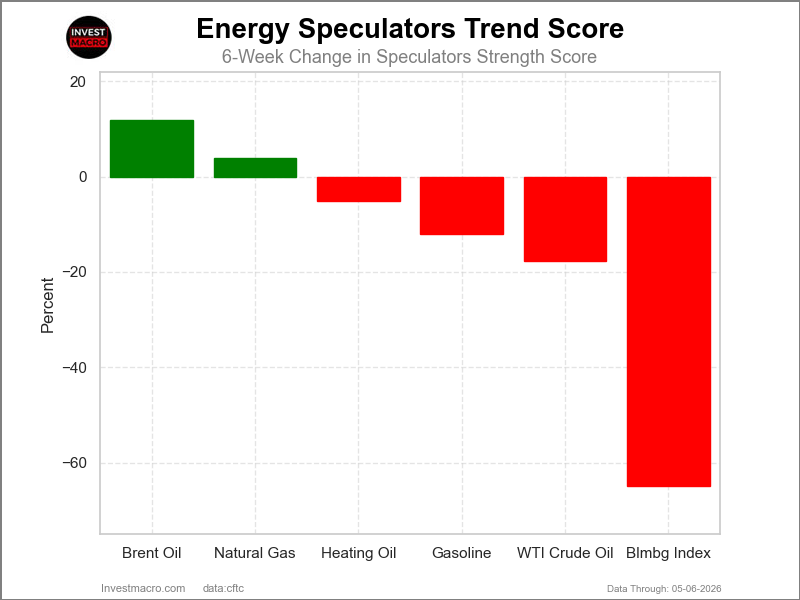
COT Strength Score Trends (or move index, calculates the 6-week changes in strength scores) showed that Brent Oil (11.9 percent) and Natural Gas (3.8 percent) lead the past six weeks trends for the energy markets.
The Bloomberg Index (-64.9 percent) leads the downside trend scores currently with WTI Crude Oil (-17.7 percent) as the next market with lower trend scores.
Move Statistics:
WTI Crude Oil (-17.7 percent) vs WTI Crude Oil previous week (-8.6 percent)
Brent Crude Oil (11.9 percent) vs Brent Crude Oil previous week (-4.3 percent)
Natural Gas (3.8 percent) vs Natural Gas previous week (7.5 percent)
Gasoline (-12.1 percent) vs Gasoline previous week (-22.5 percent)
Heating Oil (-5.1 percent) vs Heating Oil previous week (-15.5 percent)
Bloomberg Commodity Index (-64.9 percent) vs Bloomberg Commodity Index previous week (-62.5 percent)
Our weekly trend-following model classifies the current market price position as: Uptrend.
| WTI Crude Oil Futures Statistics | SPECULATORS | COMMERCIALS | SMALL TRADERS |
| – Percent of Open Interest Longs: | 18.5 | 45.1 | 3.8 |
| – Percent of Open Interest Shorts: | 9.8 | 55.1 | 2.5 |
| – Net Position: | 178,786 | -206,150 | 27,364 |
| – Gross Longs: | 381,542 | 933,442 | 79,154 |
| – Gross Shorts: | 202,756 | 1,139,592 | 51,790 |
| – Long to Short Ratio: | 1.9 to 1 | 0.8 to 1 | 1.5 to 1 |
| NET POSITION TREND: | |||
| – Strength Index Score (3 Year Range Pct): | 44.8 | 53.8 | 55.0 |
| – Strength Index Reading (3 Year Range): | Bearish | Bullish | Bullish |
| NET POSITION MOVEMENT INDEX: | |||
| – 6-Week Change in Strength Index: | -17.7 | 18.6 | -11.9 |
Our weekly trend-following model classifies the current market price position as: Uptrend.
| Brent Crude Oil Futures Statistics | SPECULATORS | COMMERCIALS | SMALL TRADERS |
| – Percent of Open Interest Longs: | 30.9 | 32.0 | 4.1 |
| – Percent of Open Interest Shorts: | 34.9 | 29.3 | 2.8 |
| – Net Position: | -9,224 | 6,203 | 3,021 |
| – Gross Longs: | 71,485 | 74,079 | 9,396 |
| – Gross Shorts: | 80,709 | 67,876 | 6,375 |
| – Long to Short Ratio: | 0.9 to 1 | 1.1 to 1 | 1.5 to 1 |
| NET POSITION TREND: | |||
| – Strength Index Score (3 Year Range Pct): | 68.0 | 28.6 | 81.6 |
| – Strength Index Reading (3 Year Range): | Bullish | Bearish | Bullish-Extreme |
| NET POSITION MOVEMENT INDEX: | |||
| – 6-Week Change in Strength Index: | 11.9 | -14.1 | 11.3 |
Our weekly trend-following model classifies the current market price position as: Downtrend.
| Natural Gas Futures Statistics | SPECULATORS | COMMERCIALS | SMALL TRADERS |
| – Percent of Open Interest Longs: | 14.6 | 35.5 | 3.4 |
| – Percent of Open Interest Shorts: | 24.8 | 26.1 | 2.6 |
| – Net Position: | -166,646 | 153,150 | 13,496 |
| – Gross Longs: | 237,674 | 578,708 | 55,616 |
| – Gross Shorts: | 404,320 | 425,558 | 42,120 |
| – Long to Short Ratio: | 0.6 to 1 | 1.4 to 1 | 1.3 to 1 |
| NET POSITION TREND: | |||
| – Strength Index Score (3 Year Range Pct): | 25.5 | 79.3 | 37.2 |
| – Strength Index Reading (3 Year Range): | Bearish | Bullish | Bearish |
| NET POSITION MOVEMENT INDEX: | |||
| – 6-Week Change in Strength Index: | 3.8 | 0.3 | -16.1 |
Our weekly trend-following model classifies the current market price position as: Uptrend.
| Nasdaq Mini Futures Statistics | SPECULATORS | COMMERCIALS | SMALL TRADERS |
| – Percent of Open Interest Longs: | 26.7 | 47.8 | 8.4 |
| – Percent of Open Interest Shorts: | 7.8 | 71.4 | 3.8 |
| – Net Position: | 58,893 | -73,382 | 14,489 |
| – Gross Longs: | 83,248 | 149,329 | 26,330 |
| – Gross Shorts: | 24,355 | 222,711 | 11,841 |
| – Long to Short Ratio: | 3.4 to 1 | 0.7 to 1 | 2.2 to 1 |
| NET POSITION TREND: | |||
| – Strength Index Score (3 Year Range Pct): | 52.2 | 38.5 | 83.6 |
| – Strength Index Reading (3 Year Range): | Bullish | Bearish | Bullish-Extreme |
| NET POSITION MOVEMENT INDEX: | |||
| – 6-Week Change in Strength Index: | -12.1 | 10.1 | 4.2 |
Our weekly trend-following model classifies the current market price position as: Uptrend.
| Heating Oil Futures Statistics | SPECULATORS | COMMERCIALS | SMALL TRADERS |
| – Percent of Open Interest Longs: | 17.4 | 47.8 | 19.0 |
| – Percent of Open Interest Shorts: | 15.0 | 59.9 | 9.2 |
| – Net Position: | 5,689 | -29,537 | 23,848 |
| – Gross Longs: | 42,178 | 115,956 | 46,091 |
| – Gross Shorts: | 36,489 | 145,493 | 22,243 |
| – Long to Short Ratio: | 1.2 to 1 | 0.8 to 1 | 2.1 to 1 |
| NET POSITION TREND: | |||
| – Strength Index Score (3 Year Range Pct): | 50.9 | 38.4 | 83.3 |
| – Strength Index Reading (3 Year Range): | Bullish | Bearish | Bullish-Extreme |
| NET POSITION MOVEMENT INDEX: | |||
| – 6-Week Change in Strength Index: | -5.1 | 0.1 | 10.4 |
Our weekly trend-following model classifies the current market price position as: Uptrend.
| Bloomberg Index Futures Statistics | SPECULATORS | COMMERCIALS | SMALL TRADERS |
| – Percent of Open Interest Longs: | 44.7 | 54.5 | 0.2 |
| – Percent of Open Interest Shorts: | 75.4 | 24.0 | 0.0 |
| – Net Position: | -76,636 | 76,162 | 474 |
| – Gross Longs: | 111,634 | 136,162 | 527 |
| – Gross Shorts: | 188,270 | 60,000 | 53 |
| – Long to Short Ratio: | 0.6 to 1 | 2.3 to 1 | 9.9 to 1 |
| NET POSITION TREND: | |||
| – Strength Index Score (3 Year Range Pct): | 0.0 | 100.0 | 63.1 |
| – Strength Index Reading (3 Year Range): | Bearish-Extreme | Bullish-Extreme | Bullish |
| NET POSITION MOVEMENT INDEX: | |||
| – 6-Week Change in Strength Index: | -64.9 | 64.9 | 1.8 |
Article By InvestMacro – Receive our weekly COT Newsletter
*COT Report: The COT data, released weekly to the public each Friday, is updated through the most recent Tuesday (data is 3 days old) and shows a quick view of how large speculators or non-commercials (for-profit traders) were positioned in the futures markets.
The CFTC categorizes trader positions according to commercial hedgers (traders who use futures contracts for hedging as part of the business), non-commercials (large traders who speculate to realize trading profits) and nonreportable traders (usually small traders/speculators) as well as their open interest (contracts open in the market at time of reporting). See CFTC criteria here.
By JustMarkets On Thursday, the US stock indices posted strong gains, fully recovering from the…
By Analytical Department RoboForex USD/JPY recovered to 160.60 on Friday following a sharp drop the…
By Patrick J. Schena, Tufts University Creating a government fund to own AI stock and…
By JustMarkets The US equity indices ended Wednesday’s session with notable declines as geopolitical risks…
By Analytical Department RoboForex USD/JPY held near 163.50 on Thursday, with the yen retreating slightly…
By Analytical Department RoboForex GBP/USD continued to consolidate at 1.3283 on Wednesday. The British pound…
This website uses cookies.