By Analytical Department RoboForex
The price of gold rose to 4,800 USD per troy ounce on Wednesday, with the local trend gaining strength. The precious metal is supported by expectations of a possible agreement between the US and Iran, which would reduce the risks of an energy-driven inflationary shock.
Press reports indicate that Washington and Tehran are working to organise a new round of negotiations following the breakdown in dialogue over the weekend. At the same time, the US is maintaining a naval blockade of Iranian oil supplies through the Strait of Hormuz. Iran is reportedly considering temporarily suspending exports via this route to advance negotiations.
An additional supporting factor is the decline in oil prices below 90.00 USD per barrel and the weakening of the US dollar to six-week lows. Both developments traditionally boost demand for gold.
Markets are also revising their monetary policy expectations. The Federal Reserve is adopting a wait-and-see approach when assessing inflation risks, which is reducing pressure on precious metals.
Technical Analysis
Free Reports:
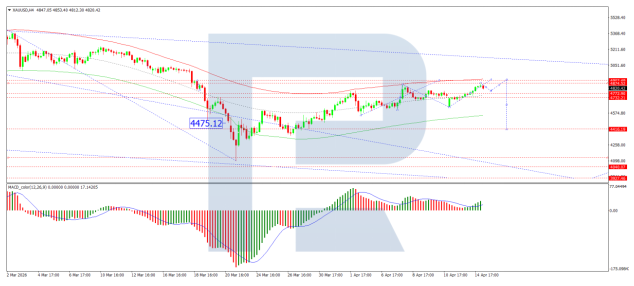
On the H4 XAU/USD chart, the market is forming a consolidation range around the 4,772 USD level. An upside breakout would open potential for a correction to 4,903 USD. A downside breakout could see the beginning of a downward wave to 4,460 USD. The MACD indicator confirms the current upward momentum, with its signal line above the centre line and pointing firmly upwards.
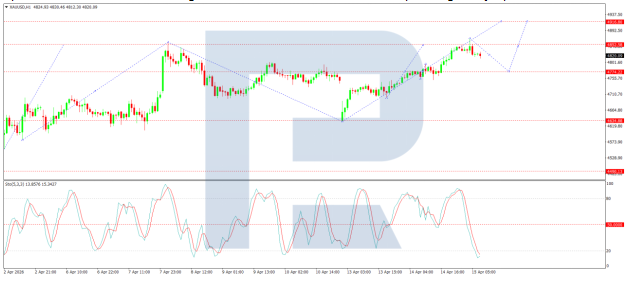
On the H1 chart, the market has broken above the 4,775 USD level and completed a wave to 4,868 USD. A correction to the 4,775 USD level (testing from above) is likely, followed by a possible rise to 4,903 USD. The Stochastic oscillator supports this scenario, with its signal line remaining below the 20 level and showing upward pressure towards 80.
Conclusion
Gold is trading in positive territory as hopes for a renewed US-Iran negotiation effort ease concerns over an energy-driven inflationary shock. The combination of falling oil prices (below 90.00 USD per barrel), a weaker dollar (at six-week lows), and the Fed’s patient stance on inflation risks has created a supportive environment for the precious metal. While the US maintains a naval blockade and Iran considers suspending exports to advance talks, the market is cautiously optimistic. Technical indicators suggest further upside potential towards 4,903 USD, although any setbacks in diplomatic efforts could quickly reverse the current momentum.
Disclaimer
Any forecasts contained herein are based on the author’s particular opinion. This analysis may not be treated as trading advice. RoboForex bears no responsibility for trading results based on trading recommendations and reviews contained herein.
By InvestMacro Here are the latest charts and statistics for the Commitment of Traders (COT)…
By InvestMacro The latest update for the weekly Commitment of Traders (COT) report was released…
By InvestMacro Here are the latest charts and statistics for the Commitment of Traders (COT)…
By InvestMacro Here are the latest charts and statistics for the Commitment of Traders (COT)…
By InvestMacro Here are the latest charts and statistics for the Commitment of Traders (COT)…
By InvestMacro Here are the latest charts and statistics for the Commitment of Traders (COT)…
This website uses cookies.