By InvestMacro
Here are the latest charts and statistics for the Commitment of Traders (COT) reports data published by the Commodities Futures Trading Commission (CFTC).
The latest COT data is updated through Tuesday March 3rd and shows a quick view of how large traders (for-profit speculators and commercial hedgers) were positioned in the futures markets.
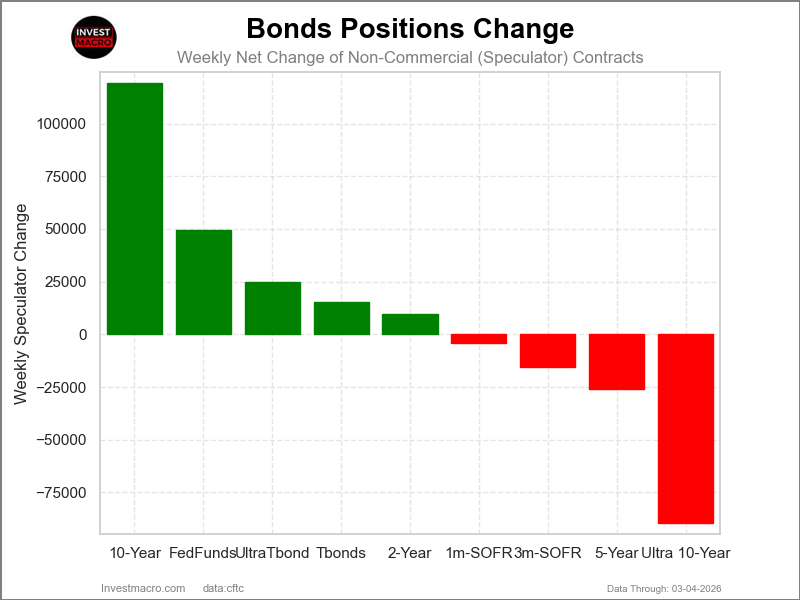
The COT bond market speculator bets were slightly higher this week as five out of the nine bond markets we cover had higher positioning while the other four markets had lower speculator contracts.
Leading the gains for the bond markets was the 10-Year Bonds (119,513 contracts) with the Fed Funds (49,366 contracts), the Ultra Treasury Bonds (24,793 contracts), the US Treasury Bonds (15,191 contracts) and the 2-Year Bonds (9,495 contracts) also showed a positive week.
The bond markets with declines in speculator bets for the week were the Ultra 10-Year Bonds (-89,757 contracts), the 5-Year Bonds (-25,863 contracts), the SOFR 3-Months (-15,481 contracts) and with the SOFR 1-Month (-4,108 contracts) also recording lower bets on the week.
Free Reports:
The Fed Funds was the only market this week that did not see a dip in price performance as the Fed Funds were approximately unchanged on the week. The one-month Secured Overnight Financing Rate was lower by -0.01%, while the three-month Secured Overnight Financing Rate was also lower by -0.01%.
The 2-Year Bond fell by -0.55% on the week, while the 5-Year Bond was lower by -1.09% and the 10-Year Note was down by -1.58%. The long US Treasury Bond was the largest decliner on the week with a drop lower by -2.5%.
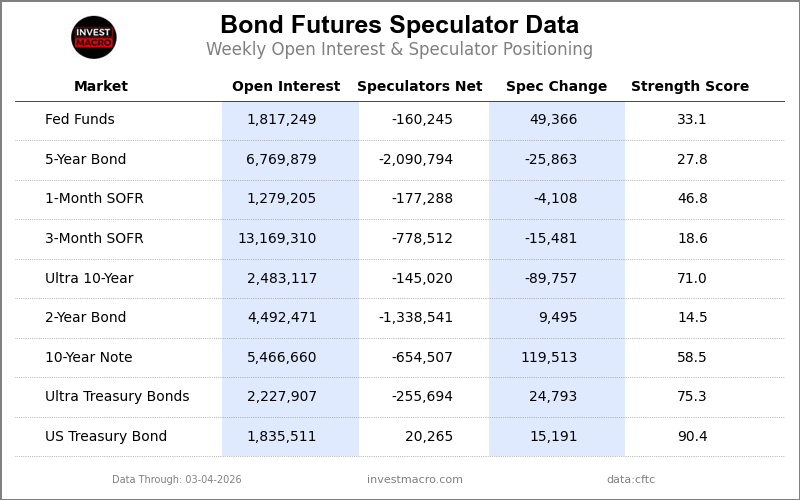
Legend: Open Interest | Speculators Current Net Position | Weekly Specs Change | Specs Strength Score compared to last 3-Years (0-100 range)
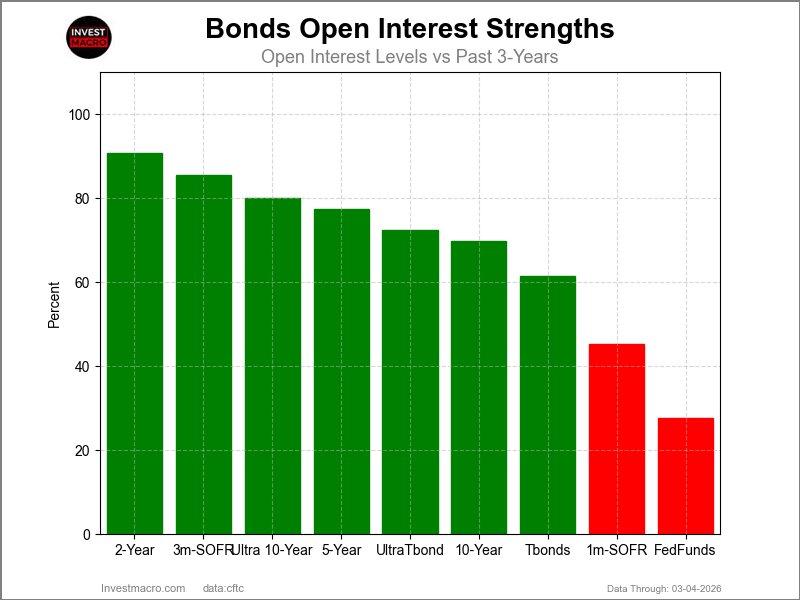
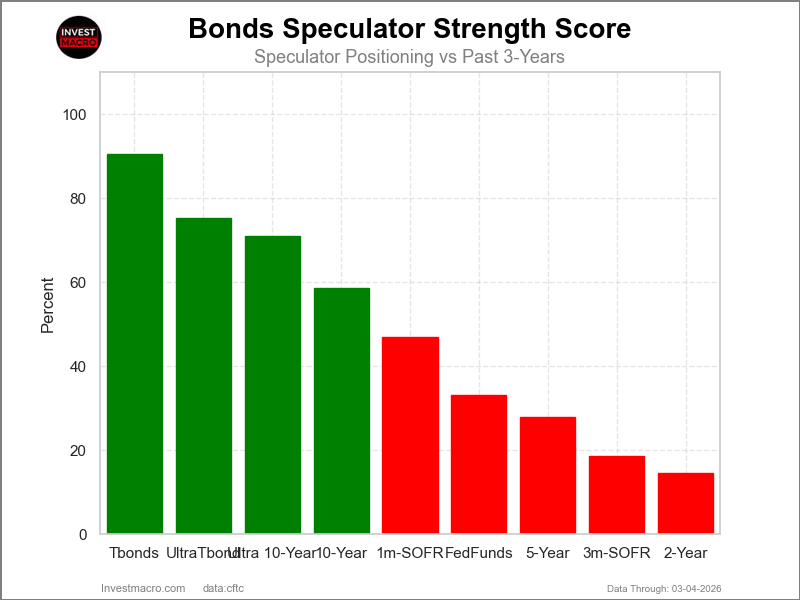
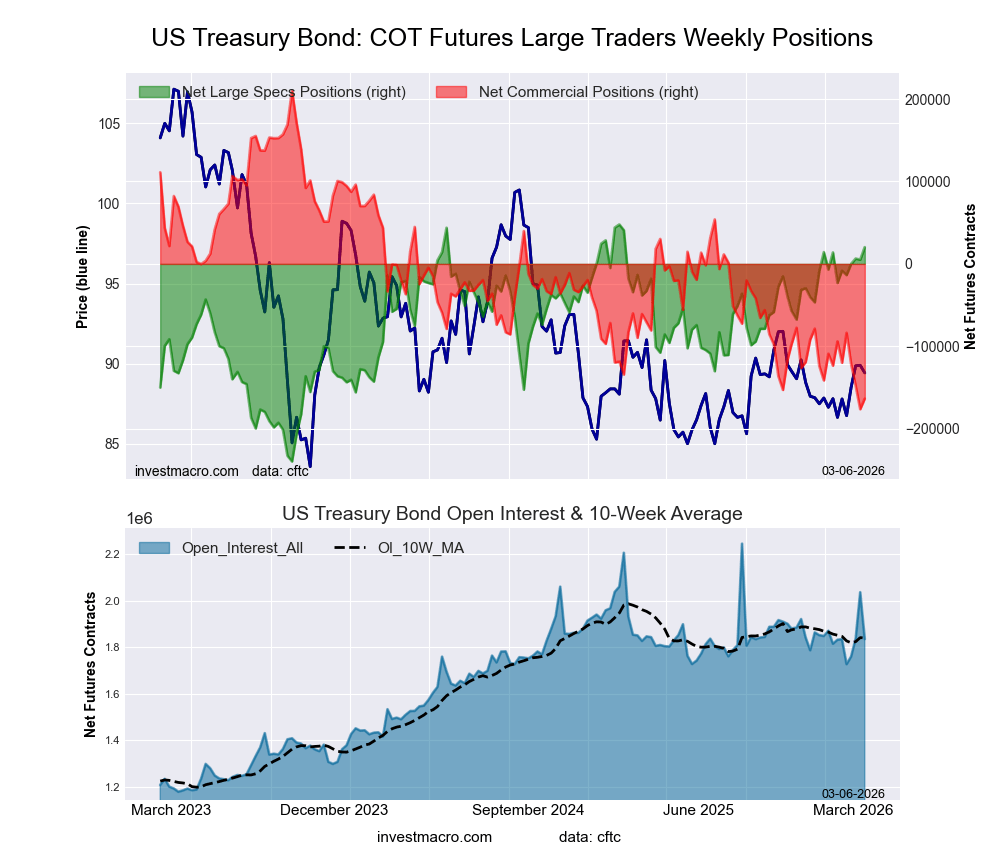
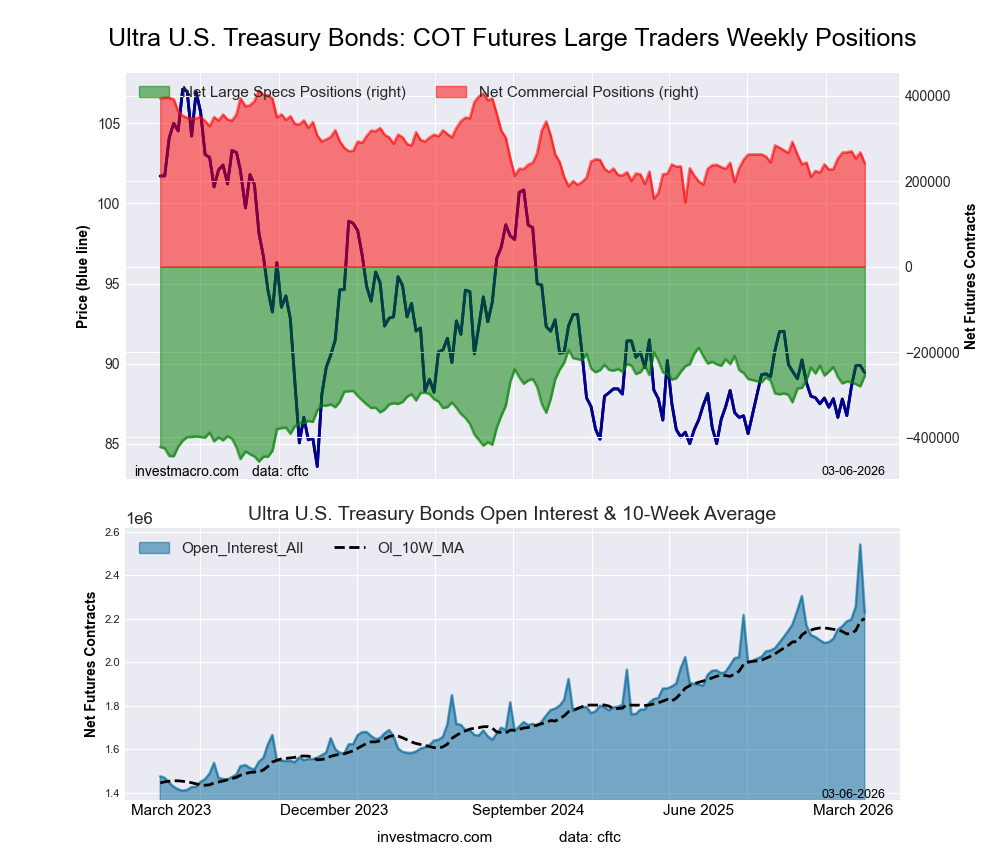
COT Strength Scores (a normalized measure of Speculator positions over a 3-Year range, from 0 to 100 where above 80 is Extreme-Bullish and below 20 is Extreme-Bearish) showed that the US Treasury Bonds (90 percent) and the Ultra Treasury Bonds (75 percent) lead the bond markets this week. The Ultra 10-Year Bonds (71 percent) comes in as the next highest in the weekly strength scores.
On the downside, the 2-Year Bonds (15 percent) and the SOFR 3-Months (19 percent) come in at the lowest strength level currently and are in Extreme-Bearish territory (below 20 percent). The next lowest strength score was the 5-Year Bonds (28 percent).
Strength Statistics:
Fed Funds (33.1 percent) vs Fed Funds previous week (26.1 percent)
2-Year Bond (14.5 percent) vs 2-Year Bond previous week (13.5 percent)
5-Year Bond (27.8 percent) vs 5-Year Bond previous week (29.0 percent)
10-Year Bond (58.5 percent) vs 10-Year Bond previous week (44.2 percent)
Ultra 10-Year Bond (71.0 percent) vs Ultra 10-Year Bond previous week (95.3 percent)
US Treasury Bond (90.4 percent) vs US Treasury Bond previous week (85.1 percent)
Ultra US Treasury Bond (75.3 percent) vs Ultra US Treasury Bond previous week (66.0 percent)
SOFR 1-Month (46.8 percent) vs SOFR 1-Month previous week (47.5 percent)
SOFR 3-Months (18.6 percent) vs SOFR 3-Months previous week (19.4 percent)
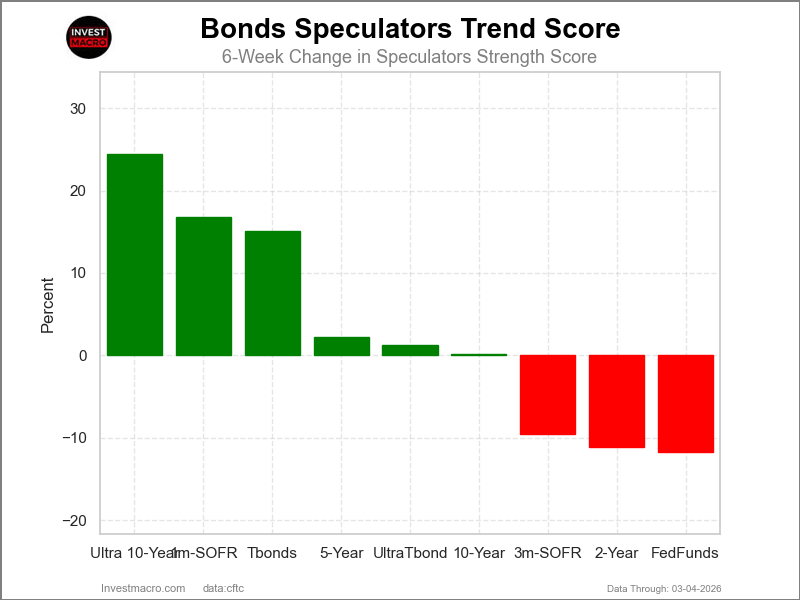
COT Strength Score Trends (or move index, calculates the 6-week changes in strength scores) showed that the Ultra 10-Year Bonds (24 percent) and the SOFR 1-Month (17 percent) lead the past six weeks trends for bonds. The US Treasury Bonds (15 percent) are the next highest positive movers in the latest trends data.
The Fed Funds (-12 percent), the 2-Year Bonds (-11 percent) and the SOFR 3-Months (-10 percent) leads the downside trend scores currently.
Strength Trend Statistics:
Fed Funds (-11.7 percent) vs Fed Funds previous week (-38.2 percent)
2-Year Bond (-11.1 percent) vs 2-Year Bond previous week (-4.2 percent)
5-Year Bond (2.2 percent) vs 5-Year Bond previous week (9.6 percent)
10-Year Bond (0.1 percent) vs 10-Year Bond previous week (11.5 percent)
Ultra 10-Year Bond (24.4 percent) vs Ultra 10-Year Bond previous week (52.3 percent)
US Treasury Bond (15.1 percent) vs US Treasury Bond previous week (-3.0 percent)
Ultra US Treasury Bond (1.2 percent) vs Ultra US Treasury Bond previous week (-17.0 percent)
SOFR 1-Month (16.8 percent) vs SOFR 1-Month previous week (17.4 percent)
SOFR 3-Months (-9.6 percent) vs SOFR 3-Months previous week (-12.5 percent)
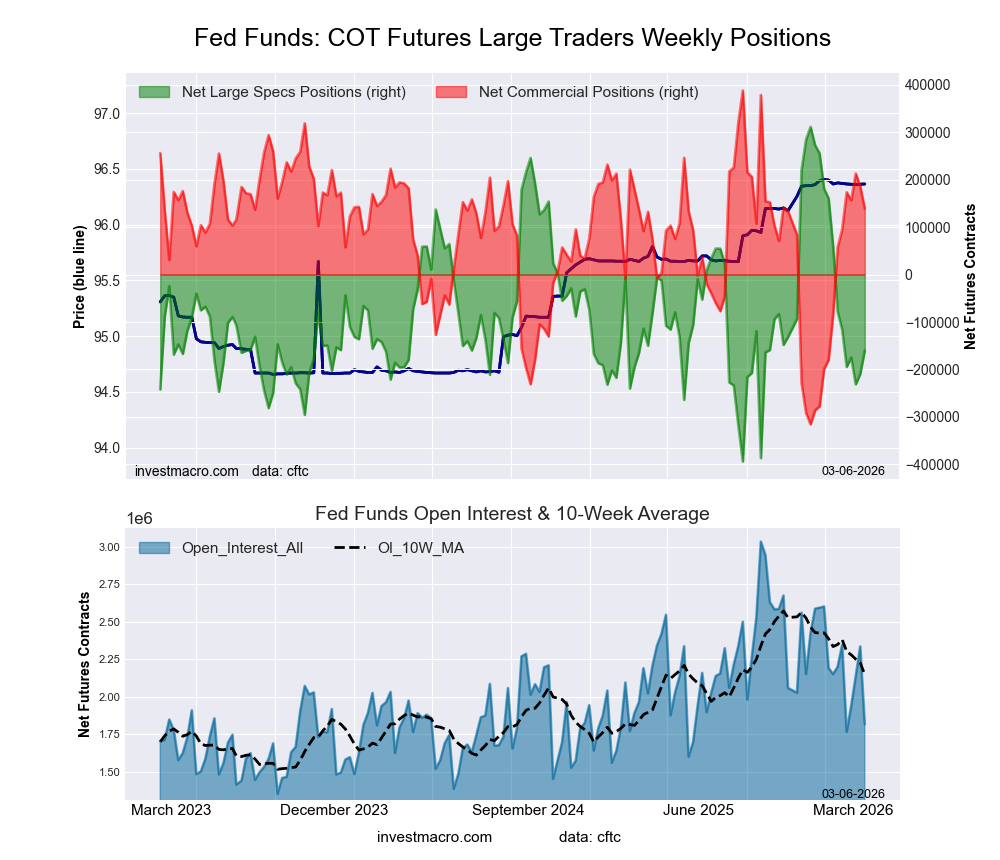
This week’s current strength score (the trader positioning range over the past three years, measured from 0 to 100) shows the speculators are currently Bearish with a score of 33.1 percent. The commercials are Bullish with a score of 64.7 percent and the small traders (not shown in chart) are Bullish-Extreme with a score of 90.0 percent.
Our weekly trend-following model classifies the current market price position as: Weak Uptrend.
| 30-Day Federal Funds Statistics | SPECULATORS | COMMERCIALS | SMALL TRADERS |
| – Percent of Open Interest Longs: | 12.5 | 67.4 | 2.5 |
| – Percent of Open Interest Shorts: | 21.3 | 59.7 | 1.3 |
| – Net Position: | -160,245 | 139,115 | 21,130 |
| – Gross Longs: | 227,008 | 1,224,038 | 45,288 |
| – Gross Shorts: | 387,253 | 1,084,923 | 24,158 |
| – Long to Short Ratio: | 0.6 to 1 | 1.1 to 1 | 1.9 to 1 |
| NET POSITION TREND: | |||
| – Strength Index Score (3 Year Range Pct): | 33.1 | 64.7 | 90.0 |
| – Strength Index Reading (3 Year Range): | Bearish | Bullish | Bullish-Extreme |
| NET POSITION MOVEMENT INDEX: | |||
| – 6-Week Change in Strength Index: | -11.7 | 11.6 | 1.0 |
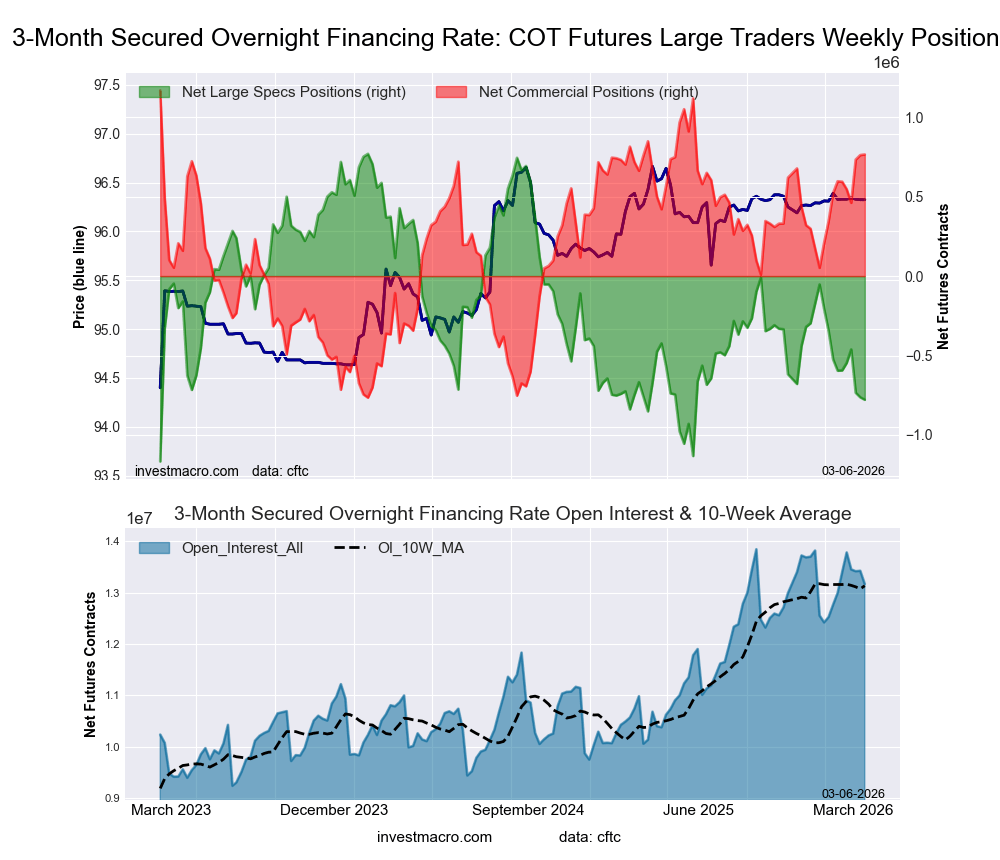
This week’s current strength score (the trader positioning range over the past three years, measured from 0 to 100) shows the speculators are currently Bearish-Extreme with a score of 18.6 percent. The commercials are Bullish-Extreme with a score of 81.2 percent and the small traders (not shown in chart) are Bullish-Extreme with a score of 84.7 percent.
Our weekly trend-following model classifies the current market price position as: Weak Uptrend.
| SOFR 3-Months Statistics | SPECULATORS | COMMERCIALS | SMALL TRADERS |
| – Percent of Open Interest Longs: | 13.1 | 57.4 | 0.5 |
| – Percent of Open Interest Shorts: | 19.0 | 51.6 | 0.4 |
| – Net Position: | -778,512 | 765,404 | 13,108 |
| – Gross Longs: | 1,729,384 | 7,557,162 | 64,763 |
| – Gross Shorts: | 2,507,896 | 6,791,758 | 51,655 |
| – Long to Short Ratio: | 0.7 to 1 | 1.1 to 1 | 1.3 to 1 |
| NET POSITION TREND: | |||
| – Strength Index Score (3 Year Range Pct): | 18.6 | 81.2 | 84.7 |
| – Strength Index Reading (3 Year Range): | Bearish-Extreme | Bullish-Extreme | Bullish-Extreme |
| NET POSITION MOVEMENT INDEX: | |||
| – 6-Week Change in Strength Index: | -9.6 | 9.0 | 6.9 |
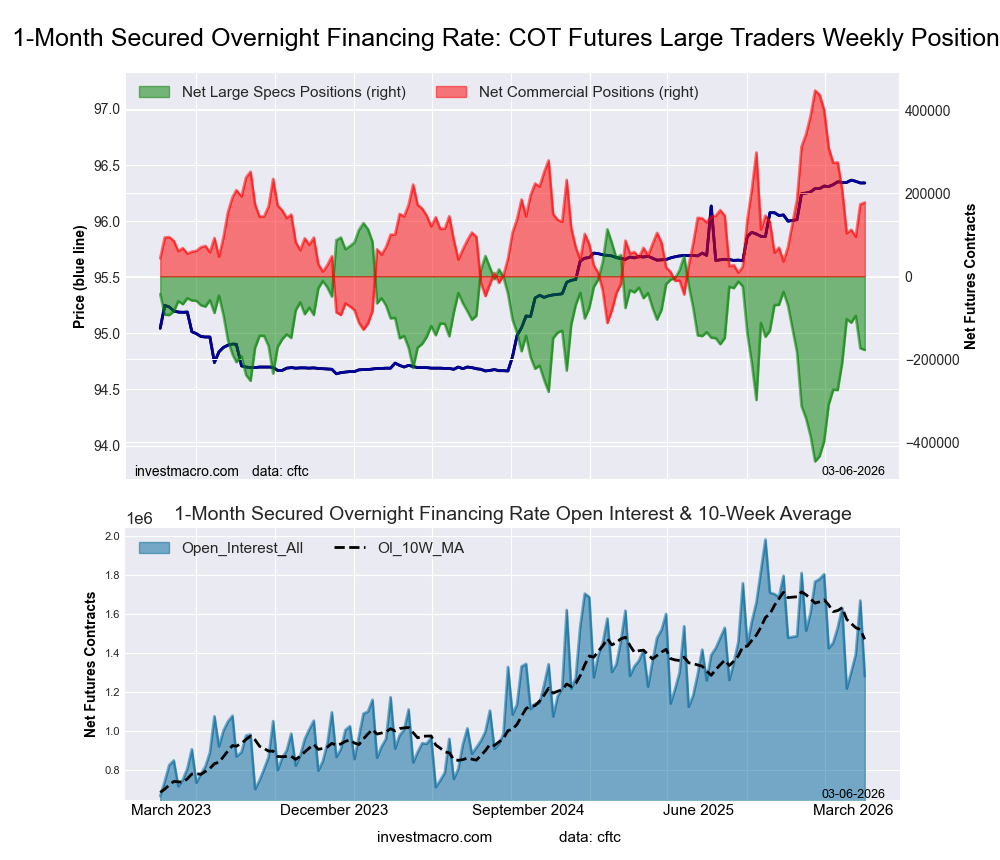
This week’s current strength score (the trader positioning range over the past three years, measured from 0 to 100) shows the speculators are currently Bearish with a score of 46.8 percent. The commercials are Bullish with a score of 53.2 percent and the small traders (not shown in chart) are Bullish with a score of 66.5 percent.
Our weekly trend-following model classifies the current market price position as: Weak Uptrend.
| SOFR 1-Month Statistics | SPECULATORS | COMMERCIALS | SMALL TRADERS |
| – Percent of Open Interest Longs: | 23.3 | 60.0 | 0.0 |
| – Percent of Open Interest Shorts: | 37.2 | 46.2 | 0.0 |
| – Net Position: | -177,288 | 177,472 | -184 |
| – Gross Longs: | 298,453 | 767,910 | 160 |
| – Gross Shorts: | 475,741 | 590,438 | 344 |
| – Long to Short Ratio: | 0.6 to 1 | 1.3 to 1 | 0.5 to 1 |
| NET POSITION TREND: | |||
| – Strength Index Score (3 Year Range Pct): | 46.8 | 53.2 | 66.5 |
| – Strength Index Reading (3 Year Range): | Bearish | Bullish | Bullish |
| NET POSITION MOVEMENT INDEX: | |||
| – 6-Week Change in Strength Index: | 16.8 | -16.8 | -0.2 |
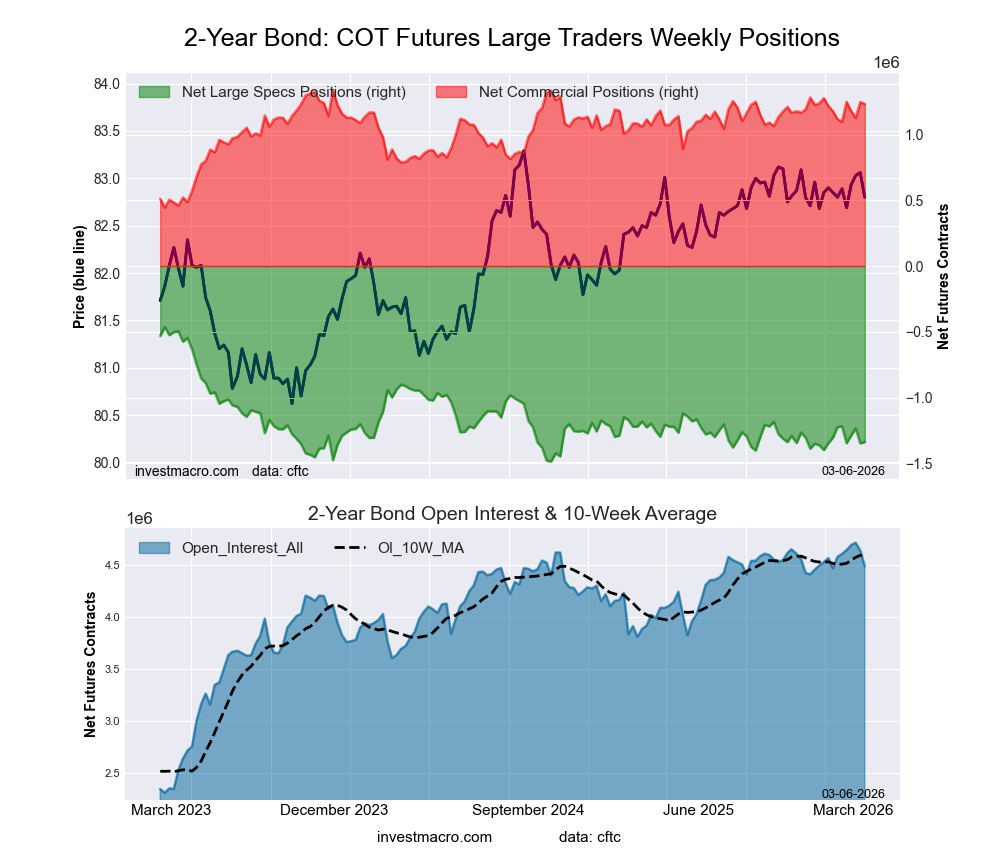
This week’s current strength score (the trader positioning range over the past three years, measured from 0 to 100) shows the speculators are currently Bearish-Extreme with a score of 14.5 percent. The commercials are Bullish-Extreme with a score of 88.6 percent and the small traders (not shown in chart) are Bearish with a score of 41.3 percent.
Our weekly trend-following model classifies the current market price position as: Weak Uptrend.
| 2-Year Treasury Note Statistics | SPECULATORS | COMMERCIALS | SMALL TRADERS |
| – Percent of Open Interest Longs: | 14.8 | 75.5 | 5.3 |
| – Percent of Open Interest Shorts: | 44.6 | 48.1 | 3.0 |
| – Net Position: | -1,338,541 | 1,232,909 | 105,632 |
| – Gross Longs: | 666,377 | 3,393,548 | 238,612 |
| – Gross Shorts: | 2,004,918 | 2,160,639 | 132,980 |
| – Long to Short Ratio: | 0.3 to 1 | 1.6 to 1 | 1.8 to 1 |
| NET POSITION TREND: | |||
| – Strength Index Score (3 Year Range Pct): | 14.5 | 88.6 | 41.3 |
| – Strength Index Reading (3 Year Range): | Bearish-Extreme | Bullish-Extreme | Bearish |
| NET POSITION MOVEMENT INDEX: | |||
| – 6-Week Change in Strength Index: | -11.1 | 13.2 | -1.8 |
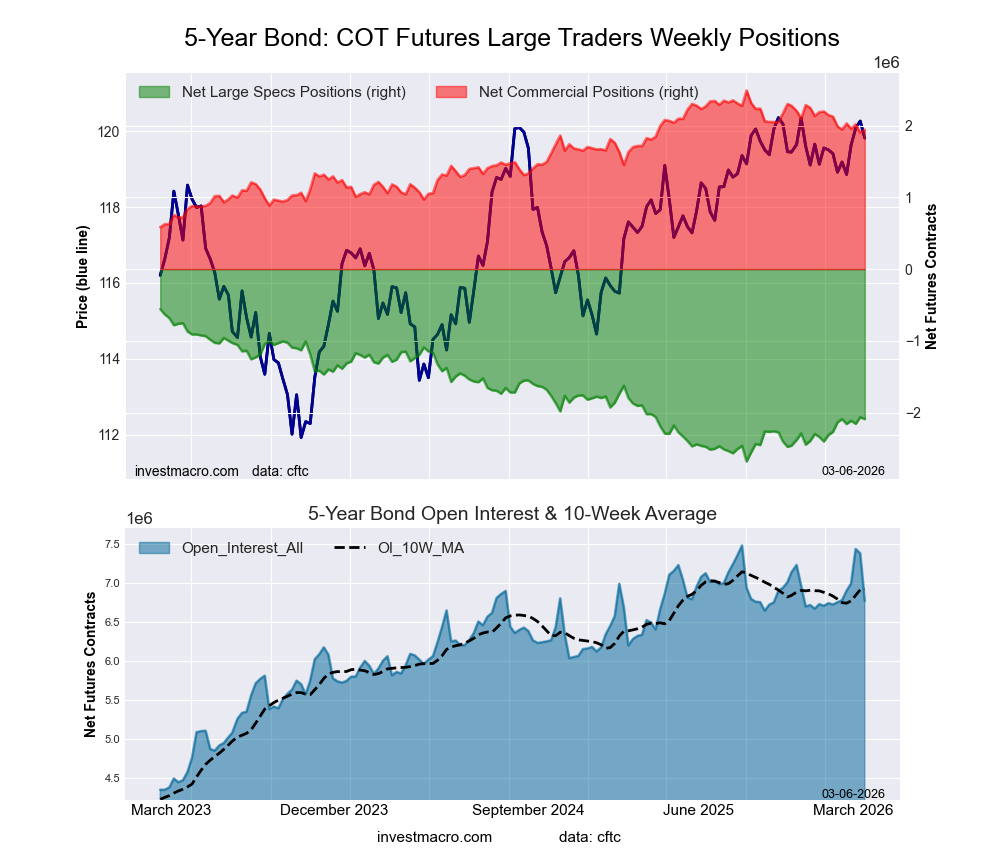
This week’s current strength score (the trader positioning range over the past three years, measured from 0 to 100) shows the speculators are currently Bearish with a score of 27.8 percent. The commercials are Bullish with a score of 71.3 percent and the small traders (not shown in chart) are Bullish with a score of 63.1 percent.
Our weekly trend-following model classifies the current market price position as: Weak Uptrend.
| 5-Year Treasury Note Statistics | SPECULATORS | COMMERCIALS | SMALL TRADERS |
| – Percent of Open Interest Longs: | 7.5 | 81.9 | 6.5 |
| – Percent of Open Interest Shorts: | 38.4 | 53.2 | 4.3 |
| – Net Position: | -2,090,794 | 1,942,942 | 147,852 |
| – Gross Longs: | 510,662 | 5,547,849 | 438,288 |
| – Gross Shorts: | 2,601,456 | 3,604,907 | 290,436 |
| – Long to Short Ratio: | 0.2 to 1 | 1.5 to 1 | 1.5 to 1 |
| NET POSITION TREND: | |||
| – Strength Index Score (3 Year Range Pct): | 27.8 | 71.3 | 63.1 |
| – Strength Index Reading (3 Year Range): | Bearish | Bullish | Bullish |
| NET POSITION MOVEMENT INDEX: | |||
| – 6-Week Change in Strength Index: | 2.2 | -2.5 | 0.7 |
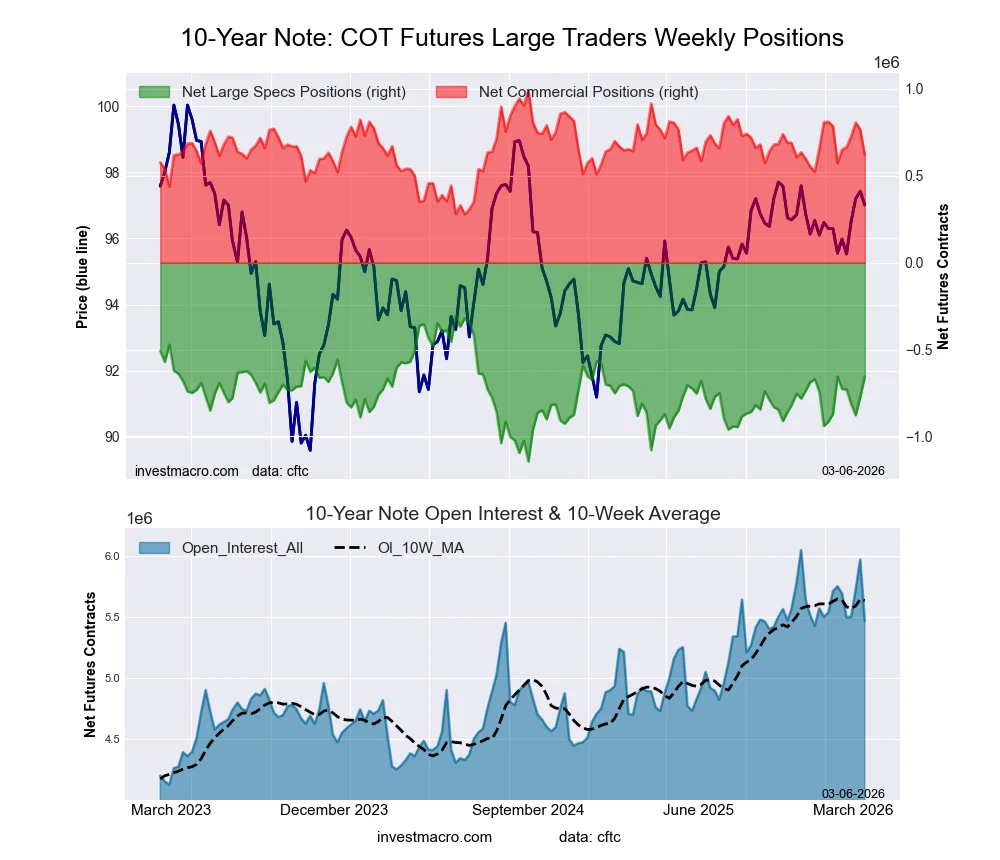
This week’s current strength score (the trader positioning range over the past three years, measured from 0 to 100) shows the speculators are currently Bullish with a score of 58.5 percent. The commercials are Bearish with a score of 47.9 percent and the small traders (not shown in chart) are Bearish with a score of 41.7 percent.
Our weekly trend-following model classifies the current market price position as: Weak Uptrend.
| 10-Year Treasury Note Statistics | SPECULATORS | COMMERCIALS | SMALL TRADERS |
| – Percent of Open Interest Longs: | 11.2 | 77.7 | 7.9 |
| – Percent of Open Interest Shorts: | 23.2 | 66.3 | 7.3 |
| – Net Position: | -654,507 | 620,305 | 34,202 |
| – Gross Longs: | 611,965 | 4,244,872 | 431,657 |
| – Gross Shorts: | 1,266,472 | 3,624,567 | 397,455 |
| – Long to Short Ratio: | 0.5 to 1 | 1.2 to 1 | 1.1 to 1 |
| NET POSITION TREND: | |||
| – Strength Index Score (3 Year Range Pct): | 58.5 | 47.9 | 41.7 |
| – Strength Index Reading (3 Year Range): | Bullish | Bearish | Bearish |
| NET POSITION MOVEMENT INDEX: | |||
| – 6-Week Change in Strength Index: | 0.1 | 6.6 | -19.4 |
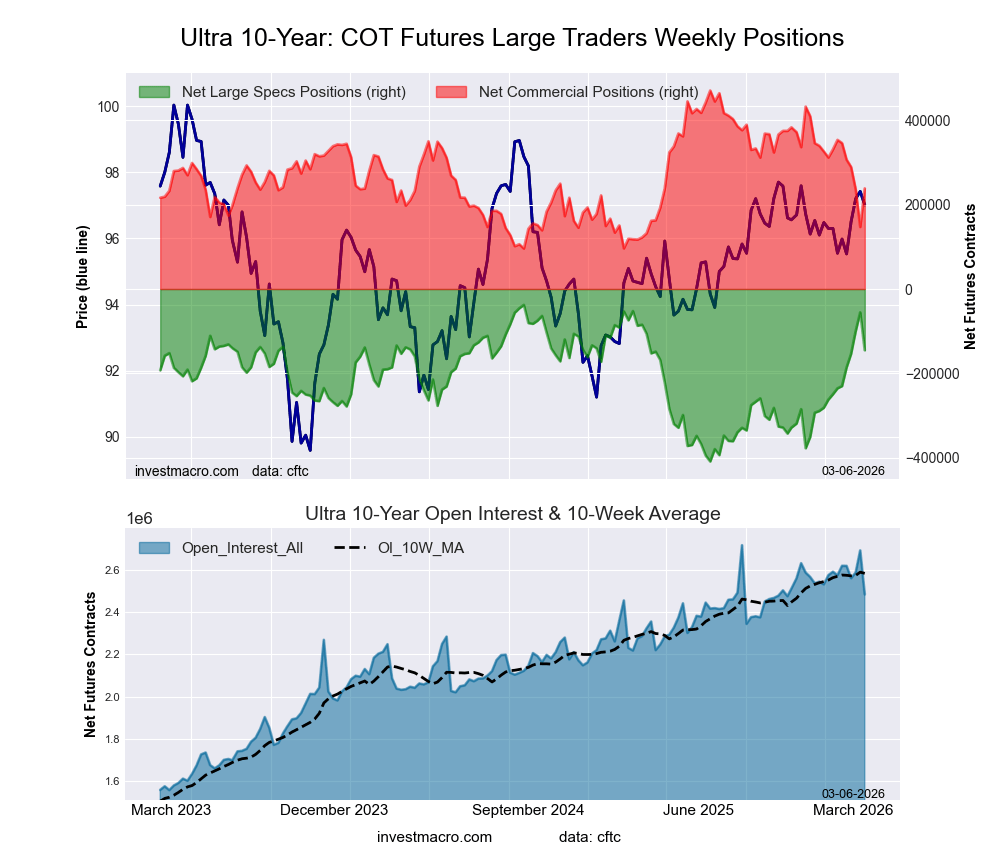
This week’s current strength score (the trader positioning range over the past three years, measured from 0 to 100) shows the speculators are currently Bullish with a score of 71.0 percent. The commercials are Bearish with a score of 38.1 percent and the small traders (not shown in chart) are Bearish with a score of 34.0 percent.
Our weekly trend-following model classifies the current market price position as: Weak Uptrend.
| Ultra 10-Year Notes Statistics | SPECULATORS | COMMERCIALS | SMALL TRADERS |
| – Percent of Open Interest Longs: | 9.8 | 78.5 | 9.6 |
| – Percent of Open Interest Shorts: | 15.6 | 68.9 | 13.3 |
| – Net Position: | -145,020 | 238,200 | -93,180 |
| – Gross Longs: | 243,446 | 1,948,642 | 237,999 |
| – Gross Shorts: | 388,466 | 1,710,442 | 331,179 |
| – Long to Short Ratio: | 0.6 to 1 | 1.1 to 1 | 0.7 to 1 |
| NET POSITION TREND: | |||
| – Strength Index Score (3 Year Range Pct): | 71.0 | 38.1 | 34.0 |
| – Strength Index Reading (3 Year Range): | Bullish | Bearish | Bearish |
| NET POSITION MOVEMENT INDEX: | |||
| – 6-Week Change in Strength Index: | 24.4 | -30.7 | 19.2 |
This week’s current strength score (the trader positioning range over the past three years, measured from 0 to 100) shows the speculators are currently Bullish-Extreme with a score of 90.4 percent. The commercials are Bearish-Extreme with a score of 3.3 percent and the small traders (not shown in chart) are Bullish-Extreme with a score of 80.5 percent.
Our weekly trend-following model classifies the current market price position as: Downtrend.
| US Treasury Bonds Statistics | SPECULATORS | COMMERCIALS | SMALL TRADERS |
| – Percent of Open Interest Longs: | 11.6 | 70.3 | 13.8 |
| – Percent of Open Interest Shorts: | 10.5 | 79.2 | 6.0 |
| – Net Position: | 20,265 | -163,455 | 143,190 |
| – Gross Longs: | 212,313 | 1,289,561 | 253,391 |
| – Gross Shorts: | 192,048 | 1,453,016 | 110,201 |
| – Long to Short Ratio: | 1.1 to 1 | 0.9 to 1 | 2.3 to 1 |
| NET POSITION TREND: | |||
| – Strength Index Score (3 Year Range Pct): | 90.4 | 3.3 | 80.5 |
| – Strength Index Reading (3 Year Range): | Bullish-Extreme | Bearish-Extreme | Bullish-Extreme |
| NET POSITION MOVEMENT INDEX: | |||
| – 6-Week Change in Strength Index: | 15.1 | -18.0 | 18.2 |
This week’s current strength score (the trader positioning range over the past three years, measured from 0 to 100) shows the speculators are currently Bullish with a score of 75.3 percent. The commercials are Bearish with a score of 34.8 percent and the small traders (not shown in chart) are Bearish with a score of 29.2 percent.
Our weekly trend-following model classifies the current market price position as: Downtrend.
| Ultra US Treasury Bonds Statistics | SPECULATORS | COMMERCIALS | SMALL TRADERS |
| – Percent of Open Interest Longs: | 6.8 | 83.5 | 8.4 |
| – Percent of Open Interest Shorts: | 18.3 | 72.6 | 7.8 |
| – Net Position: | -255,694 | 241,965 | 13,729 |
| – Gross Longs: | 152,514 | 1,860,020 | 187,508 |
| – Gross Shorts: | 408,208 | 1,618,055 | 173,779 |
| – Long to Short Ratio: | 0.4 to 1 | 1.1 to 1 | 1.1 to 1 |
| NET POSITION TREND: | |||
| – Strength Index Score (3 Year Range Pct): | 75.3 | 34.8 | 29.2 |
| – Strength Index Reading (3 Year Range): | Bullish | Bearish | Bearish |
| NET POSITION MOVEMENT INDEX: | |||
| – 6-Week Change in Strength Index: | 1.2 | -4.3 | 8.4 |
Article By InvestMacro – Receive our weekly COT Newsletter
*COT Report: The COT data, released weekly to the public each Friday, is updated through the most recent Tuesday (data is 3 days old) and shows a quick view of how large speculators or non-commercials (for-profit traders) were positioned in the futures markets.
The CFTC categorizes trader positions according to commercial hedgers (traders who use futures contracts for hedging as part of the business), non-commercials (large traders who speculate to realize trading profits) and nonreportable traders (usually small traders/speculators) as well as their open interest (contracts open in the market at time of reporting). See CFTC criteria here.
By InvestMacro Here are the latest charts and statistics for the Commitment of Traders (COT)…
By InvestMacro The latest update for the weekly Commitment of Traders (COT) report was released…
By InvestMacro Here are the latest charts and statistics for the Commitment of Traders (COT)…
By InvestMacro Here are the latest charts and statistics for the Commitment of Traders (COT)…
By InvestMacro Here are the latest charts and statistics for the Commitment of Traders (COT)…
By ForexTime FXTM’s USDInd ↑ 2% MTD Dollar best performing G10 currency MTD Geopolitical risk…
This website uses cookies.