By RoboForex Analytical Department
EUR/USD fell to 1.1919 on Friday. Despite this movement, the week ends with the US dollar experiencing its second consecutive decline. Pressure on the USD is driven by heightened geopolitical tensions and uncertainty about economic policy in Washington, which is reducing investor confidence in the dollar.
The focus is on recent statements by US President Donald Trump. He threatened tariffs against countries supplying oil to Cuba and also warned Iran of possible military strikes if it refused to sign a nuclear agreement. An additional source of uncertainty was Trump’s promise to announce the candidacy of a new Fed chair on Friday morning, following sustained pressure on Jerome Powell to cut rates more aggressively.
In parallel, the White House and Senate Democrats reached a preliminary agreement that avoids a government shutdown. This partially reduced short-term fiscal risks.
Earlier in the week, the dollar fell to levels not seen in almost four years after Trump expressed no concern about its weakening. Later, the US currency was supported by statements from US Treasury Secretary Scott Bessent, who remains committed to a strong dollar policy.
Free Reports:
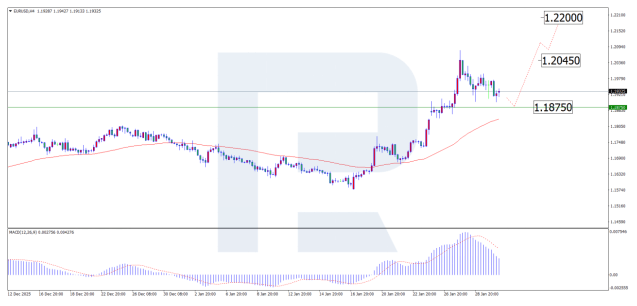
On the H4 chart, EUR/USD has formed a wave of growth towards 1.2080. A repeated breakdown of this resistance level may signal a continuation of the uptrend. At this stage, the pair is continuing the correction wave towards the support level of 1.1875. Technically, the correction scenario is confirmed by the MACD indicator, with its histogram and signal line both above zero, forming a downward wave. Upon completion of the correction, we anticipate the uptrend continuing towards 1.2045 and subsequently to 1.2200, with possible corrections along the way.
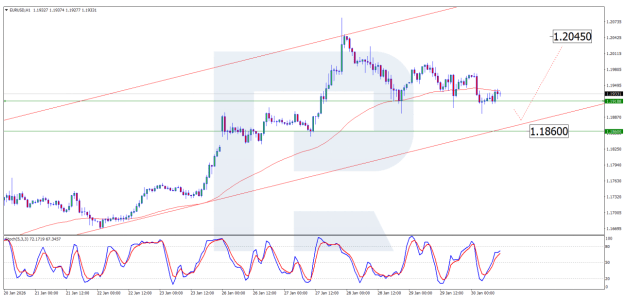
On the H1 chart, the pair is forming a correction after testing the resistance level. A rebound from the support level of 1.1860 would signal the formation of a new growth wave. The Stochastic oscillator’s signal lines are pointing towards level 80, suggesting the uptrend may continue. Subsequently, the target for growth may be 1.2045.
Conclusion
In summary, while the EUR/USD pair has experienced a corrective pullback, the fundamental backdrop of geopolitical tensions and policy uncertainty continues to weigh on the US dollar, underpinning the euro’s relative strength. Technically, the correction appears poised to complete near key support levels, with indicators on both the H4 and H1 timeframes suggesting a high probability of resuming the prevailing upward trend. The overall bias remains bullish for a potential test of higher resistance zones.
Disclaimer
Any forecasts contained herein are based on the author’s particular opinion. This analysis may not be treated as trading advice. RoboForex bears no responsibility for trading results based on trading recommendations and reviews contained herein.
By Analytical Department RoboForex GBP/USD enters the week of 10–14 August near 1.3500 – its…
By JustMarkets On Friday, US stock indices closed higher after labor‑market data came in worse…
By InvestMacro Here are the latest charts and statistics for the Commitment of Traders (COT)…
By InvestMacro The latest update for the weekly Commitment of Traders (COT) report was released…
By InvestMacro Here are the latest charts and statistics for the Commitment of Traders (COT)…
By InvestMacro Here are the latest charts and statistics for the Commitment of Traders (COT)…
This website uses cookies.