By InvestMacro
Here are the latest charts and statistics for the Commitment of Traders (COT) data published by the Commodities Futures Trading Commission (CFTC).
The latest COT data is updated through Tuesday September 16th and shows a quick view of how large market participants (for-profit speculators and commercial traders) were positioned in the futures markets. All currency positions are in direct relation to the US dollar where, for example, a bet for the euro is a bet that the euro will rise versus the dollar while a bet against the euro will be a bet that the euro will decline versus the dollar.
The COT currency market speculator bets were overall higher this week as seven out of the eleven currency markets we cover had higher positioning while the other four markets had lower speculator contracts.
Leading the gains for the currency markets was the Australian Dollar (28,071 contracts), the British Pound (27,025 contracts), the Brazilian Real (6,135 contracts), the Mexican Peso (4,261 contracts), the Swiss Franc (2,799 contracts), the Canadian Dollar (1,740 contracts) and Bitcoin (488 contracts) also showing positive weeks.
Free Reports:
The currencies seeing declines in speculator bets on the week were the Japanese Yen (-30,232 contracts), the New Zealand Dollar (-9,261 contracts), the US Dollar Index (-7,336 contracts) and with the EuroFX (-7,918 contracts) also registering lower bets on the week.
This week’s Currency Speculator positioning is highlighted by the number of big changes on the week. We had three currency positions changed by over 25,000 contracts and three others by 7,500 contracts or more.
Leading this week’s currency market price changes was the Brazilian Real, which advanced by 0.56%. The Real has now been up by approximately 2% over the last 30 days and is higher now by 5.86% over the past 90 days.
The Canadian Dollar comes up next with a 0.41% increase on the week. The ‘Loonie’ Dollar has turned positive over the past 90 days with a 1.41% rise. The Mexican Peso follows next with a 0.27% edge higher on the week. The Peso has advanced by approximately 6% over the past 90 days.
The U.S. Dollar Index edged up by 0.16% this week, followed by the Euro and the Swiss Franc, which were virtually unchanged but up by 0.09% each for the past 5 days.
The Japanese Yen dipped by -0.24% on the week, followed by the British Pound Sterling, which saw a slide by -0.67%. The Australian Dollar was lower by -0.84%, while Bitcoin declined by -1.20%. And finally, the New Zealand Dollar saw the largest shortfall on the week with a -1.68% decline.
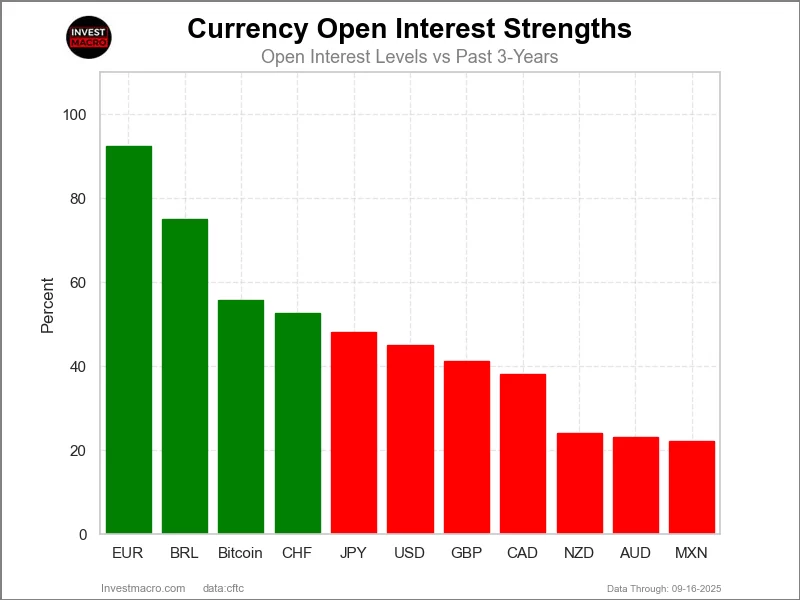
Legend: Open Interest | Speculators Current Net Position | Weekly Specs Change | Specs Strength Score compared to last 3-Years (0-100 range)
COT Strength Scores (a normalized measure of Speculator positions over a 3-Year range, from 0 to 100 where above 80 is Extreme-Bullish and below 20 is Extreme-Bearish) showed that the Brazilian Real (95 percent) and the EuroFX (74 percent) lead the currency markets this week. The Mexican Peso (69 percent), Japanese Yen (68 percent) and the Bitcoin (53 percent) come in as the next highest in the weekly strength scores.
On the downside, the US Dollar Index (0 percent) comes in at the lowest strength levels currently and are in Extreme-Bearish territory (below 20 percent). The next lowest strength scores is the British Pound (23 percent).
3-Year Strength Statistics:
US Dollar Index (0.0 percent) vs US Dollar Index previous week (16.1 percent)
EuroFX (73.6 percent) vs EuroFX previous week (76.6 percent)
British Pound Sterling (23.1 percent) vs British Pound Sterling previous week (9.1 percent)
Japanese Yen (67.6 percent) vs Japanese Yen previous week (75.9 percent)
Swiss Franc (48.1 percent) vs Swiss Franc previous week (42.5 percent)
Canadian Dollar (44.0 percent) vs Canadian Dollar previous week (43.1 percent)
Australian Dollar (40.0 percent) vs Australian Dollar previous week (20.1 percent)
New Zealand Dollar (43.7 percent) vs New Zealand Dollar previous week (54.4 percent)
Mexican Peso (68.5 percent) vs Mexican Peso previous week (66.4 percent)
Brazilian Real (95.0 percent) vs Brazilian Real previous week (90.1 percent)
Bitcoin (53.1 percent) vs Bitcoin previous week (42.8 percent)
COT Strength Score Trends (or move index, calculates the 6-week changes in strength scores) showed that Bitcoin (32 percent) and the Brazilian Real (31 percent) lead the past six weeks trends for the currencies. The Australian Dollar (23 percent), the British Pound (14 percent) and the Mexican Peso (5 percent) are the next highest positive movers in the 3-Year trends data.
The New Zealand Dollar (-15 percent) leads the downside trend scores currently with the Canadian Dollar (-14 percent), US Dollar Index (-13 percent) and the Japanese Yen (-6 percent) following next with lower trend scores.
3-Year Strength Trends:
US Dollar Index (-12.8 percent) vs US Dollar Index previous week (-3.1 percent)
EuroFX (0.7 percent) vs EuroFX previous week (0.9 percent)
British Pound Sterling (13.8 percent) vs British Pound Sterling previous week (-11.2 percent)
Japanese Yen (-5.7 percent) vs Japanese Yen previous week (0.7 percent)
Swiss Franc (2.7 percent) vs Swiss Franc previous week (-9.7 percent)
Canadian Dollar (-13.7 percent) vs Canadian Dollar previous week (-16.0 percent)
Australian Dollar (23.0 percent) vs Australian Dollar previous week (-0.8 percent)
New Zealand Dollar (-15.2 percent) vs New Zealand Dollar previous week (-7.7 percent)
Mexican Peso (5.1 percent) vs Mexican Peso previous week (8.7 percent)
Brazilian Real (30.5 percent) vs Brazilian Real previous week (26.1 percent)
Bitcoin (32.2 percent) vs Bitcoin previous week (11.4 percent)
This week’s current strength score (the trader positioning range over the past three years, measured from 0 to 100) shows the speculators are currently Bearish-Extreme with a score of 0.0 percent. The commercials are Bullish-Extreme with a score of 100.0 percent and the small traders (not shown in chart) are Bearish with a score of 21.6 percent.
Our weekly trend-following model classifies the current market price position as: Weak Downtrend.
| US DOLLAR INDEX Statistics | SPECULATORS | COMMERCIALS | SMALL TRADERS |
| – Percent of Open Interest Longs: | 32.4 | 54.4 | 7.2 |
| – Percent of Open Interest Shorts: | 65.9 | 19.3 | 8.9 |
| – Net Position: | -12,894 | 13,534 | -640 |
| – Gross Longs: | 12,491 | 20,961 | 2,776 |
| – Gross Shorts: | 25,385 | 7,427 | 3,416 |
| – Long to Short Ratio: | 0.5 to 1 | 2.8 to 1 | 0.8 to 1 |
| NET POSITION TREND: | |||
| – Strength Index Score (3 Year Range Pct): | 0.0 | 100.0 | 21.6 |
| – Strength Index Reading (3 Year Range): | Bearish-Extreme | Bullish-Extreme | Bearish |
| NET POSITION MOVEMENT INDEX: | |||
| – 6-Week Change in Strength Index: | -12.8 | 16.2 | -31.4 |
This week’s current strength score (the trader positioning range over the past three years, measured from 0 to 100) shows the speculators are currently Bullish with a score of 73.6 percent. The commercials are Bearish with a score of 24.2 percent and the small traders (not shown in chart) are Bullish with a score of 79.2 percent.
Our weekly trend-following model classifies the current market price position as: Uptrend.
| EURO Currency Statistics | SPECULATORS | COMMERCIALS | SMALL TRADERS |
| – Percent of Open Interest Longs: | 29.6 | 57.3 | 11.1 |
| – Percent of Open Interest Shorts: | 15.8 | 76.9 | 5.3 |
| – Net Position: | 117,759 | -167,380 | 49,621 |
| – Gross Longs: | 253,261 | 490,481 | 94,620 |
| – Gross Shorts: | 135,502 | 657,861 | 44,999 |
| – Long to Short Ratio: | 1.9 to 1 | 0.7 to 1 | 2.1 to 1 |
| NET POSITION TREND: | |||
| – Strength Index Score (3 Year Range Pct): | 73.6 | 24.2 | 79.2 |
| – Strength Index Reading (3 Year Range): | Bullish | Bearish | Bullish |
| NET POSITION MOVEMENT INDEX: | |||
| – 6-Week Change in Strength Index: | 0.7 | -1.3 | 4.3 |
This week’s current strength score (the trader positioning range over the past three years, measured from 0 to 100) shows the speculators are currently Bearish with a score of 23.1 percent. The commercials are Bullish with a score of 63.9 percent and the small traders (not shown in chart) are Bullish-Extreme with a score of 86.7 percent.
Our weekly trend-following model classifies the current market price position as: Weak Uptrend.
| BRITISH POUND Statistics | SPECULATORS | COMMERCIALS | SMALL TRADERS |
| – Percent of Open Interest Longs: | 34.5 | 48.0 | 15.9 |
| – Percent of Open Interest Shorts: | 37.3 | 50.2 | 10.9 |
| – Net Position: | -6,580 | -5,099 | 11,679 |
| – Gross Longs: | 80,796 | 112,620 | 37,259 |
| – Gross Shorts: | 87,376 | 117,719 | 25,580 |
| – Long to Short Ratio: | 0.9 to 1 | 1.0 to 1 | 1.5 to 1 |
| NET POSITION TREND: | |||
| – Strength Index Score (3 Year Range Pct): | 23.1 | 63.9 | 86.7 |
| – Strength Index Reading (3 Year Range): | Bearish | Bullish | Bullish-Extreme |
| NET POSITION MOVEMENT INDEX: | |||
| – 6-Week Change in Strength Index: | 13.8 | -16.2 | 23.2 |
This week’s current strength score (the trader positioning range over the past three years, measured from 0 to 100) shows the speculators are currently Bullish with a score of 67.6 percent. The commercials are Bearish with a score of 33.7 percent and the small traders (not shown in chart) are Bullish with a score of 58.8 percent.
Our weekly trend-following model classifies the current market price position as: Downtrend.
| JAPANESE YEN Statistics | SPECULATORS | COMMERCIALS | SMALL TRADERS |
| – Percent of Open Interest Longs: | 54.0 | 31.8 | 13.5 |
| – Percent of Open Interest Shorts: | 33.5 | 54.6 | 11.2 |
| – Net Position: | 61,411 | -68,338 | 6,927 |
| – Gross Longs: | 161,673 | 95,157 | 40,523 |
| – Gross Shorts: | 100,262 | 163,495 | 33,596 |
| – Long to Short Ratio: | 1.6 to 1 | 0.6 to 1 | 1.2 to 1 |
| NET POSITION TREND: | |||
| – Strength Index Score (3 Year Range Pct): | 67.6 | 33.7 | 58.8 |
| – Strength Index Reading (3 Year Range): | Bullish | Bearish | Bullish |
| NET POSITION MOVEMENT INDEX: | |||
| – 6-Week Change in Strength Index: | -5.7 | 4.8 | 3.7 |
This week’s current strength score (the trader positioning range over the past three years, measured from 0 to 100) shows the speculators are currently Bearish with a score of 48.1 percent. The commercials are Bearish with a score of 45.5 percent and the small traders (not shown in chart) are Bullish with a score of 69.6 percent.
Our weekly trend-following model classifies the current market price position as: Uptrend.
| SWISS FRANC Statistics | SPECULATORS | COMMERCIALS | SMALL TRADERS |
| – Percent of Open Interest Longs: | 8.7 | 68.9 | 21.8 |
| – Percent of Open Interest Shorts: | 45.0 | 29.6 | 24.8 |
| – Net Position: | -26,040 | 28,198 | -2,158 |
| – Gross Longs: | 6,235 | 49,405 | 15,606 |
| – Gross Shorts: | 32,275 | 21,207 | 17,764 |
| – Long to Short Ratio: | 0.2 to 1 | 2.3 to 1 | 0.9 to 1 |
| NET POSITION TREND: | |||
| – Strength Index Score (3 Year Range Pct): | 48.1 | 45.5 | 69.6 |
| – Strength Index Reading (3 Year Range): | Bearish | Bearish | Bullish |
| NET POSITION MOVEMENT INDEX: | |||
| – 6-Week Change in Strength Index: | 2.7 | -8.0 | 15.2 |
This week’s current strength score (the trader positioning range over the past three years, measured from 0 to 100) shows the speculators are currently Bearish with a score of 44.0 percent. The commercials are Bullish with a score of 60.5 percent and the small traders (not shown in chart) are Bearish with a score of 23.9 percent.
Our weekly trend-following model classifies the current market price position as: Strong Downtrend.
| CANADIAN DOLLAR Statistics | SPECULATORS | COMMERCIALS | SMALL TRADERS |
| – Percent of Open Interest Longs: | 7.9 | 82.1 | 8.5 |
| – Percent of Open Interest Shorts: | 48.0 | 39.3 | 11.1 |
| – Net Position: | -107,177 | 114,181 | -7,004 |
| – Gross Longs: | 20,975 | 218,993 | 22,611 |
| – Gross Shorts: | 128,152 | 104,812 | 29,615 |
| – Long to Short Ratio: | 0.2 to 1 | 2.1 to 1 | 0.8 to 1 |
| NET POSITION TREND: | |||
| – Strength Index Score (3 Year Range Pct): | 44.0 | 60.5 | 23.9 |
| – Strength Index Reading (3 Year Range): | Bearish | Bullish | Bearish |
| NET POSITION MOVEMENT INDEX: | |||
| – 6-Week Change in Strength Index: | -13.7 | 12.9 | -4.4 |
This week’s current strength score (the trader positioning range over the past three years, measured from 0 to 100) shows the speculators are currently Bearish with a score of 40.0 percent. The commercials are Bullish with a score of 54.2 percent and the small traders (not shown in chart) are Bullish with a score of 76.8 percent.
Our weekly trend-following model classifies the current market price position as: Strong Uptrend.
| AUSTRALIAN DOLLAR Statistics | SPECULATORS | COMMERCIALS | SMALL TRADERS |
| – Percent of Open Interest Longs: | 26.0 | 53.0 | 19.3 |
| – Percent of Open Interest Shorts: | 59.1 | 26.8 | 12.5 |
| – Net Position: | -51,160 | 40,651 | 10,509 |
| – Gross Longs: | 40,276 | 82,083 | 29,912 |
| – Gross Shorts: | 91,436 | 41,432 | 19,403 |
| – Long to Short Ratio: | 0.4 to 1 | 2.0 to 1 | 1.5 to 1 |
| NET POSITION TREND: | |||
| – Strength Index Score (3 Year Range Pct): | 40.0 | 54.2 | 76.8 |
| – Strength Index Reading (3 Year Range): | Bearish | Bullish | Bullish |
| NET POSITION MOVEMENT INDEX: | |||
| – 6-Week Change in Strength Index: | 23.0 | -25.0 | 25.0 |
This week’s current strength score (the trader positioning range over the past three years, measured from 0 to 100) shows the speculators are currently Bearish with a score of 43.7 percent. The commercials are Bullish with a score of 56.0 percent and the small traders (not shown in chart) are Bearish with a score of 34.0 percent.
Our weekly trend-following model classifies the current market price position as: Downtrend.
| NEW ZEALAND DOLLAR Statistics | SPECULATORS | COMMERCIALS | SMALL TRADERS |
| – Percent of Open Interest Longs: | 18.8 | 70.5 | 7.4 |
| – Percent of Open Interest Shorts: | 55.5 | 31.0 | 10.3 |
| – Net Position: | -18,004 | 19,416 | -1,412 |
| – Gross Longs: | 9,251 | 34,634 | 3,655 |
| – Gross Shorts: | 27,255 | 15,218 | 5,067 |
| – Long to Short Ratio: | 0.3 to 1 | 2.3 to 1 | 0.7 to 1 |
| NET POSITION TREND: | |||
| – Strength Index Score (3 Year Range Pct): | 43.7 | 56.0 | 34.0 |
| – Strength Index Reading (3 Year Range): | Bearish | Bullish | Bearish |
| NET POSITION MOVEMENT INDEX: | |||
| – 6-Week Change in Strength Index: | -15.2 | 14.9 | -1.1 |
This week’s current strength score (the trader positioning range over the past three years, measured from 0 to 100) shows the speculators are currently Bullish with a score of 68.5 percent. The commercials are Bearish with a score of 31.7 percent and the small traders (not shown in chart) are Bearish with a score of 49.1 percent.
Our weekly trend-following model classifies the current market price position as: Uptrend.
| MEXICAN PESO Statistics | SPECULATORS | COMMERCIALS | SMALL TRADERS |
| – Percent of Open Interest Longs: | 61.7 | 34.0 | 4.1 |
| – Percent of Open Interest Shorts: | 18.9 | 79.5 | 1.5 |
| – Net Position: | 77,993 | -82,741 | 4,748 |
| – Gross Longs: | 112,395 | 61,957 | 7,553 |
| – Gross Shorts: | 34,402 | 144,698 | 2,805 |
| – Long to Short Ratio: | 3.3 to 1 | 0.4 to 1 | 2.7 to 1 |
| NET POSITION TREND: | |||
| – Strength Index Score (3 Year Range Pct): | 68.5 | 31.7 | 49.1 |
| – Strength Index Reading (3 Year Range): | Bullish | Bearish | Bearish |
| NET POSITION MOVEMENT INDEX: | |||
| – 6-Week Change in Strength Index: | 5.1 | -5.7 | 6.2 |
This week’s current strength score (the trader positioning range over the past three years, measured from 0 to 100) shows the speculators are currently Bullish-Extreme with a score of 95.0 percent. The commercials are Bearish-Extreme with a score of 3.9 percent and the small traders (not shown in chart) are Bearish with a score of 40.8 percent.
Our weekly trend-following model classifies the current market price position as: Strong Uptrend.
| BRAZIL REAL Statistics | SPECULATORS | COMMERCIALS | SMALL TRADERS |
| – Percent of Open Interest Longs: | 60.6 | 31.4 | 3.7 |
| – Percent of Open Interest Shorts: | 8.8 | 86.1 | 0.8 |
| – Net Position: | 62,222 | -65,752 | 3,530 |
| – Gross Longs: | 72,832 | 37,805 | 4,483 |
| – Gross Shorts: | 10,610 | 103,557 | 953 |
| – Long to Short Ratio: | 6.9 to 1 | 0.4 to 1 | 4.7 to 1 |
| NET POSITION TREND: | |||
| – Strength Index Score (3 Year Range Pct): | 95.0 | 3.9 | 40.8 |
| – Strength Index Reading (3 Year Range): | Bullish-Extreme | Bearish-Extreme | Bearish |
| NET POSITION MOVEMENT INDEX: | |||
| – 6-Week Change in Strength Index: | 30.5 | -30.4 | 1.7 |
This week’s current strength score (the trader positioning range over the past three years, measured from 0 to 100) shows the speculators are currently Bullish with a score of 53.1 percent. The commercials are Bearish with a score of 46.5 percent and the small traders (not shown in chart) are Bullish with a score of 59.8 percent.
Our weekly trend-following model classifies the current market price position as: Uptrend.
| BITCOIN Statistics | SPECULATORS | COMMERCIALS | SMALL TRADERS |
| – Percent of Open Interest Longs: | 82.5 | 4.0 | 4.6 |
| – Percent of Open Interest Shorts: | 82.4 | 5.6 | 3.1 |
| – Net Position: | 20 | -453 | 433 |
| – Gross Longs: | 23,788 | 1,151 | 1,323 |
| – Gross Shorts: | 23,768 | 1,604 | 890 |
| – Long to Short Ratio: | 1.0 to 1 | 0.7 to 1 | 1.5 to 1 |
| NET POSITION TREND: | |||
| – Strength Index Score (3 Year Range Pct): | 53.1 | 46.5 | 59.8 |
| – Strength Index Reading (3 Year Range): | Bullish | Bearish | Bullish |
| NET POSITION MOVEMENT INDEX: | |||
| – 6-Week Change in Strength Index: | 32.2 | -36.7 | 6.6 |
Article By InvestMacro – Receive our weekly COT Newsletter
*COT Report: The COT data, released weekly to the public each Friday, is updated through the most recent Tuesday (data is 3 days old) and shows a quick view of how large speculators or non-commercials (for-profit traders) were positioned in the futures markets.
The CFTC categorizes trader positions according to commercial hedgers (traders who use futures contracts for hedging as part of the business), non-commercials (large traders who speculate to realize trading profits) and nonreportable traders (usually small traders/speculators) as well as their open interest (contracts open in the market at time of reporting). See CFTC criteria here.
By InvestMacro Here are the latest charts and statistics for the Commitment of Traders (COT)…
By InvestMacro The latest update for the weekly Commitment of Traders (COT) report was released…
By InvestMacro Here are the latest charts and statistics for the Commitment of Traders (COT)…
By InvestMacro Here are the latest charts and statistics for the Commitment of Traders (COT)…
By InvestMacro Here are the latest charts and statistics for the Commitment of Traders (COT)…
By InvestMacro Here are the latest charts and statistics for the Commitment of Traders (COT)…
This website uses cookies.