By InvestMacro
Here are the latest charts and statistics for the Commitment of Traders (COT) data published by the Commodities Futures Trading Commission (CFTC).
The latest COT data is updated through Tuesday August 12th and shows a quick view of how large traders (for-profit speculators and commercial entities) were positioned in the futures markets.
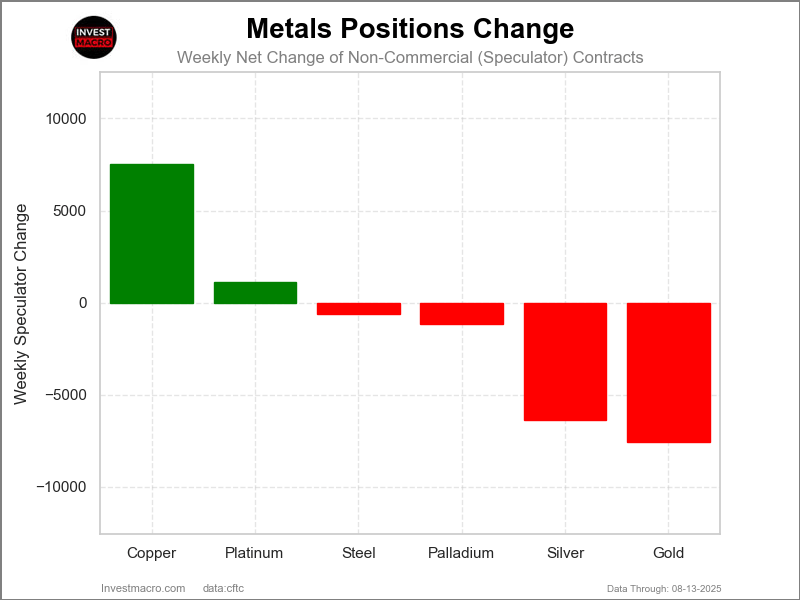
The COT metals markets speculator bets were overall lower this week as just two out of the six metals markets we cover had higher positioning while the other four markets had lower speculator contracts.
Leading the gains for the metals was Copper (7,525 contracts) with Platinum (1,126 contracts) also showing a positive week.
The markets with declines in speculator bets for the week were Gold (-7,565 contracts), Silver (-6,390 contracts), Palladium (-1,161 contracts) and with Steel (-626 contracts) also seeing lower bets on the week.
Free Reports:
Weekly Metals Performance
The metals markets on the week were mostly lower as 4 out of the 6 markets saw declining prices. Platinum led the week with a 0.58% increase, while Copper rose by 0.54%. Palladium was lower by -0.5%, Silver was down by -1.09% and Gold was down by -1.80%. Steel was the biggest loser on the week with a -3.33% decrease.
In the longer term, over the last 90 days, all these markets are higher, with Copper seeing just a 4.65% rise and is the smallest gainer over 90 days. Palladium, Silver, and Steel are all up by over 20% in the last 90 days, while Gold is up by 12.32%. Platinum is the biggest mover over the last 90 days with a gain of 42.67%.
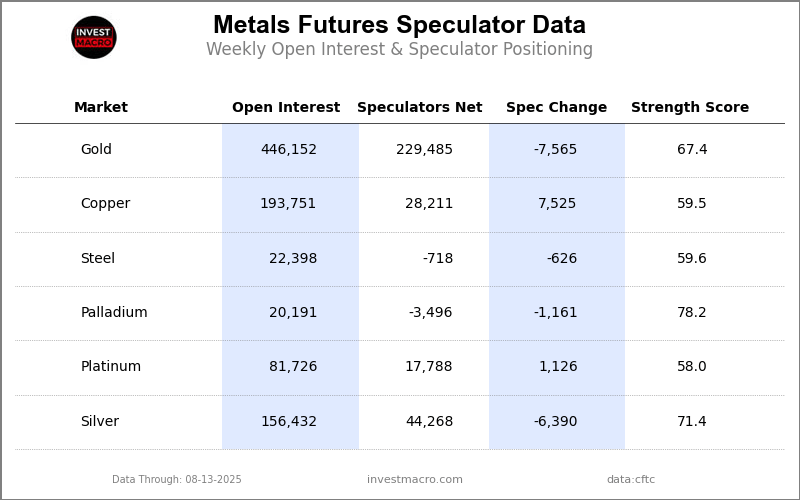
Legend: Weekly Speculators Change | Speculators Current Net Position | Speculators Strength Score compared to last 3-Years (0-100 range)
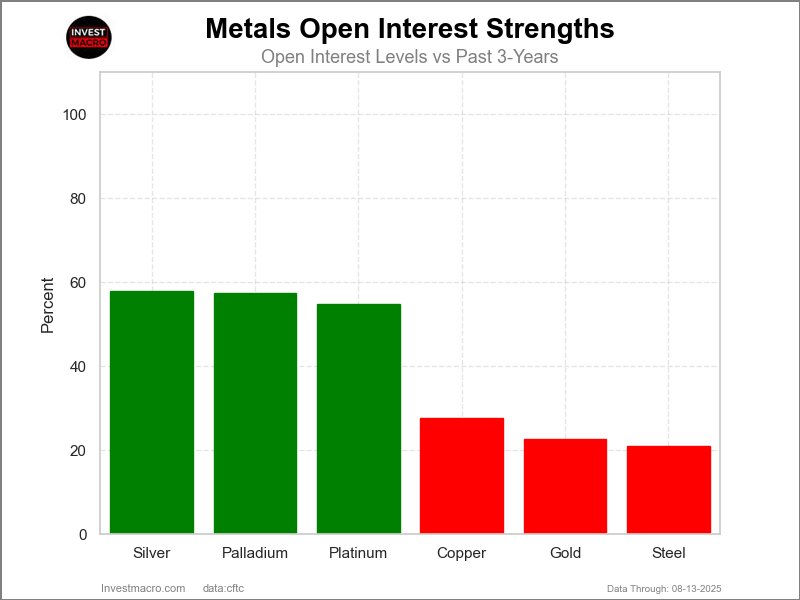
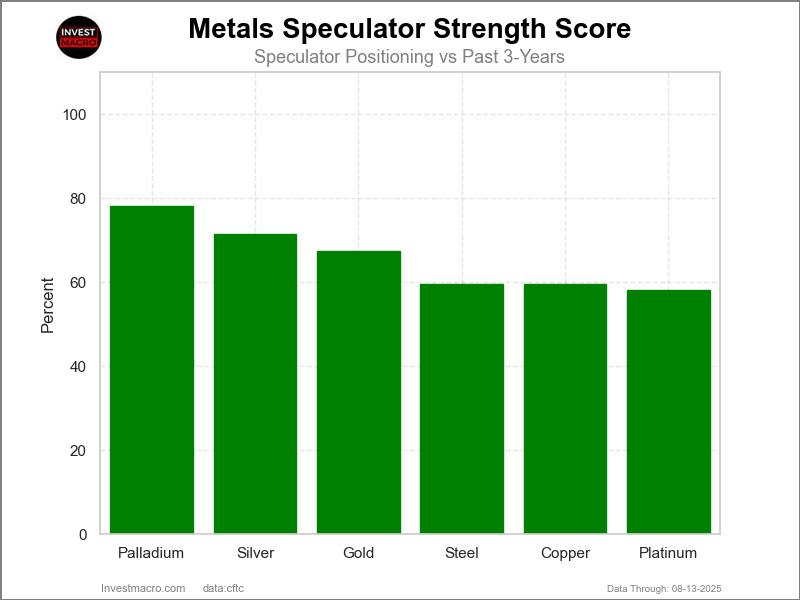
COT Strength Scores (a normalized measure of Speculator positions over a 3-Year range, from 0 to 100 where above 80 is Extreme-Bullish and below 20 is Extreme-Bearish) showed that Palladium (78 percent) and Silver (71 percent) lead the metals markets this week. Gold (67 percent) comes in as the next highest in the weekly strength scores.
Strength Statistics:
Gold (67.4 percent) vs Gold previous week (70.2 percent)
Silver (71.4 percent) vs Silver previous week (79.3 percent)
Copper (59.5 percent) vs Copper previous week (52.5 percent)
Platinum (58.0 percent) vs Platinum previous week (55.4 percent)
Palladium (78.2 percent) vs Palladium previous week (86.9 percent)
Steel (59.6 percent) vs Palladium previous week (64.0 percent)
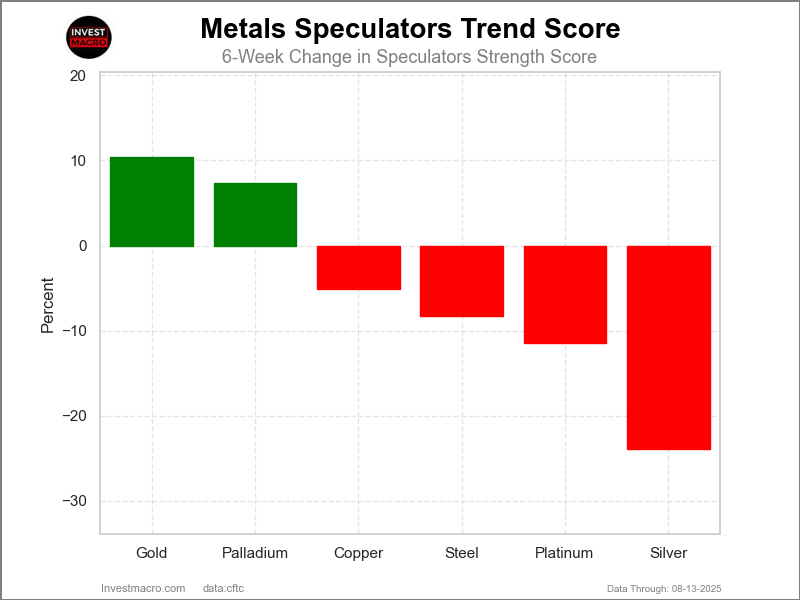
COT Strength Score Trends (or move index, calculates the 6-week changes in strength scores) showed that Gold (10 percent) and Palladium (7 percent) lead the past six weeks trends for metals.
Silver (-24 percent) leads the downside trend scores currently with Platinum (-11 percent) as the next market with lower trend scores.
Move Statistics:
Gold (10.4 percent) vs Gold previous week (16.0 percent)
Silver (-23.9 percent) vs Silver previous week (-15.4 percent)
Copper (-5.1 percent) vs Copper previous week (-8.1 percent)
Platinum (-11.5 percent) vs Platinum previous week (-20.2 percent)
Palladium (7.4 percent) vs Palladium previous week (16.3 percent)
Steel (-8.3 percent) vs Steel previous week (6.8 percent)
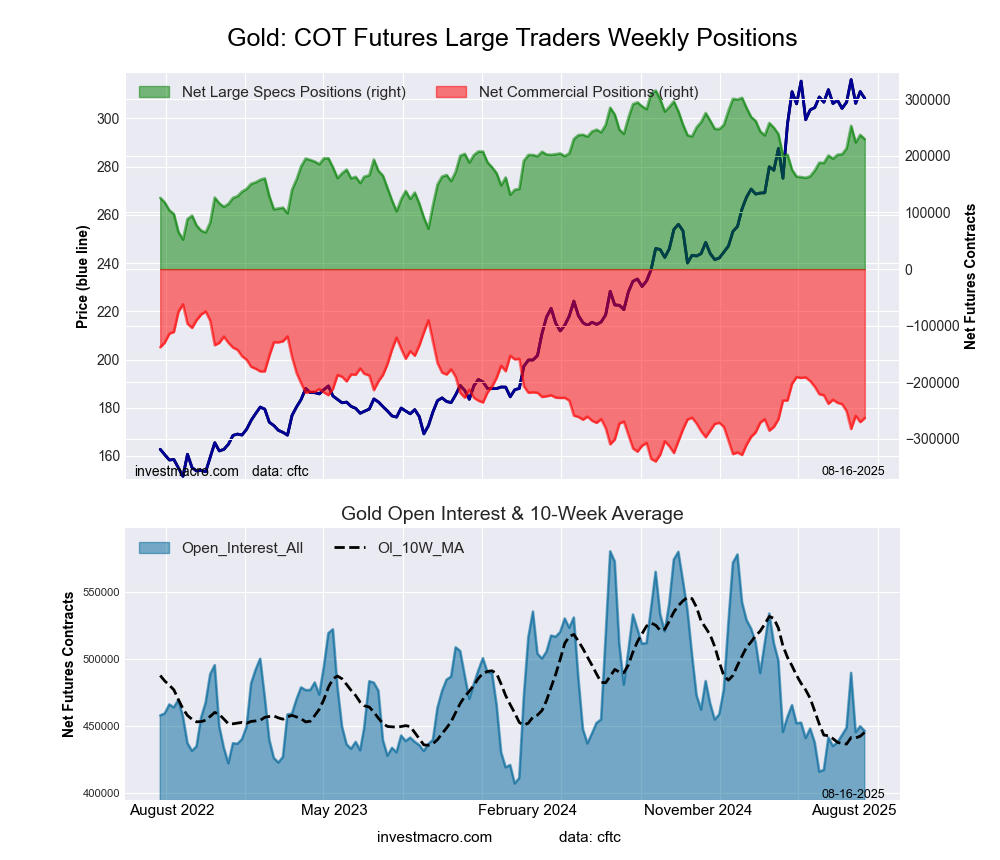
This week’s current strength score (the trader positioning range over the past three years, measured from 0 to 100) shows the speculators are currently Bullish with a score of 67.4 percent. The commercials are Bearish with a score of 27.6 percent and the small traders (not shown in chart) are Bullish-Extreme with a score of 86.5 percent.
Our weekly trend-following model classifies the current market price position as: Uptrend.
| Gold Futures Statistics | SPECULATORS | COMMERCIALS | SMALL TRADERS |
| – Percent of Open Interest Longs: | 64.6 | 14.2 | 12.0 |
| – Percent of Open Interest Shorts: | 13.1 | 73.2 | 4.5 |
| – Net Position: | 229,485 | -263,065 | 33,580 |
| – Gross Longs: | 288,115 | 63,427 | 53,656 |
| – Gross Shorts: | 58,630 | 326,492 | 20,076 |
| – Long to Short Ratio: | 4.9 to 1 | 0.2 to 1 | 2.7 to 1 |
| NET POSITION TREND: | |||
| – Strength Index Score (3 Year Range Pct): | 67.4 | 27.6 | 86.5 |
| – Strength Index Reading (3 Year Range): | Bullish | Bearish | Bullish-Extreme |
| NET POSITION MOVEMENT INDEX: | |||
| – 6-Week Change in Strength Index: | 10.4 | -9.7 | -1.7 |
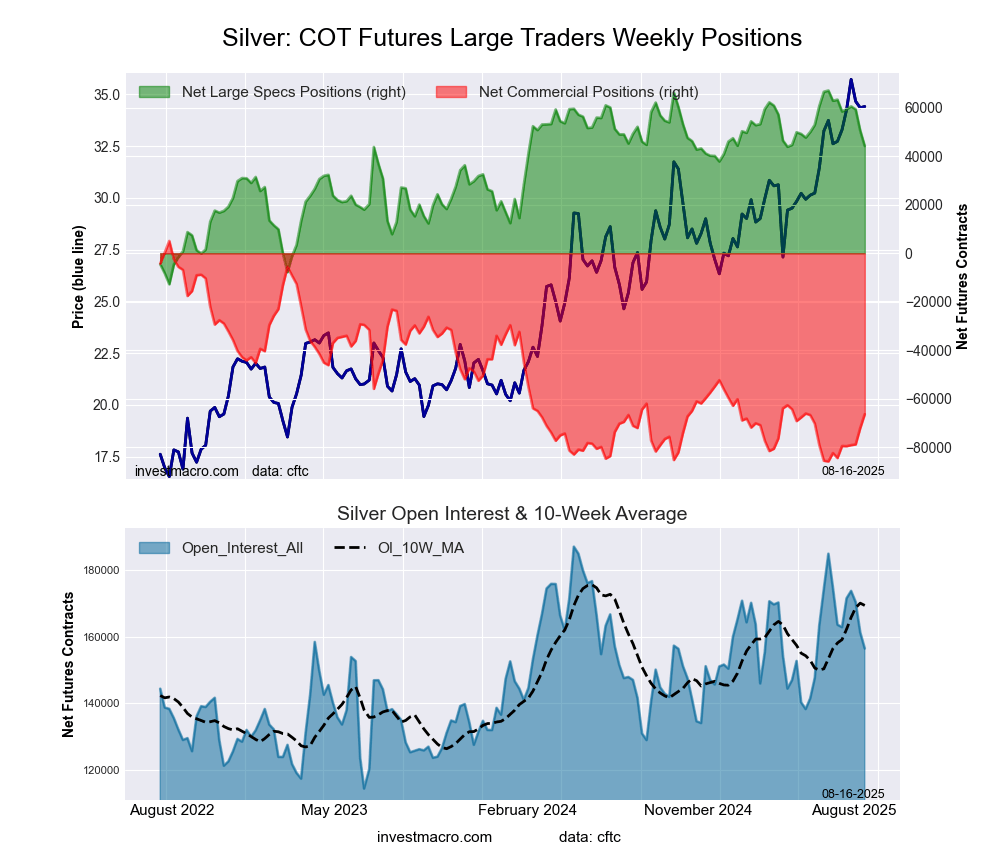
This week’s current strength score (the trader positioning range over the past three years, measured from 0 to 100) shows the speculators are currently Bullish with a score of 71.4 percent. The commercials are Bearish with a score of 21.5 percent and the small traders (not shown in chart) are Bullish with a score of 77.9 percent.
Our weekly trend-following model classifies the current market price position as: Uptrend.
| Silver Futures Statistics | SPECULATORS | COMMERCIALS | SMALL TRADERS |
| – Percent of Open Interest Longs: | 42.4 | 26.4 | 20.9 |
| – Percent of Open Interest Shorts: | 14.1 | 68.9 | 6.7 |
| – Net Position: | 44,268 | -66,421 | 22,153 |
| – Gross Longs: | 66,252 | 41,331 | 32,647 |
| – Gross Shorts: | 21,984 | 107,752 | 10,494 |
| – Long to Short Ratio: | 3.0 to 1 | 0.4 to 1 | 3.1 to 1 |
| NET POSITION TREND: | |||
| – Strength Index Score (3 Year Range Pct): | 71.4 | 21.5 | 77.9 |
| – Strength Index Reading (3 Year Range): | Bullish | Bearish | Bullish |
| NET POSITION MOVEMENT INDEX: | |||
| – 6-Week Change in Strength Index: | -23.9 | 19.9 | 4.9 |
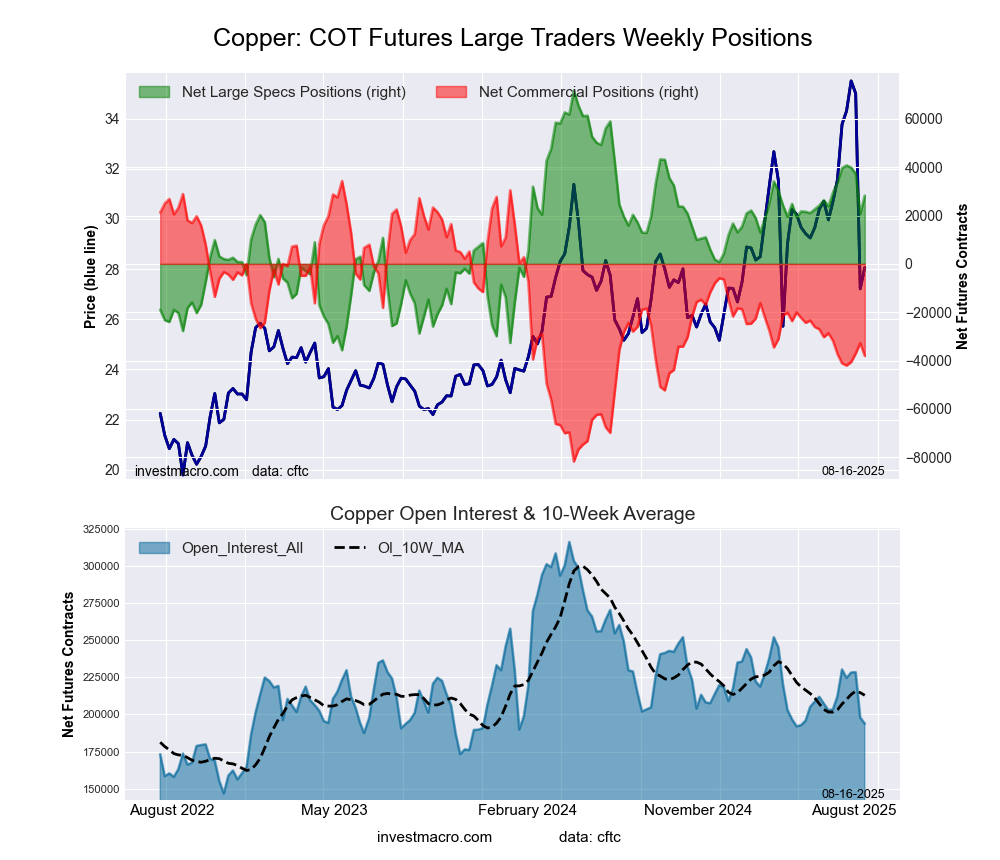
This week’s current strength score (the trader positioning range over the past three years, measured from 0 to 100) shows the speculators are currently Bullish with a score of 59.5 percent. The commercials are Bearish with a score of 37.7 percent and the small traders (not shown in chart) are Bullish with a score of 77.2 percent.
Our weekly trend-following model classifies the current market price position as: Weak Uptrend.
| Copper Futures Statistics | SPECULATORS | COMMERCIALS | SMALL TRADERS |
| – Percent of Open Interest Longs: | 30.3 | 33.0 | 9.8 |
| – Percent of Open Interest Shorts: | 15.8 | 52.6 | 4.7 |
| – Net Position: | 28,211 | -38,033 | 9,822 |
| – Gross Longs: | 58,802 | 63,855 | 19,016 |
| – Gross Shorts: | 30,591 | 101,888 | 9,194 |
| – Long to Short Ratio: | 1.9 to 1 | 0.6 to 1 | 2.1 to 1 |
| NET POSITION TREND: | |||
| – Strength Index Score (3 Year Range Pct): | 59.5 | 37.7 | 77.2 |
| – Strength Index Reading (3 Year Range): | Bullish | Bearish | Bullish |
| NET POSITION MOVEMENT INDEX: | |||
| – 6-Week Change in Strength Index: | -5.1 | -0.6 | 37.7 |
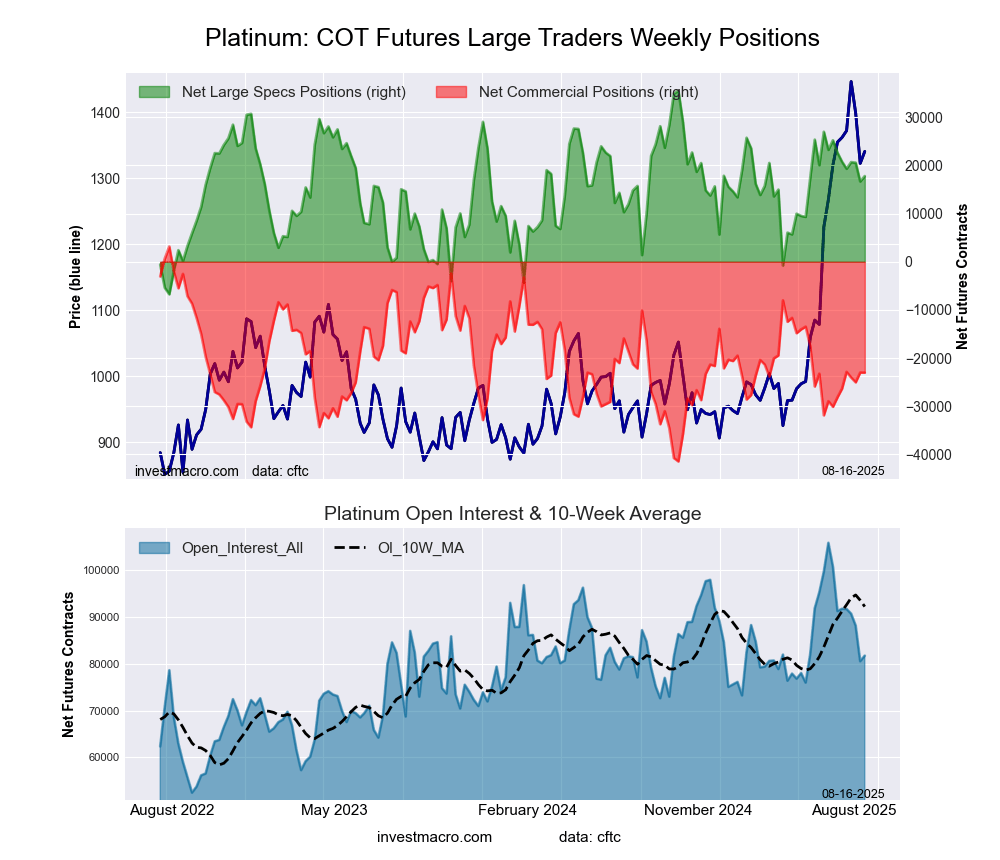
This week’s current strength score (the trader positioning range over the past three years, measured from 0 to 100) shows the speculators are currently Bullish with a score of 58.0 percent. The commercials are Bearish with a score of 41.3 percent and the small traders (not shown in chart) are Bullish with a score of 58.8 percent.
Our weekly trend-following model classifies the current market price position as: Uptrend.
| Platinum Futures Statistics | SPECULATORS | COMMERCIALS | SMALL TRADERS |
| – Percent of Open Interest Longs: | 58.1 | 19.1 | 11.8 |
| – Percent of Open Interest Shorts: | 36.3 | 47.2 | 5.4 |
| – Net Position: | 17,788 | -23,015 | 5,227 |
| – Gross Longs: | 47,458 | 15,571 | 9,606 |
| – Gross Shorts: | 29,670 | 38,586 | 4,379 |
| – Long to Short Ratio: | 1.6 to 1 | 0.4 to 1 | 2.2 to 1 |
| NET POSITION TREND: | |||
| – Strength Index Score (3 Year Range Pct): | 58.0 | 41.3 | 58.8 |
| – Strength Index Reading (3 Year Range): | Bullish | Bearish | Bullish |
| NET POSITION MOVEMENT INDEX: | |||
| – 6-Week Change in Strength Index: | -11.5 | 11.5 | -3.1 |
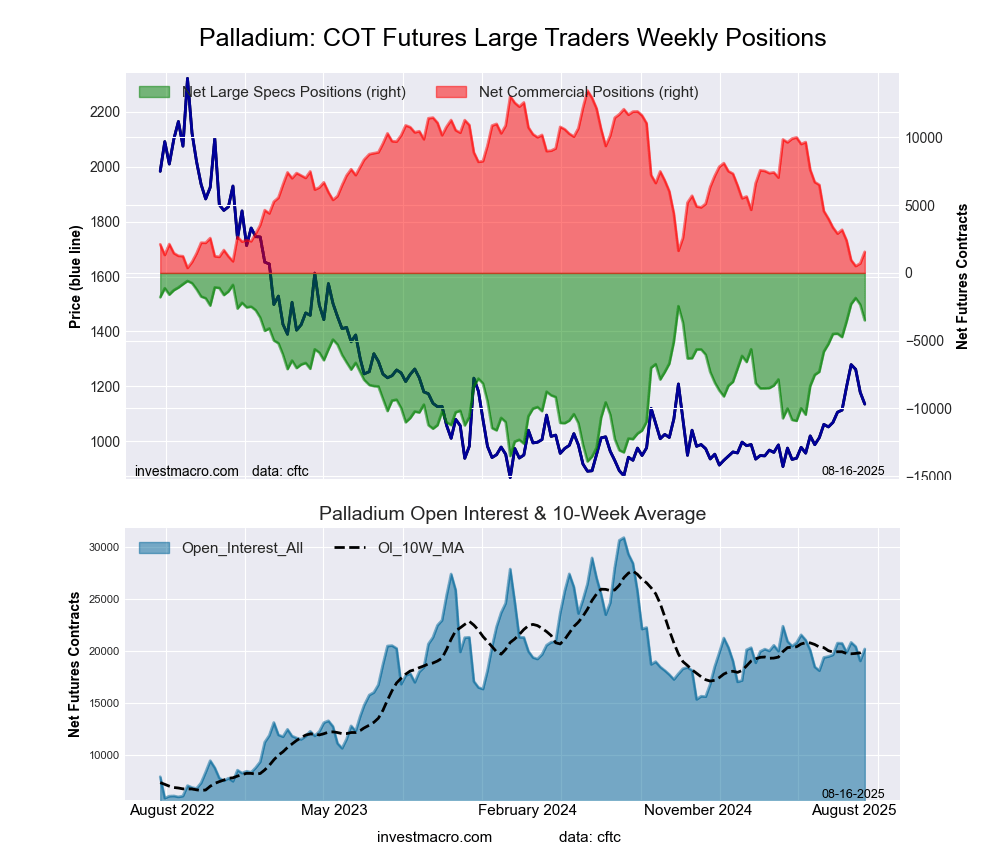
This week’s current strength score (the trader positioning range over the past three years, measured from 0 to 100) shows the speculators are currently Bullish with a score of 78.2 percent. The commercials are Bearish-Extreme with a score of 9.1 percent and the small traders (not shown in chart) are Bullish-Extreme with a score of 100.0 percent.
Our weekly trend-following model classifies the current market price position as: Uptrend.
| Palladium Futures Statistics | SPECULATORS | COMMERCIALS | SMALL TRADERS |
| – Percent of Open Interest Longs: | 39.6 | 34.1 | 15.1 |
| – Percent of Open Interest Shorts: | 57.0 | 26.4 | 5.5 |
| – Net Position: | -3,496 | 1,558 | 1,938 |
| – Gross Longs: | 8,005 | 6,891 | 3,049 |
| – Gross Shorts: | 11,501 | 5,333 | 1,111 |
| – Long to Short Ratio: | 0.7 to 1 | 1.3 to 1 | 2.7 to 1 |
| NET POSITION TREND: | |||
| – Strength Index Score (3 Year Range Pct): | 78.2 | 9.1 | 100.0 |
| – Strength Index Reading (3 Year Range): | Bullish | Bearish-Extreme | Bullish-Extreme |
| NET POSITION MOVEMENT INDEX: | |||
| – 6-Week Change in Strength Index: | 7.4 | -10.2 | 14.0 |
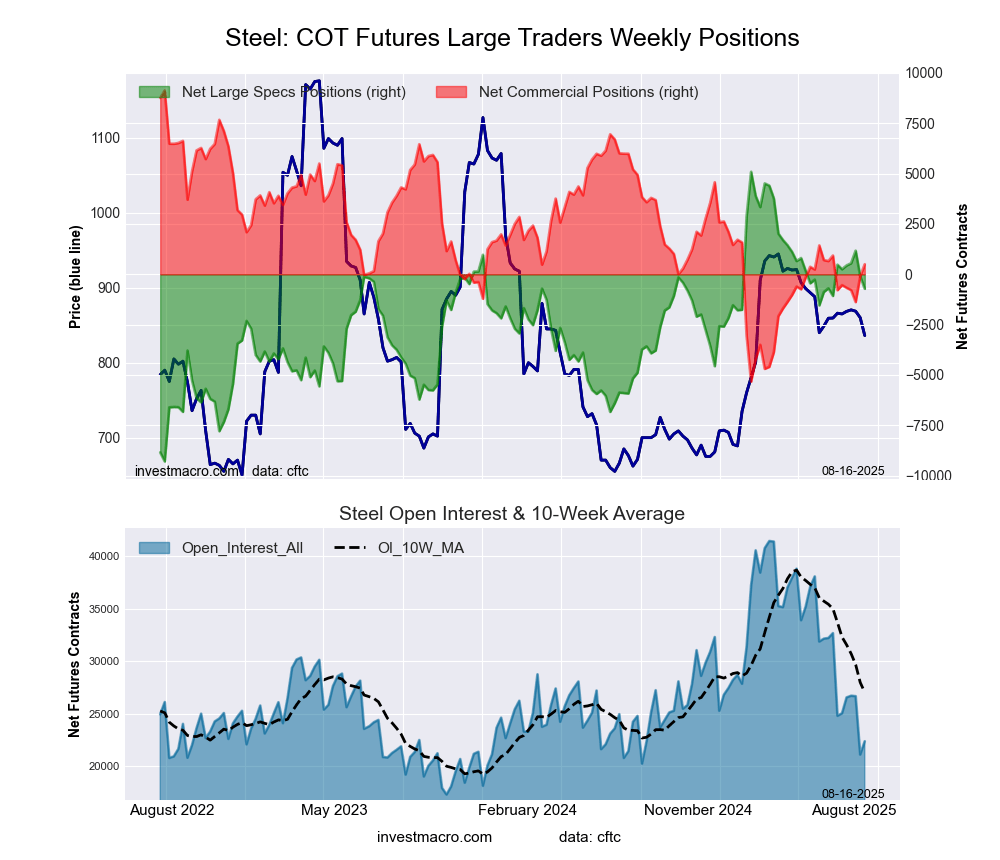
This week’s current strength score (the trader positioning range over the past three years, measured from 0 to 100) shows the speculators are currently Bullish with a score of 59.6 percent. The commercials are Bearish with a score of 40.3 percent and the small traders (not shown in chart) are Bullish with a score of 63.6 percent.
Our weekly trend-following model classifies the current market price position as: Strong Downtrend.
| Steel Futures Statistics | SPECULATORS | COMMERCIALS | SMALL TRADERS |
| – Percent of Open Interest Longs: | 18.0 | 77.3 | 2.0 |
| – Percent of Open Interest Shorts: | 21.2 | 75.0 | 1.0 |
| – Net Position: | -718 | 501 | 217 |
| – Gross Longs: | 4,023 | 17,306 | 444 |
| – Gross Shorts: | 4,741 | 16,805 | 227 |
| – Long to Short Ratio: | 0.8 to 1 | 1.0 to 1 | 2.0 to 1 |
| NET POSITION TREND: | |||
| – Strength Index Score (3 Year Range Pct): | 59.6 | 40.3 | 63.6 |
| – Strength Index Reading (3 Year Range): | Bullish | Bearish | Bullish |
| NET POSITION MOVEMENT INDEX: | |||
| – 6-Week Change in Strength Index: | -8.3 | 8.9 | -11.8 |
Article By InvestMacro – Receive our weekly COT Newsletter
*COT Report: The COT data, released weekly to the public each Friday, is updated through the most recent Tuesday (data is 3 days old) and shows a quick view of how large speculators or non-commercials (for-profit traders) were positioned in the futures markets.
The CFTC categorizes trader positions according to commercial hedgers (traders who use futures contracts for hedging as part of the business), non-commercials (large traders who speculate to realize trading profits) and nonreportable traders (usually small traders/speculators) as well as their open interest (contracts open in the market at time of reporting). See CFTC criteria here.
By JustMarkets The US stock market rose on Wednesday. By the end of the day,…
By Daniele D'Alvia, Queen Mary University of London When a conflict escalates, financial markets respond…
By Analytical Department RoboForex GBP/USD contracted to 1.3350 on Thursday, with the pound remaining under…
Opinion -- Source: Michael Ballanger (3/2/26) Michael Ballanger of GGM Advisory Inc. shares his view…
By ForexTime Oil benchmarks surge over 15% since Monday on supply fears Spiking energy prices…
By JustMarkets The US stock market declined sharply on Tuesday. By the end of the…
This website uses cookies.