By RoboForex Analytical Department
The price of gold has dropped below $3,360 per troy ounce, nearing a one-week low and marking its first decline in three weeks. Investors are offloading the precious metal to offset losses in other markets amid escalating tensions in the Middle East.
Geopolitical Tensions Weigh on Gold
Israel and Iran continue to exchange strikes, with Israel intensifying attacks on strategic and government sites in Tehran following reports of an Iranian missile hitting a major Israeli hospital.
Meanwhile, investors are closely monitoring developments in Washington. US President Donald Trump has not ruled out direct military intervention in Iran, and speculation is mounting that a decision could come within the next two weeks. However, the market remains driven by rumours rather than confirmed reports.
Earlier this week, the Federal Reserve held interest rates steady but signalled two potential cuts before year-end. Fed Chair Jerome Powell cautioned, however, that trade tariffs could continue to fuel inflation.
Free Reports:
The Fed’s latest projections indicate slower economic growth, rising inflation, and weaker employment prospects in 2025. Persistent inflation concerns may limit the scope for rate cuts, further pressuring gold, which, unlike bonds, offers no coupon income.
Technical Analysis: XAU/USD
H4 Chart:
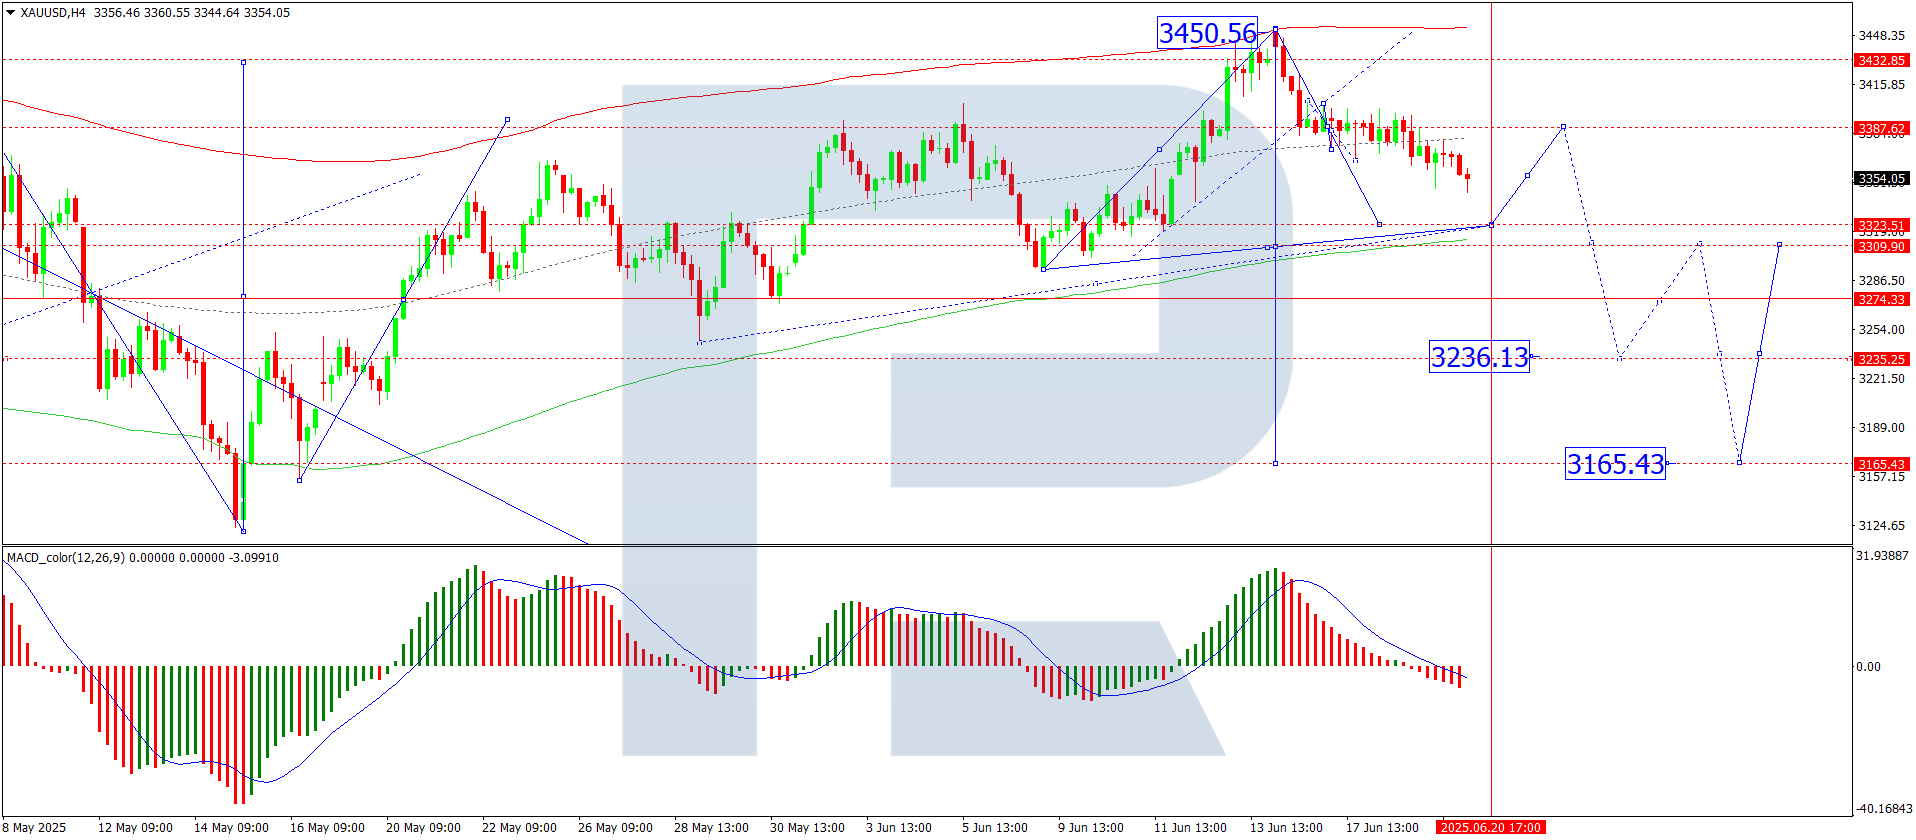
On the H4 chart, XAU/USD formed a consolidation range around 3,388 before breaking downward. The decline is expected to extend towards 3,323, after which a corrective rebound to 3,388 may follow. This scenario is supported by the MACD indicator, with its signal line below zero and pointing firmly downward.
H1 Chart:
On the H1 chart, the market completed a corrective wave to 3,399 before reversing downward and breaking below the consolidation range. The drop below 3,360 opens the door for further downside, with a target at 3,323. Upon reaching this level, a corrective bounce toward 3,350 could follow. The Stochastic oscillator confirms this scenario, with its signal line below 50 and trending sharply down towards 20.
Conclusion
Gold remains under downward pressure from geopolitical uncertainty, expectations of Fed policy, and technical selling. The key levels to watch are 3,323 (support) and 3,388 (resistance), with potential corrections offering short-term trading opportunities.by technical indicators.
Disclaimer
Any forecasts contained herein are based on the author’s particular opinion. This analysis may not be treated as trading advice. RoboForex bears no responsibility for trading results based on trading recommendations and reviews contained herein.
By InvestMacro Here are the latest charts and statistics for the Commitment of Traders (COT)…
By InvestMacro The latest update for the weekly Commitment of Traders (COT) report was released…
By InvestMacro Here are the latest charts and statistics for the Commitment of Traders (COT)…
By InvestMacro Here are the latest charts and statistics for the Commitment of Traders (COT)…
By InvestMacro Here are the latest charts and statistics for the Commitment of Traders (COT)…
By InvestMacro Here are the latest charts and statistics for the Commitment of Traders (COT)…
This website uses cookies.