By RoboForex Analytical Department
The USDJPY pair halted its decline around 142.98 on Monday. However, this pause in the yen’s rally should not be misleading, as it comes amid uncertainty surrounding the extent of the anticipated monetary policy easing by the US Federal Reserve. The latest US employment report provided little information for adjusting forecasts of the Fed’s interest rate trajectory. Investors must assess fresh inflation data this week before drawing any fundamental conclusions.
Over the past week, the JPY strengthened by almost 3.0% against the US dollar. The USDJPY pair dropped to its annual low amid expectations of decisive action from the Bank of Japan. The BoJ is expected to raise rates by the end of the year, which will be supported by steady economic growth, wage increases, and ongoing inflationary pressure.
If the Bank of Japan’s monetary policymakers’ projections regarding macroeconomic aspects materialise, the central bank will be ready to adjust its monetary policy parameters more actively. Meanwhile, the latest data reflected weak GDP growth in Japan in Q2. The economy expanded by only 2.9% year-on-year, compared to the preliminary estimate of 3.1%.
Technical analysis of USDJPY
Free Reports:
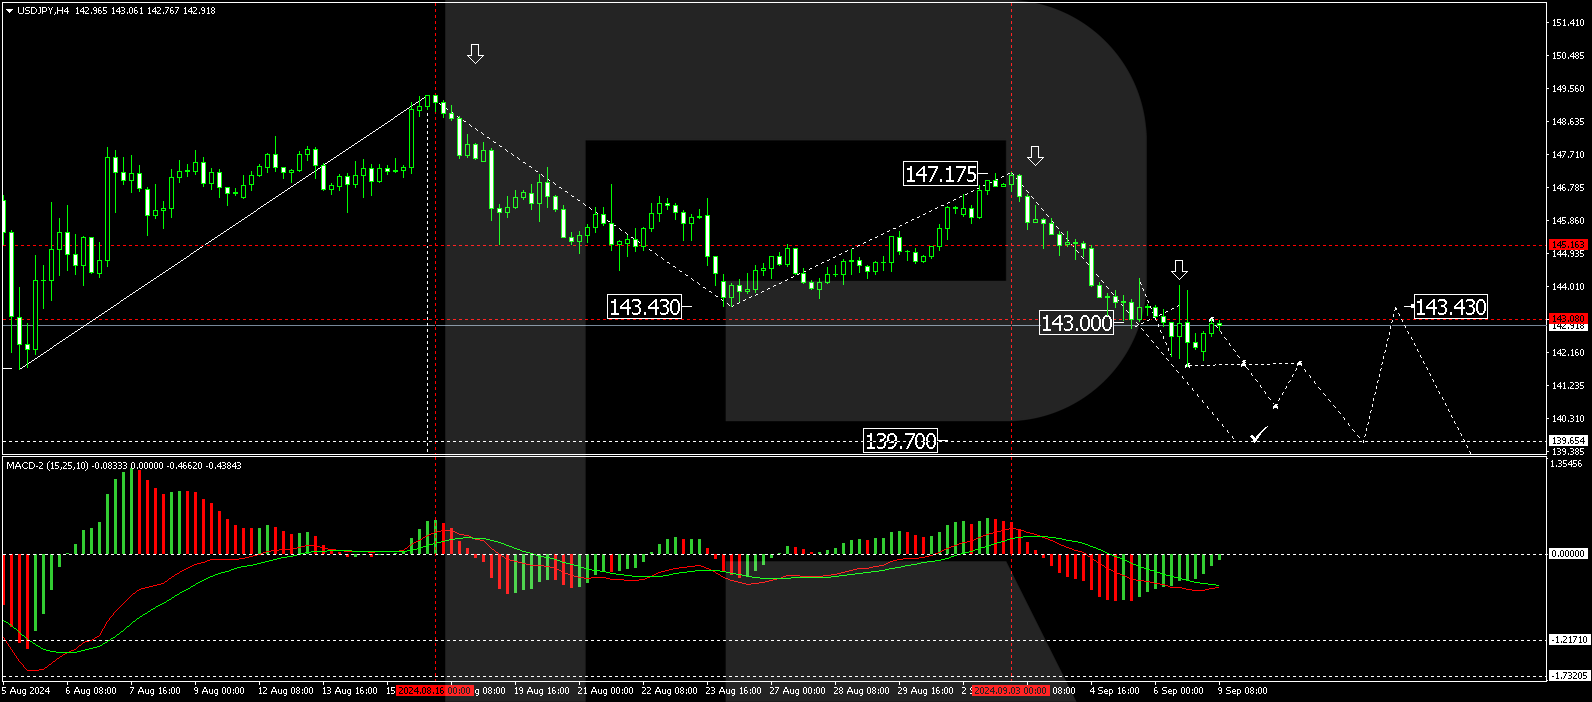
On the H4 chart, USD/JPY has formed a consolidation range around the 143.43 level. Due to recent news, the range has widened upwards to 144.00 and downwards to 141.76. Today, a rise towards the 143.43 level (testing from below) is possible, followed by a decline towards 141.70. Breaking this level could signal a continuation of the trend towards 139.70, with the potential for further development towards 137.77. This scenario is technically supported by the MACD indicator, whose signal line is below zero and pointing sharply downwards.
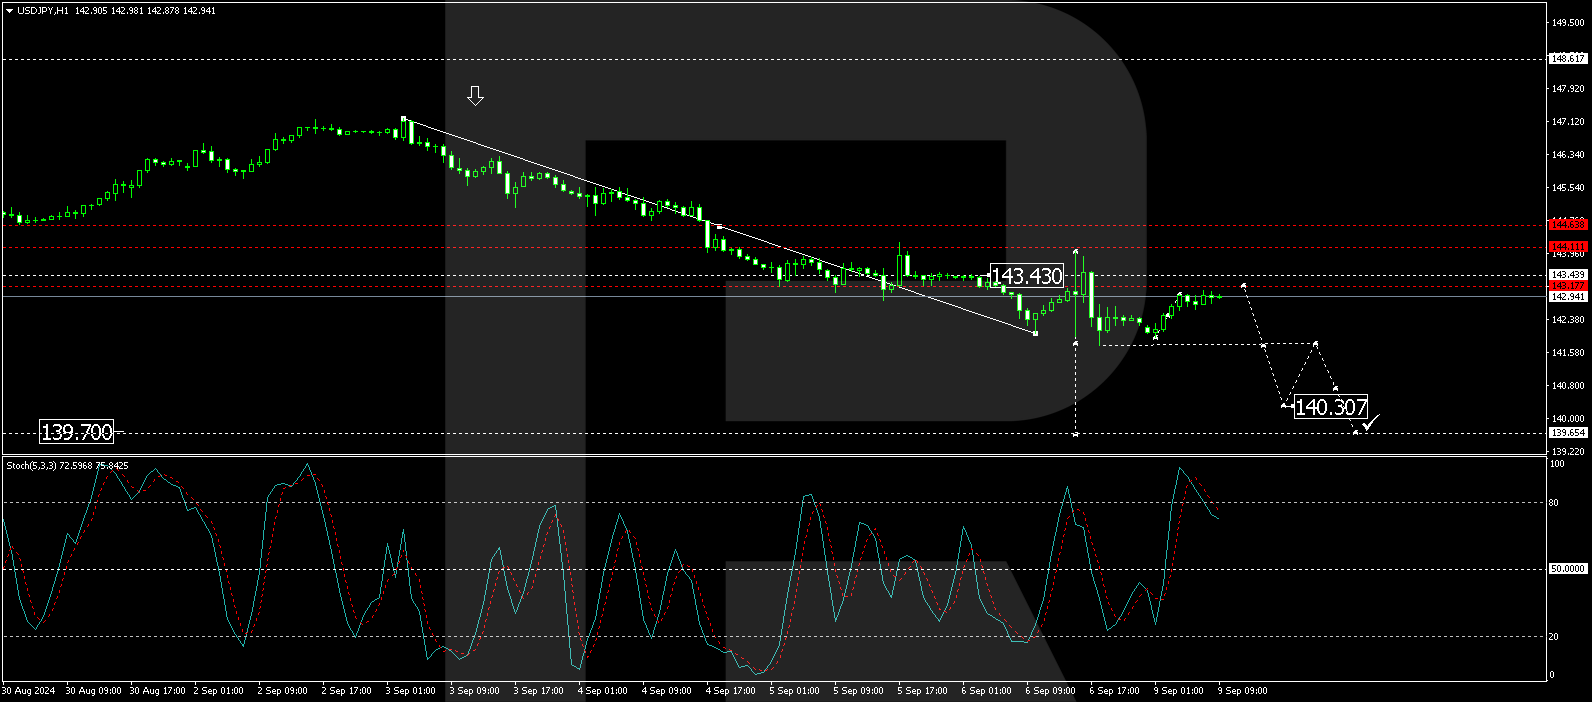
On the H1 chart, USD/JPY completed a downward impulse towards 141.76 and a subsequent rise to 143.00. A new consolidation range has almost formed. Today, a breakout below the lower boundary of this range is likely, with the downward wave continuing towards 140.30 and potentially further towards 139.70. After reaching this level, a correction towards 143.43 is possible. This scenario is also technically supported by the Stochastic oscillator, whose signal line is above 80 and pointing sharply downwards.
Disclaimer
Any forecasts contained herein are based on the author’s particular opinion. This analysis may not be treated as trading advice. RoboForex bears no responsibility for trading results based on trading recommendations and reviews contained herein.
By InvestMacro Here are the latest charts and statistics for the Commitment of Traders (COT)…
By InvestMacro The latest update for the weekly Commitment of Traders (COT) report was released…
By InvestMacro Here are the latest charts and statistics for the Commitment of Traders (COT)…
By InvestMacro Here are the latest charts and statistics for the Commitment of Traders (COT)…
By InvestMacro Here are the latest charts and statistics for the Commitment of Traders (COT)…
By InvestMacro Here are the latest charts and statistics for the Commitment of Traders (COT)…
This website uses cookies.