By InvestMacro
Here are the latest charts and statistics for the Commitment of Traders (COT) reports data published by the Commodities Futures Trading Commission (CFTC).
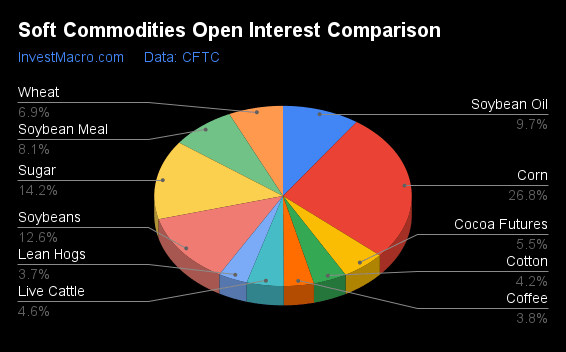
The latest COT data is updated through Tuesday January 30th and shows a quick view of how large traders (for-profit speculators and commercial entities) were positioned in the futures markets.
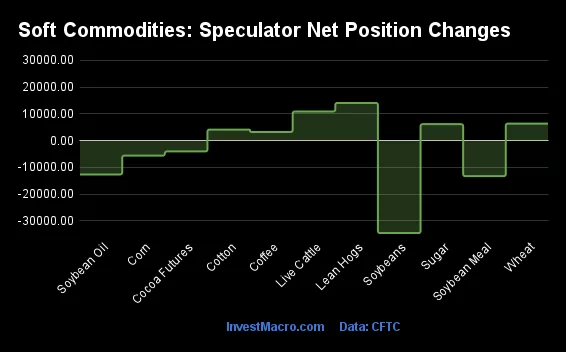
The COT soft commodities markets speculator bets were higher this week as six out of the eleven softs markets we cover had higher positioning while the other five markets had lower speculator contracts.
Free Reports:
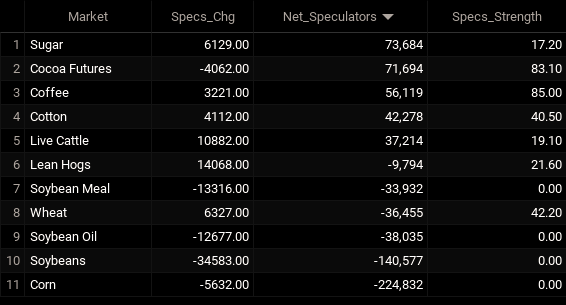
Leading the gains for the softs markets was Lean Hogs (14,068 contracts) with Live Cattle (10,882 contracts), Wheat (6,327 contracts), Sugar (6,129 contracts), Cotton (4,112 contracts) and Coffee (3,221 contracts) also showing positive weeks.
The markets with the declines in speculator bets this week were Soybeans (-34,583 contracts), Soybean Meal (-13,316 contracts), Soybean Oil (-12,677 contracts), Cocoa (-4,062 contracts) and with Corn (-5,632 contracts) also registering lower bets on the week.
Legend: Weekly Speculators Change | Speculators Current Net Position | Speculators Strength Score compared to last 3-Years (0-100 range)
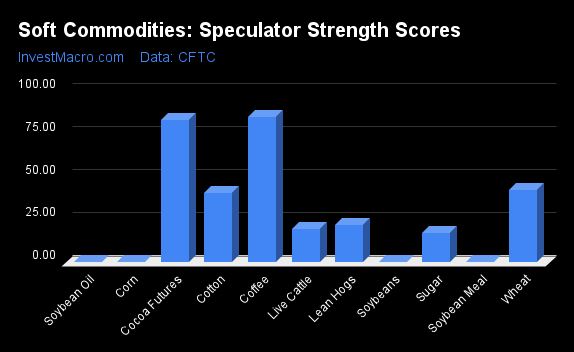
COT Strength Scores (a normalized measure of Speculator positions over a 3-Year range, from 0 to 100 where above 80 is Extreme-Bullish and below 20 is Extreme-Bearish) showed that Coffee (85 percent) and Cocoa (83 percent) lead the softs markets this week.
On the downside, Soybean Oil (0 percent), Soybean Meal (0 percent), Corn (0 percent), Soybeans (0 percent), Sugar (17 percent) and Live Cattle (19 percent) come in at the lowest strength levels currently and are all in Extreme-Bearish territory (below 20 percent).
Strength Statistics:
Corn (0.0 percent) vs Corn previous week (0.7 percent)
Sugar (17.2 percent) vs Sugar previous week (15.0 percent)
Coffee (85.0 percent) vs Coffee previous week (81.7 percent)
Soybeans (0.0 percent) vs Soybeans previous week (8.8 percent)
Soybean Oil (0.0 percent) vs Soybean Oil previous week (7.6 percent)
Soybean Meal (0.0 percent) vs Soybean Meal previous week (6.3 percent)
Live Cattle (19.1 percent) vs Live Cattle previous week (7.3 percent)
Lean Hogs (21.6 percent) vs Lean Hogs previous week (10.1 percent)
Cotton (40.5 percent) vs Cotton previous week (37.4 percent)
Cocoa (83.1 percent) vs Cocoa previous week (87.2 percent)
Wheat (42.2 percent) vs Wheat previous week (37.8 percent)
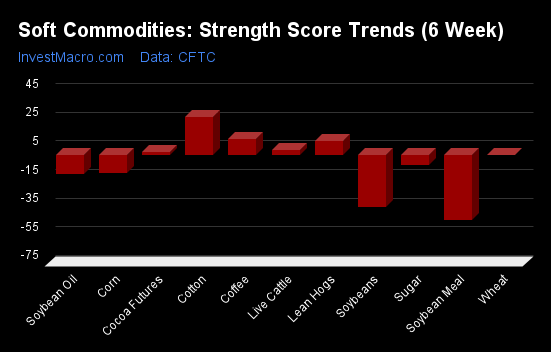
COT Strength Score Trends (or move index, calculates the 6-week changes in strength scores) showed that Cotton (27 percent) and Coffee (11 percent) lead the past six weeks trends for soft commodities. Lean Hogs (10 percent), Live Cattle (3 percent) and Cocoa (2 percent) are the next highest positive movers in the latest trends data.
Soybean Meal (-45 percent) leads the downside trend scores currently with Soybeans (-36 percent), Soybean Oil (-13 percent) and Corn (-13 percent) following next with lower trend scores.
Strength Trend Statistics:
Corn (-12.7 percent) vs Corn previous week (-15.4 percent)
Sugar (-6.9 percent) vs Sugar previous week (-14.4 percent)
Coffee (11.1 percent) vs Coffee previous week (16.7 percent)
Soybeans (-36.4 percent) vs Soybeans previous week (-31.6 percent)
Soybean Oil (-13.0 percent) vs Soybean Oil previous week (-11.7 percent)
Soybean Meal (-45.2 percent) vs Soybean Meal previous week (-50.0 percent)
Live Cattle (3.3 percent) vs Live Cattle previous week (-13.4 percent)
Lean Hogs (9.7 percent) vs Lean Hogs previous week (3.8 percent)
Cotton (26.9 percent) vs Cotton previous week (18.1 percent)
Cocoa (2.3 percent) vs Cocoa previous week (8.6 percent)
Wheat (0.4 percent) vs Wheat previous week (-1.9 percent)
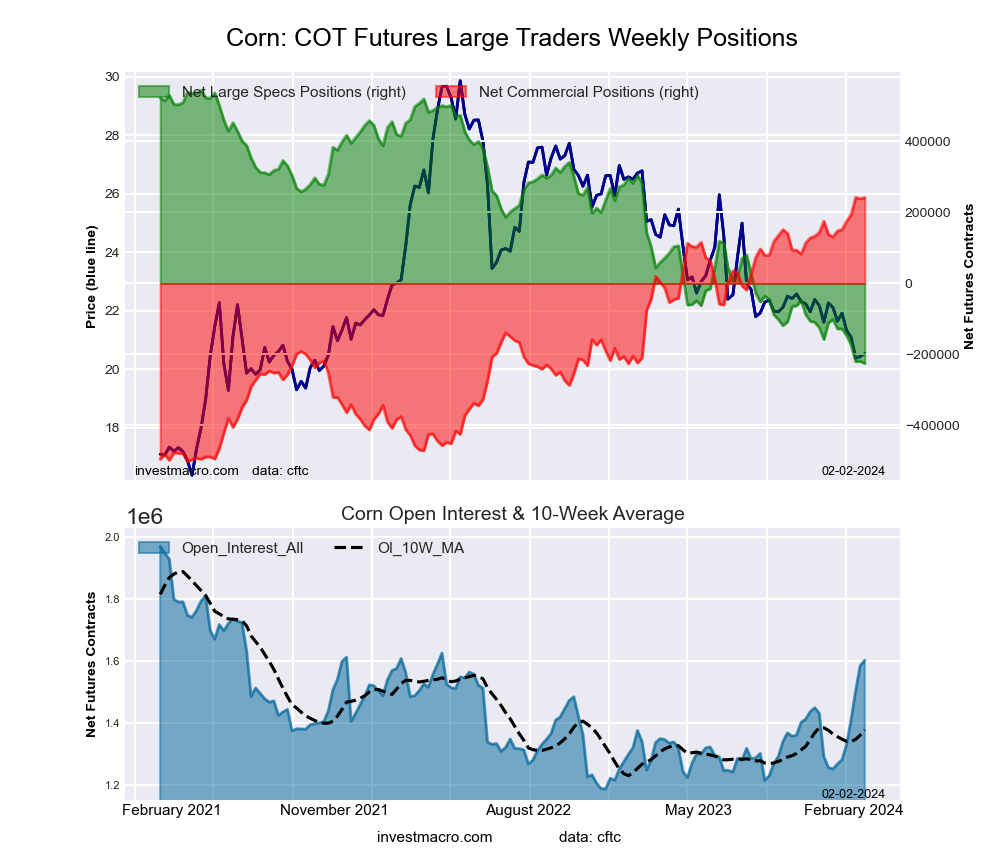
This week’s current strength score (the trader positioning range over the past three years, measured from 0 to 100) shows the speculators are currently Bearish-Extreme with a score of 0.0 percent. The commercials are Bullish-Extreme with a score of 99.9 percent and the small traders (not shown in chart) are Bullish-Extreme with a score of 100.0 percent.
Our weekly trend-following model classifies the current market price position as: Strong Downtrend. The current action for the model is considered to be: Hold – Maintain Short Position.
| CORN Futures Statistics | SPECULATORS | COMMERCIALS | SMALL TRADERS |
| – Percent of Open Interest Longs: | 16.6 | 46.5 | 9.6 |
| – Percent of Open Interest Shorts: | 30.7 | 31.4 | 10.7 |
| – Net Position: | -224,832 | 241,727 | -16,895 |
| – Gross Longs: | 266,671 | 745,348 | 154,099 |
| – Gross Shorts: | 491,503 | 503,621 | 170,994 |
| – Long to Short Ratio: | 0.5 to 1 | 1.5 to 1 | 0.9 to 1 |
| NET POSITION TREND: | |||
| – Strength Index Score (3 Year Range Pct): | 0.0 | 99.9 | 100.0 |
| – Strength Index Reading (3 Year Range): | Bearish-Extreme | Bullish-Extreme | Bullish-Extreme |
| NET POSITION MOVEMENT INDEX: | |||
| – 6-Week Change in Strength Index: | -12.7 | 12.6 | 5.4 |
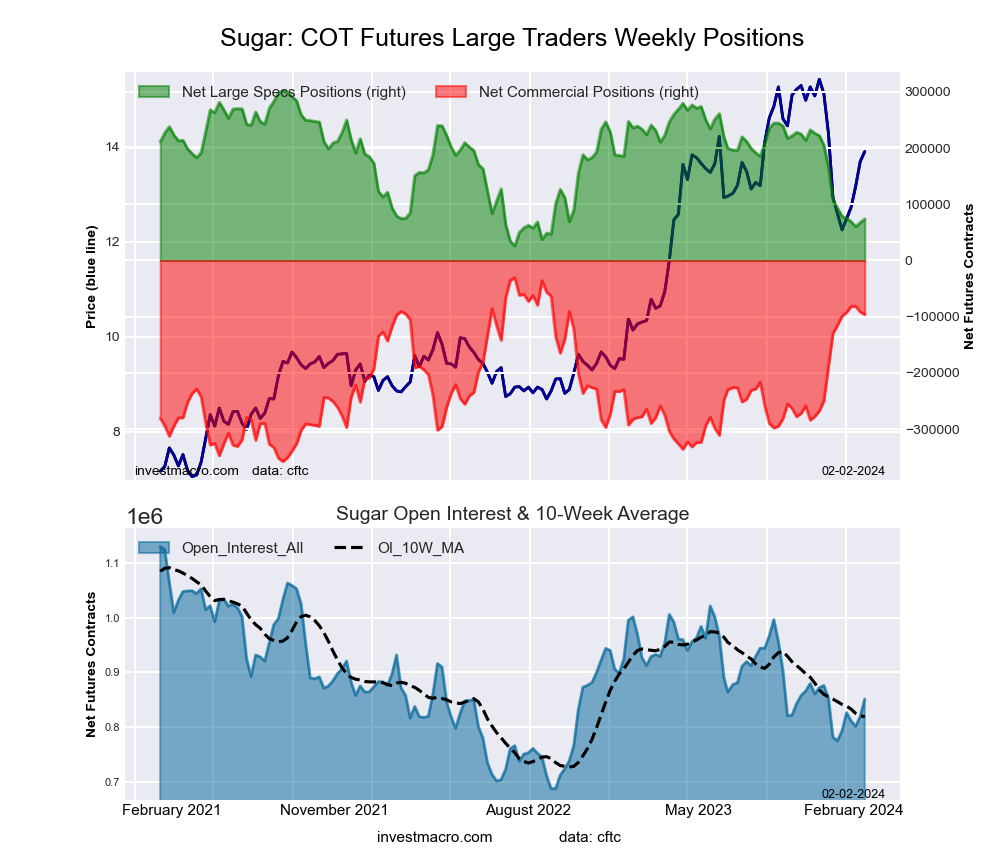
This week’s current strength score (the trader positioning range over the past three years, measured from 0 to 100) shows the speculators are currently Bearish-Extreme with a score of 17.2 percent. The commercials are Bullish with a score of 80.0 percent and the small traders (not shown in chart) are Bearish with a score of 31.3 percent.
Our weekly trend-following model classifies the current market price position as: Downtrend. The current action for the model is considered to be: Hold – Maintain Short Position.
| SUGAR Futures Statistics | SPECULATORS | COMMERCIALS | SMALL TRADERS |
| – Percent of Open Interest Longs: | 21.0 | 56.2 | 8.7 |
| – Percent of Open Interest Shorts: | 12.3 | 67.5 | 6.1 |
| – Net Position: | 73,684 | -96,000 | 22,316 |
| – Gross Longs: | 178,443 | 478,435 | 74,201 |
| – Gross Shorts: | 104,759 | 574,435 | 51,885 |
| – Long to Short Ratio: | 1.7 to 1 | 0.8 to 1 | 1.4 to 1 |
| NET POSITION TREND: | |||
| – Strength Index Score (3 Year Range Pct): | 17.2 | 80.0 | 31.3 |
| – Strength Index Reading (3 Year Range): | Bearish-Extreme | Bullish | Bearish |
| NET POSITION MOVEMENT INDEX: | |||
| – 6-Week Change in Strength Index: | -6.9 | 5.8 | 0.3 |
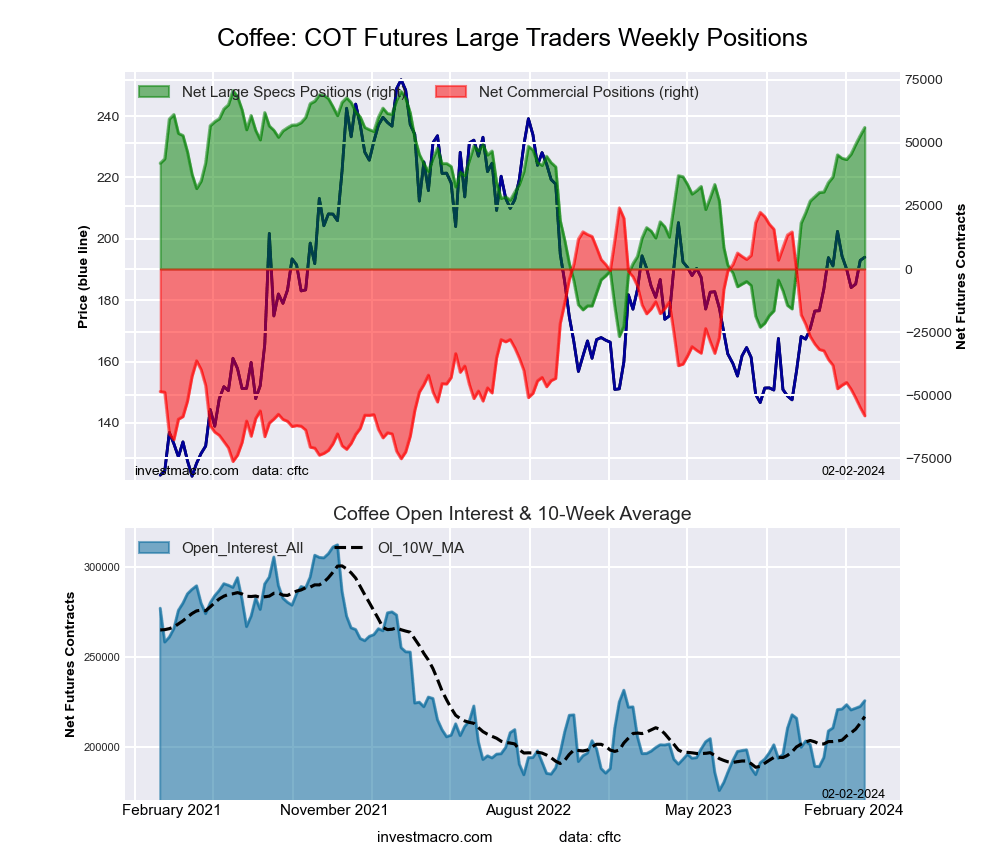
This week’s current strength score (the trader positioning range over the past three years, measured from 0 to 100) shows the speculators are currently Bullish-Extreme with a score of 85.0 percent. The commercials are Bearish-Extreme with a score of 18.0 percent and the small traders (not shown in chart) are Bearish with a score of 40.7 percent.
Our weekly trend-following model classifies the current market price position as: Uptrend. The current action for the model is considered to be: Hold – Maintain Long Position.
| COFFEE Futures Statistics | SPECULATORS | COMMERCIALS | SMALL TRADERS |
| – Percent of Open Interest Longs: | 35.9 | 35.1 | 4.3 |
| – Percent of Open Interest Shorts: | 11.1 | 61.0 | 3.4 |
| – Net Position: | 56,119 | -58,218 | 2,099 |
| – Gross Longs: | 81,054 | 79,239 | 9,784 |
| – Gross Shorts: | 24,935 | 137,457 | 7,685 |
| – Long to Short Ratio: | 3.3 to 1 | 0.6 to 1 | 1.3 to 1 |
| NET POSITION TREND: | |||
| – Strength Index Score (3 Year Range Pct): | 85.0 | 18.0 | 40.7 |
| – Strength Index Reading (3 Year Range): | Bullish-Extreme | Bearish-Extreme | Bearish |
| NET POSITION MOVEMENT INDEX: | |||
| – 6-Week Change in Strength Index: | 11.1 | -10.7 | -1.3 |
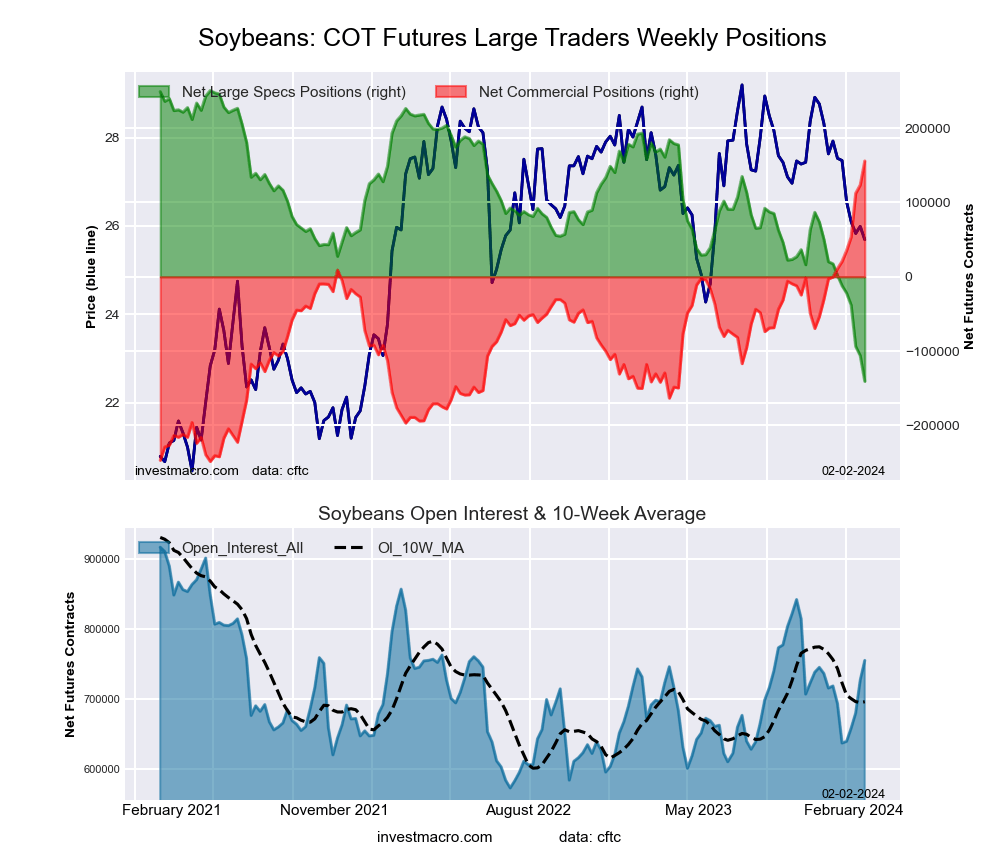
This week’s current strength score (the trader positioning range over the past three years, measured from 0 to 100) shows the speculators are currently Bearish-Extreme with a score of 0.0 percent. The commercials are Bullish-Extreme with a score of 100.0 percent and the small traders (not shown in chart) are Bullish with a score of 68.1 percent.
Our weekly trend-following model classifies the current market price position as: Strong Downtrend. The current action for the model is considered to be: Hold – Maintain Short Position.
| SOYBEANS Futures Statistics | SPECULATORS | COMMERCIALS | SMALL TRADERS |
| – Percent of Open Interest Longs: | 10.3 | 60.1 | 6.5 |
| – Percent of Open Interest Shorts: | 28.9 | 39.4 | 8.5 |
| – Net Position: | -140,577 | 155,822 | -15,245 |
| – Gross Longs: | 77,880 | 453,583 | 49,226 |
| – Gross Shorts: | 218,457 | 297,761 | 64,471 |
| – Long to Short Ratio: | 0.4 to 1 | 1.5 to 1 | 0.8 to 1 |
| NET POSITION TREND: | |||
| – Strength Index Score (3 Year Range Pct): | 0.0 | 100.0 | 68.1 |
| – Strength Index Reading (3 Year Range): | Bearish-Extreme | Bullish-Extreme | Bullish |
| NET POSITION MOVEMENT INDEX: | |||
| – 6-Week Change in Strength Index: | -36.4 | 35.8 | -5.3 |
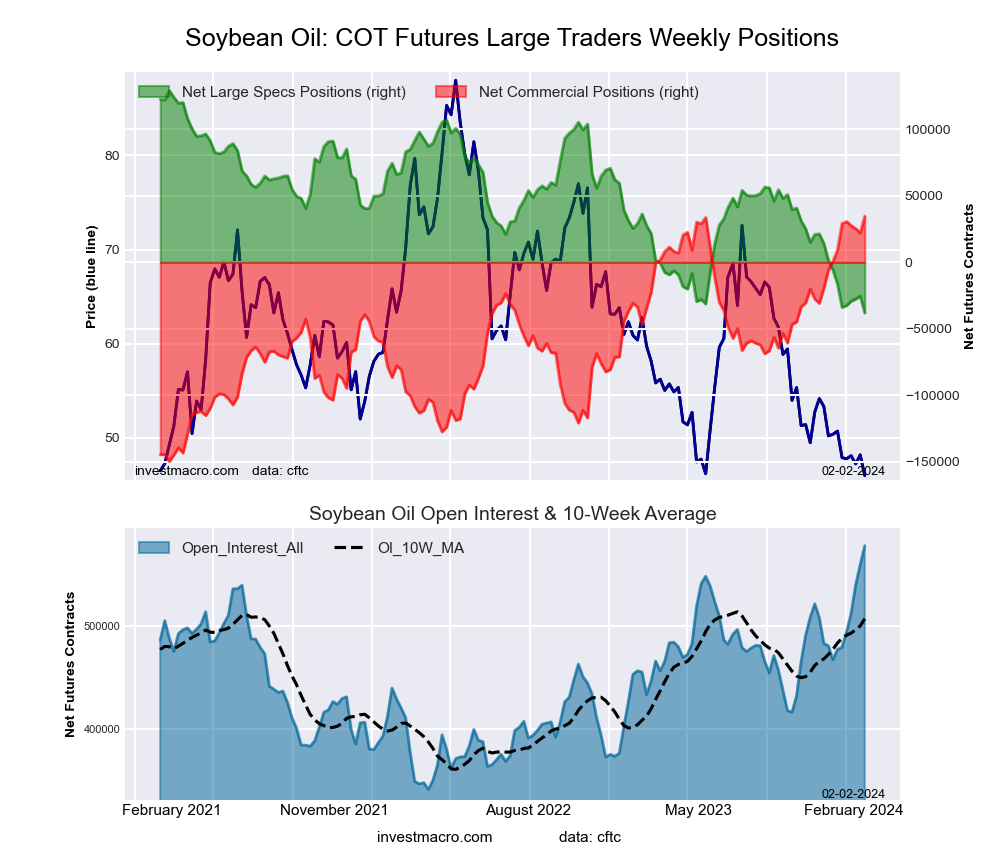
This week’s current strength score (the trader positioning range over the past three years, measured from 0 to 100) shows the speculators are currently Bearish-Extreme with a score of 0.0 percent. The commercials are Bullish-Extreme with a score of 100.0 percent and the small traders (not shown in chart) are Bearish with a score of 26.1 percent.
Our weekly trend-following model classifies the current market price position as: Downtrend. The current action for the model is considered to be: Hold – Maintain Short Position.
| SOYBEAN OIL Futures Statistics | SPECULATORS | COMMERCIALS | SMALL TRADERS |
| – Percent of Open Interest Longs: | 17.3 | 50.0 | 5.6 |
| – Percent of Open Interest Shorts: | 23.8 | 44.1 | 5.0 |
| – Net Position: | -38,035 | 34,664 | 3,371 |
| – Gross Longs: | 99,948 | 289,600 | 32,569 |
| – Gross Shorts: | 137,983 | 254,936 | 29,198 |
| – Long to Short Ratio: | 0.7 to 1 | 1.1 to 1 | 1.1 to 1 |
| NET POSITION TREND: | |||
| – Strength Index Score (3 Year Range Pct): | 0.0 | 100.0 | 26.1 |
| – Strength Index Reading (3 Year Range): | Bearish-Extreme | Bullish-Extreme | Bearish |
| NET POSITION MOVEMENT INDEX: | |||
| – 6-Week Change in Strength Index: | -13.0 | 13.8 | -14.3 |
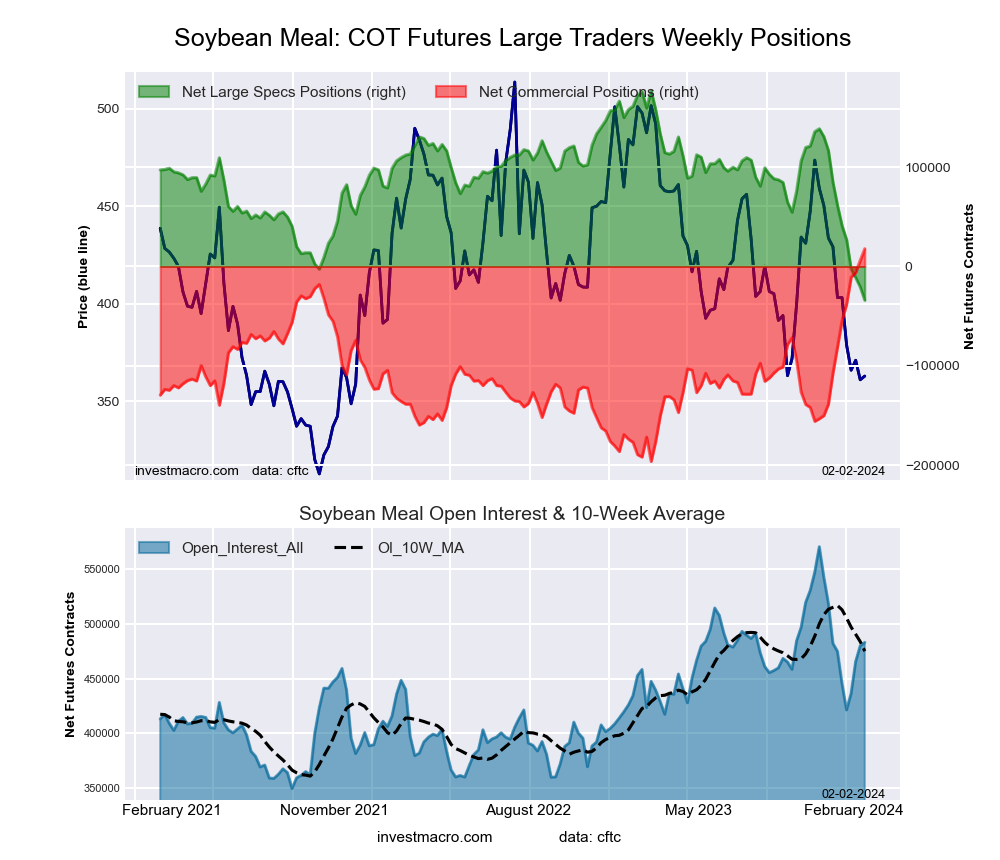
This week’s current strength score (the trader positioning range over the past three years, measured from 0 to 100) shows the speculators are currently Bearish-Extreme with a score of 0.0 percent. The commercials are Bullish-Extreme with a score of 100.0 percent and the small traders (not shown in chart) are Bearish with a score of 27.5 percent.
Our weekly trend-following model classifies the current market price position as: Strong Downtrend. The current action for the model is considered to be: Hold – Maintain Short Position.
| SOYBEAN MEAL Futures Statistics | SPECULATORS | COMMERCIALS | SMALL TRADERS |
| – Percent of Open Interest Longs: | 15.0 | 51.2 | 10.1 |
| – Percent of Open Interest Shorts: | 22.0 | 47.5 | 6.8 |
| – Net Position: | -33,932 | 17,882 | 16,050 |
| – Gross Longs: | 72,409 | 247,263 | 48,670 |
| – Gross Shorts: | 106,341 | 229,381 | 32,620 |
| – Long to Short Ratio: | 0.7 to 1 | 1.1 to 1 | 1.5 to 1 |
| NET POSITION TREND: | |||
| – Strength Index Score (3 Year Range Pct): | 0.0 | 100.0 | 27.5 |
| – Strength Index Reading (3 Year Range): | Bearish-Extreme | Bullish-Extreme | Bearish |
| NET POSITION MOVEMENT INDEX: | |||
| – 6-Week Change in Strength Index: | -45.2 | 46.3 | -16.9 |
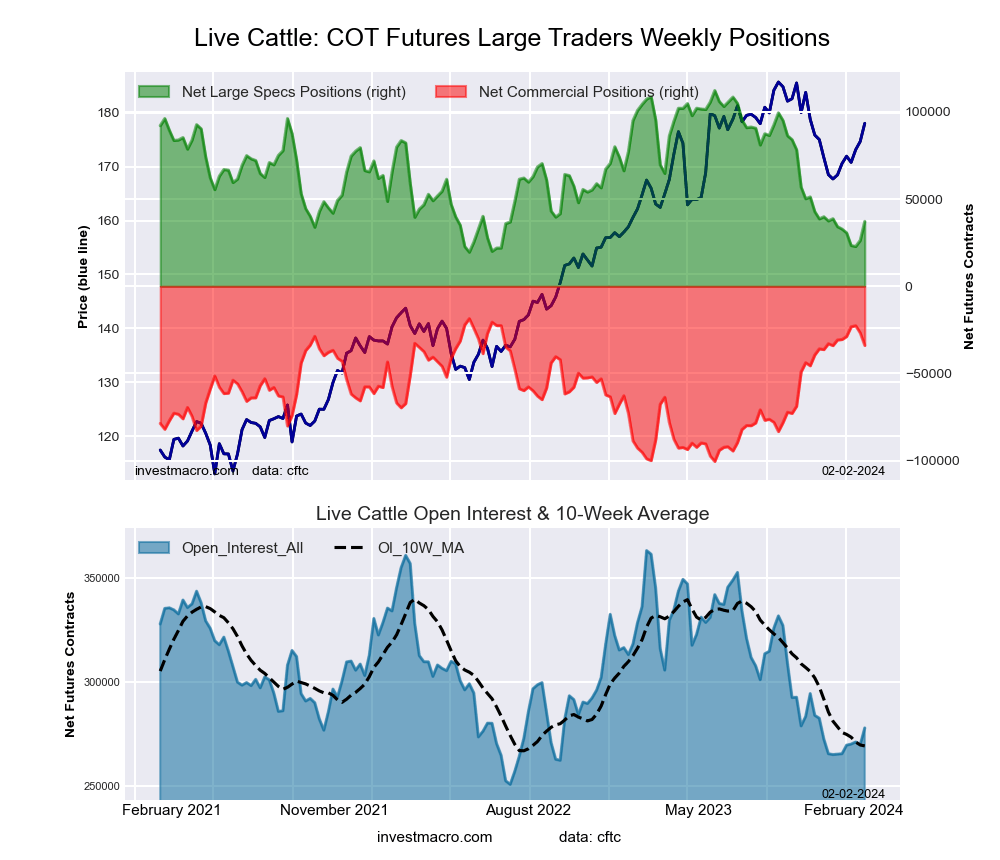
This week’s current strength score (the trader positioning range over the past three years, measured from 0 to 100) shows the speculators are currently Bearish-Extreme with a score of 19.1 percent. The commercials are Bullish-Extreme with a score of 81.2 percent and the small traders (not shown in chart) are Bullish with a score of 72.3 percent.
Our weekly trend-following model classifies the current market price position as: Weak Downtrend. The current action for the model is considered to be: Hold – Maintain Short Position.
| LIVE CATTLE Futures Statistics | SPECULATORS | COMMERCIALS | SMALL TRADERS |
| – Percent of Open Interest Longs: | 30.4 | 38.8 | 11.2 |
| – Percent of Open Interest Shorts: | 17.0 | 51.0 | 12.4 |
| – Net Position: | 37,214 | -33,950 | -3,264 |
| – Gross Longs: | 84,392 | 107,858 | 31,065 |
| – Gross Shorts: | 47,178 | 141,808 | 34,329 |
| – Long to Short Ratio: | 1.8 to 1 | 0.8 to 1 | 0.9 to 1 |
| NET POSITION TREND: | |||
| – Strength Index Score (3 Year Range Pct): | 19.1 | 81.2 | 72.3 |
| – Strength Index Reading (3 Year Range): | Bearish-Extreme | Bullish-Extreme | Bullish |
| NET POSITION MOVEMENT INDEX: | |||
| – 6-Week Change in Strength Index: | 3.3 | -3.8 | 0.5 |
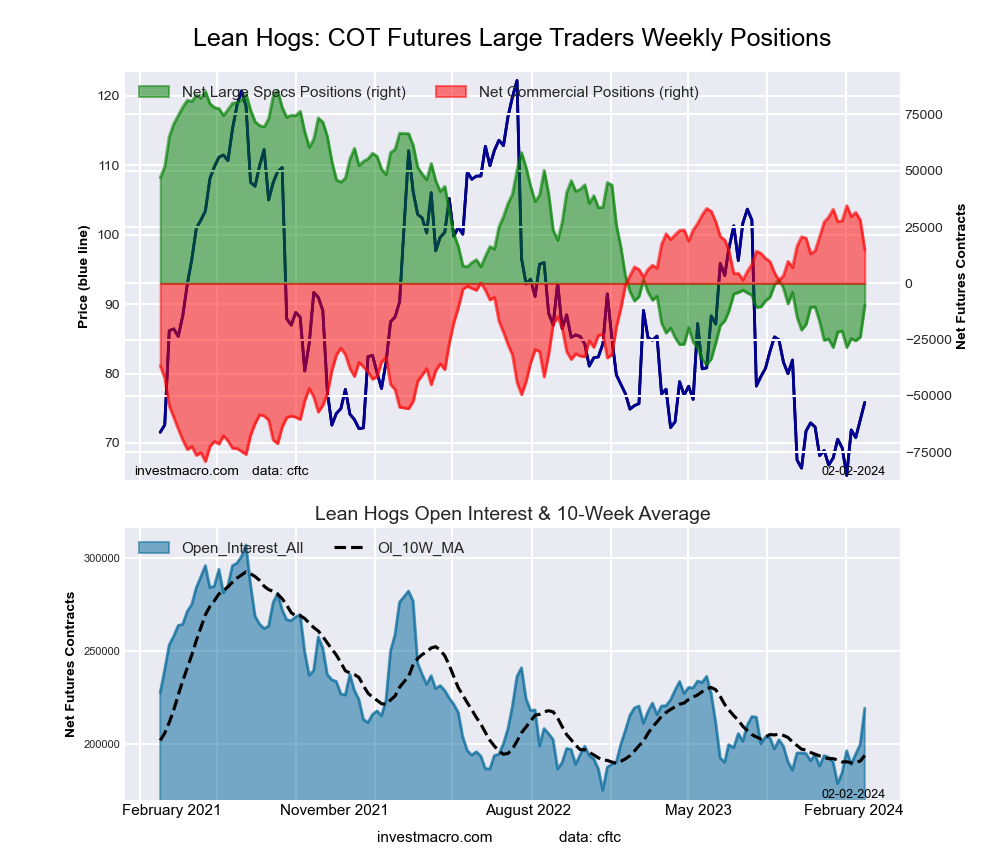
This week’s current strength score (the trader positioning range over the past three years, measured from 0 to 100) shows the speculators are currently Bearish with a score of 21.6 percent. The commercials are Bullish-Extreme with a score of 82.7 percent and the small traders (not shown in chart) are Bullish with a score of 60.9 percent.
Our weekly trend-following model classifies the current market price position as: Weak Downtrend. The current action for the model is considered to be: Hold – Maintain Short Position.
| LEAN HOGS Futures Statistics | SPECULATORS | COMMERCIALS | SMALL TRADERS |
| – Percent of Open Interest Longs: | 33.4 | 38.8 | 8.5 |
| – Percent of Open Interest Shorts: | 37.8 | 32.0 | 10.8 |
| – Net Position: | -9,794 | 14,796 | -5,002 |
| – Gross Longs: | 73,083 | 84,878 | 18,722 |
| – Gross Shorts: | 82,877 | 70,082 | 23,724 |
| – Long to Short Ratio: | 0.9 to 1 | 1.2 to 1 | 0.8 to 1 |
| NET POSITION TREND: | |||
| – Strength Index Score (3 Year Range Pct): | 21.6 | 82.7 | 60.9 |
| – Strength Index Reading (3 Year Range): | Bearish | Bullish-Extreme | Bullish |
| NET POSITION MOVEMENT INDEX: | |||
| – 6-Week Change in Strength Index: | 9.7 | -11.0 | 3.4 |
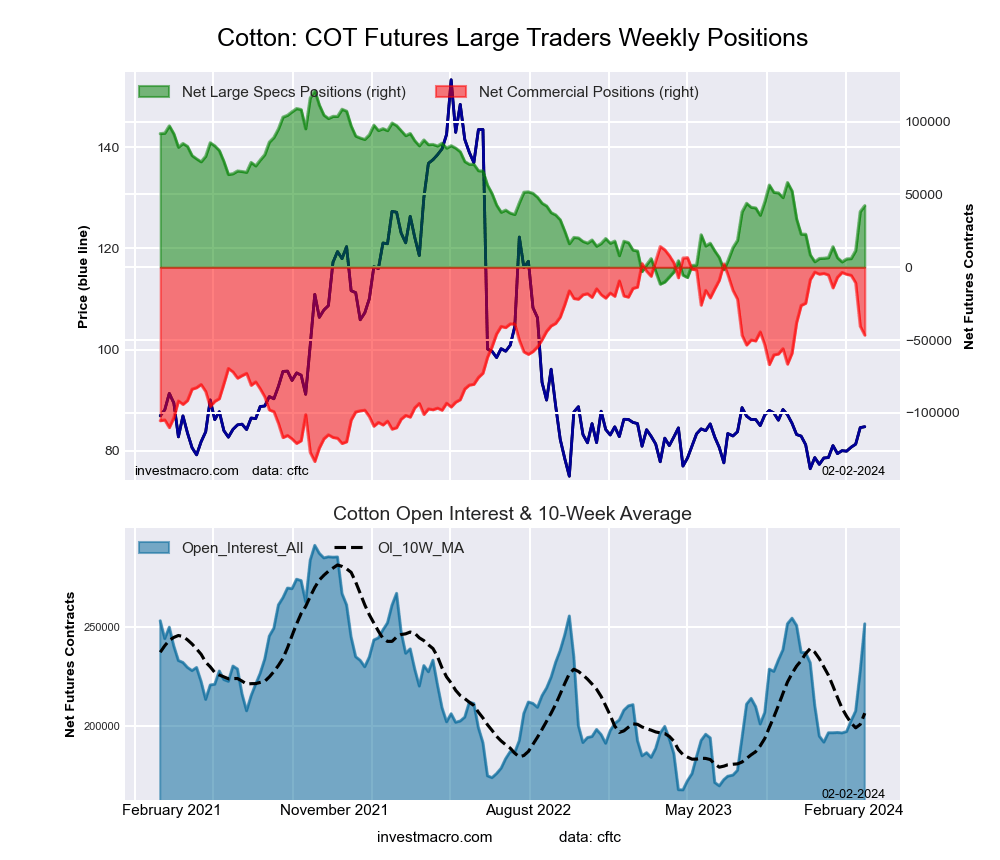
This week’s current strength score (the trader positioning range over the past three years, measured from 0 to 100) shows the speculators are currently Bearish with a score of 40.5 percent. The commercials are Bullish with a score of 58.8 percent and the small traders (not shown in chart) are Bearish with a score of 42.1 percent.
Our weekly trend-following model classifies the current market price position as: Weak Downtrend. The current action for the model is considered to be: Hold – Maintain Short Position.
| COTTON Futures Statistics | SPECULATORS | COMMERCIALS | SMALL TRADERS |
| – Percent of Open Interest Longs: | 28.8 | 45.6 | 6.4 |
| – Percent of Open Interest Shorts: | 12.0 | 64.1 | 4.7 |
| – Net Position: | 42,278 | -46,586 | 4,308 |
| – Gross Longs: | 72,535 | 114,657 | 16,124 |
| – Gross Shorts: | 30,257 | 161,243 | 11,816 |
| – Long to Short Ratio: | 2.4 to 1 | 0.7 to 1 | 1.4 to 1 |
| NET POSITION TREND: | |||
| – Strength Index Score (3 Year Range Pct): | 40.5 | 58.8 | 42.1 |
| – Strength Index Reading (3 Year Range): | Bearish | Bullish | Bearish |
| NET POSITION MOVEMENT INDEX: | |||
| – 6-Week Change in Strength Index: | 26.9 | -26.9 | 24.0 |
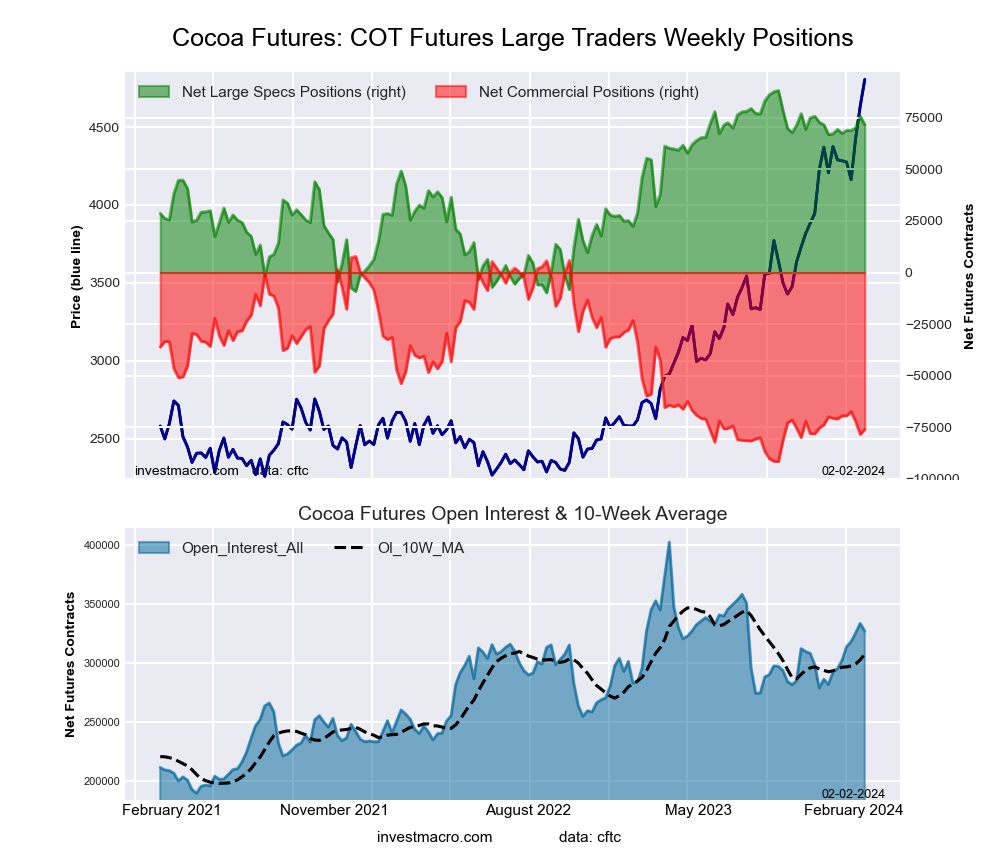
This week’s current strength score (the trader positioning range over the past three years, measured from 0 to 100) shows the speculators are currently Bullish-Extreme with a score of 83.1 percent. The commercials are Bearish-Extreme with a score of 15.7 percent and the small traders (not shown in chart) are Bearish with a score of 48.9 percent.
Our weekly trend-following model classifies the current market price position as: Strong Uptrend. The current action for the model is considered to be: Hold – Maintain Long Position.
| COCOA Futures Statistics | SPECULATORS | COMMERCIALS | SMALL TRADERS |
| – Percent of Open Interest Longs: | 38.7 | 26.0 | 5.4 |
| – Percent of Open Interest Shorts: | 16.8 | 49.2 | 4.1 |
| – Net Position: | 71,694 | -76,000 | 4,306 |
| – Gross Longs: | 126,534 | 84,962 | 17,615 |
| – Gross Shorts: | 54,840 | 160,962 | 13,309 |
| – Long to Short Ratio: | 2.3 to 1 | 0.5 to 1 | 1.3 to 1 |
| NET POSITION TREND: | |||
| – Strength Index Score (3 Year Range Pct): | 83.1 | 15.7 | 48.9 |
| – Strength Index Reading (3 Year Range): | Bullish-Extreme | Bearish-Extreme | Bearish |
| NET POSITION MOVEMENT INDEX: | |||
| – 6-Week Change in Strength Index: | 2.3 | -5.1 | 23.6 |
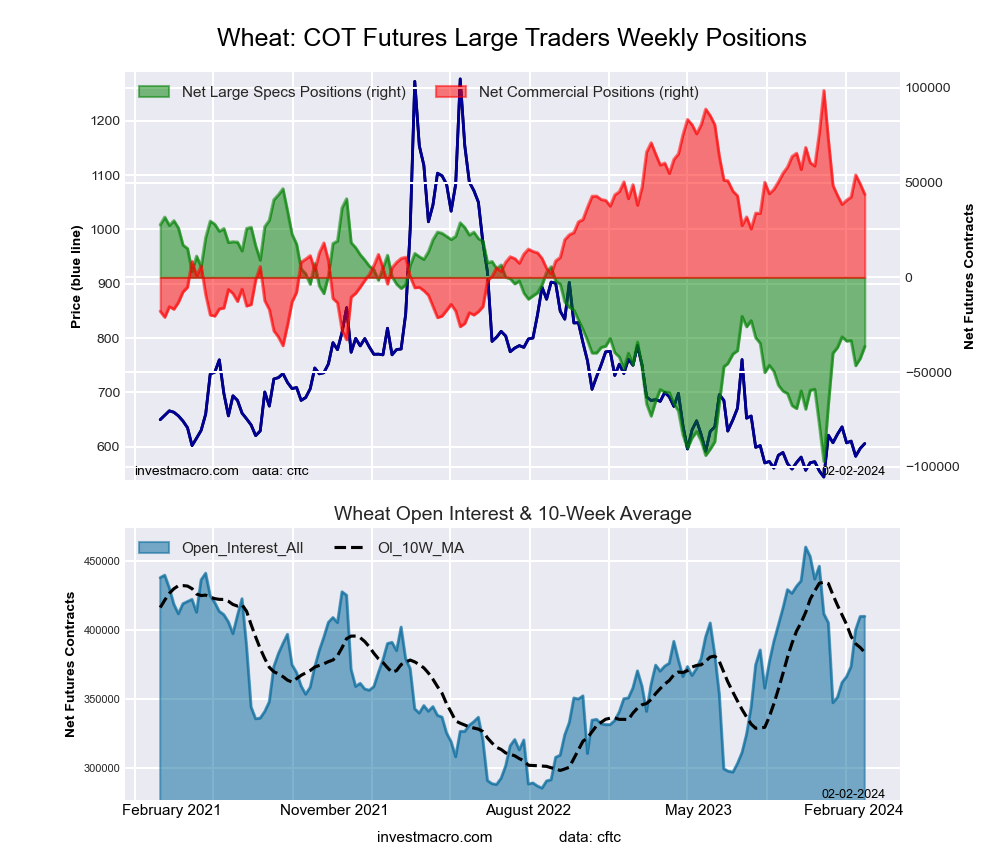
This week’s current strength score (the trader positioning range over the past three years, measured from 0 to 100) shows the speculators are currently Bearish with a score of 42.2 percent. The commercials are Bullish with a score of 59.3 percent and the small traders (not shown in chart) are Bearish with a score of 34.0 percent.
Our weekly trend-following model classifies the current market price position as: Uptrend. The current action for the model is considered to be: Hold – Maintain Long Position.
| WHEAT Futures Statistics | SPECULATORS | COMMERCIALS | SMALL TRADERS |
| – Percent of Open Interest Longs: | 28.8 | 36.5 | 7.5 |
| – Percent of Open Interest Shorts: | 37.7 | 25.8 | 9.3 |
| – Net Position: | -36,455 | 43,840 | -7,385 |
| – Gross Longs: | 118,028 | 149,787 | 30,571 |
| – Gross Shorts: | 154,483 | 105,947 | 37,956 |
| – Long to Short Ratio: | 0.8 to 1 | 1.4 to 1 | 0.8 to 1 |
| NET POSITION TREND: | |||
| – Strength Index Score (3 Year Range Pct): | 42.2 | 59.3 | 34.0 |
| – Strength Index Reading (3 Year Range): | Bearish | Bullish | Bearish |
| NET POSITION MOVEMENT INDEX: | |||
| – 6-Week Change in Strength Index: | 0.4 | 0.4 | -4.9 |
Article By InvestMacro – Receive our weekly COT Newsletter
*COT Report: The COT data, released weekly to the public each Friday, is updated through the most recent Tuesday (data is 3 days old) and shows a quick view of how large speculators or non-commercials (for-profit traders) were positioned in the futures markets.
The CFTC categorizes trader positions according to commercial hedgers (traders who use futures contracts for hedging as part of the business), non-commercials (large traders who speculate to realize trading profits) and nonreportable traders (usually small traders/speculators) as well as their open interest (contracts open in the market at time of reporting). See CFTC criteria here.
By InvestMacro The latest update for the weekly Commitment of Traders (COT) report was released…
By InvestMacro Here are the latest charts and statistics for the Commitment of Traders (COT)…
By InvestMacro Here are the latest charts and statistics for the Commitment of Traders (COT)…
By InvestMacro Here are the latest charts and statistics for the Commitment of Traders (COT)…
By InvestMacro Here are the latest charts and statistics for the Commitment of Traders (COT)…
By Analytical Department RoboForex Gold fell to 4,033 USD per ounce on Thursday, extending its…
This website uses cookies.