By InvestMacro
Here are the latest charts and statistics for the Commitment of Traders (COT) reports data published by the Commodities Futures Trading Commission (CFTC).
The latest COT data is updated through Tuesday September 12th and shows a quick view of how large traders (for-profit speculators and commercial hedgers) were positioned in the futures markets.
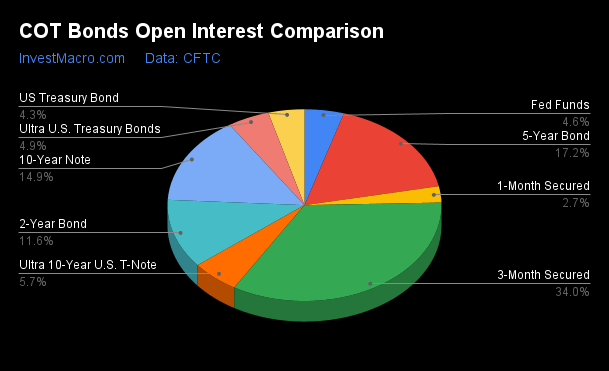
The COT bond market speculator bets were higher this week as six out of the eight bond markets we cover had higher positioning while the other two markets had lower speculator contracts.
Free Reports:
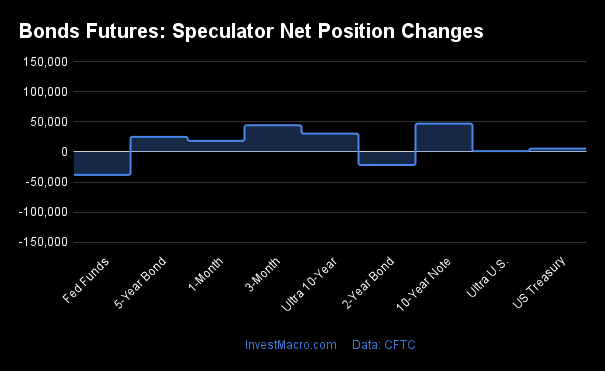
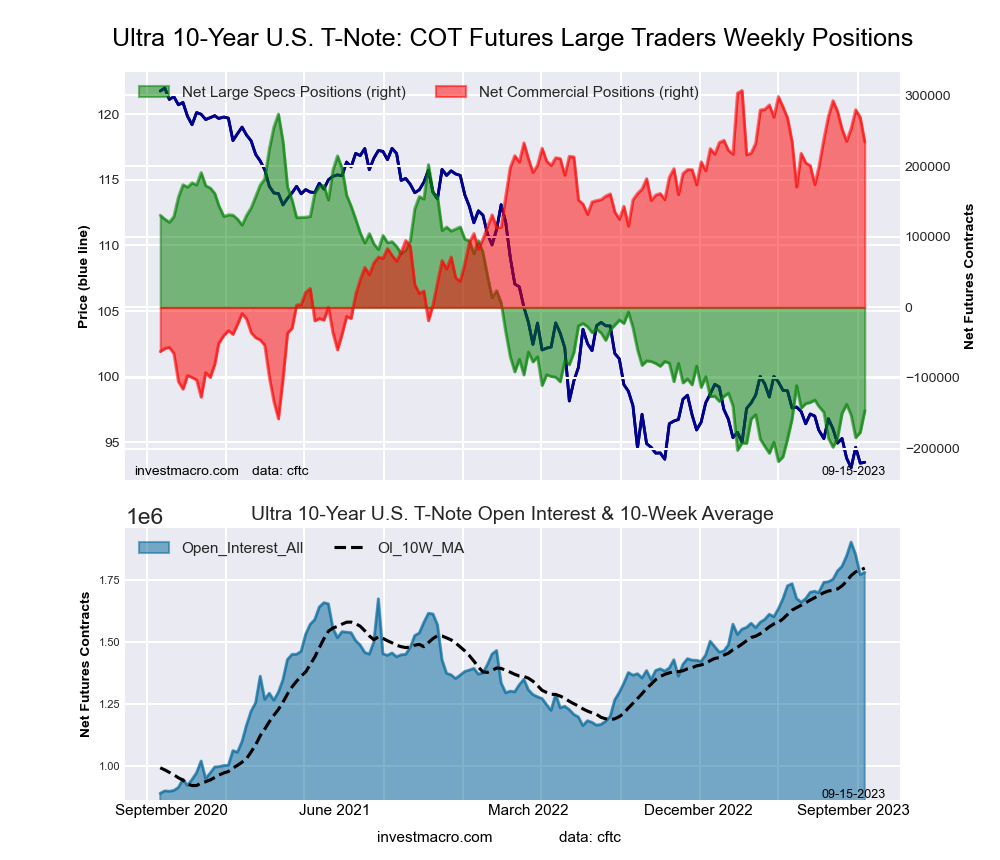
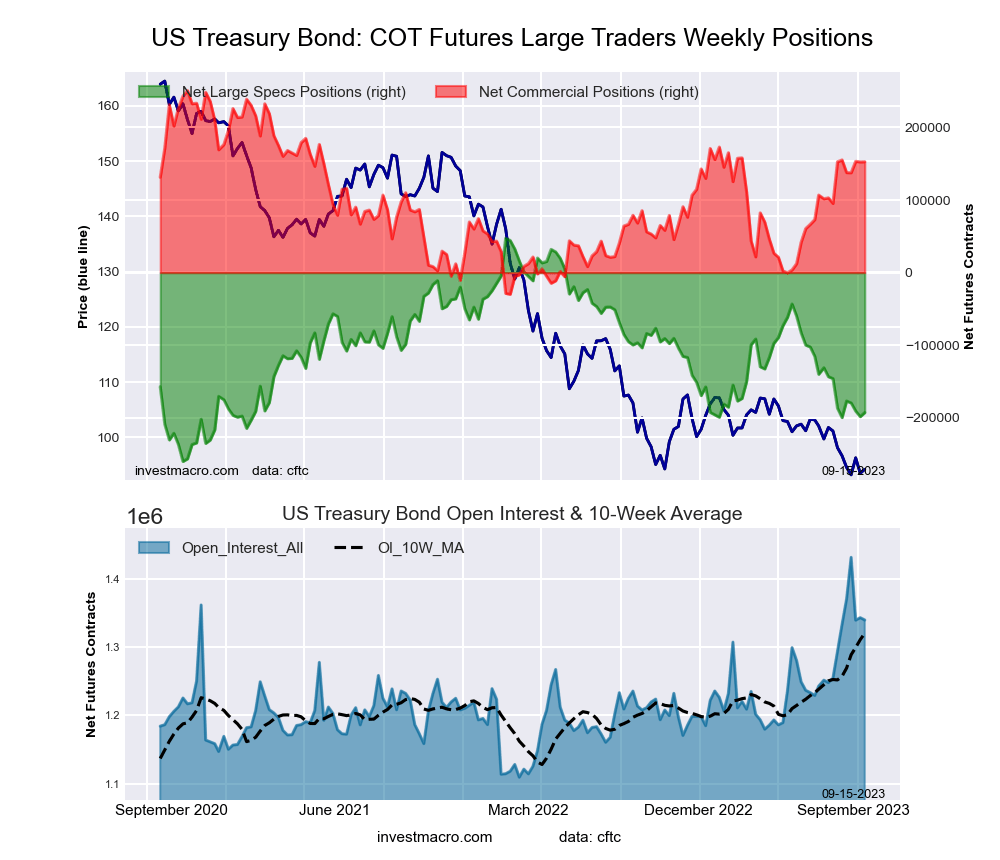
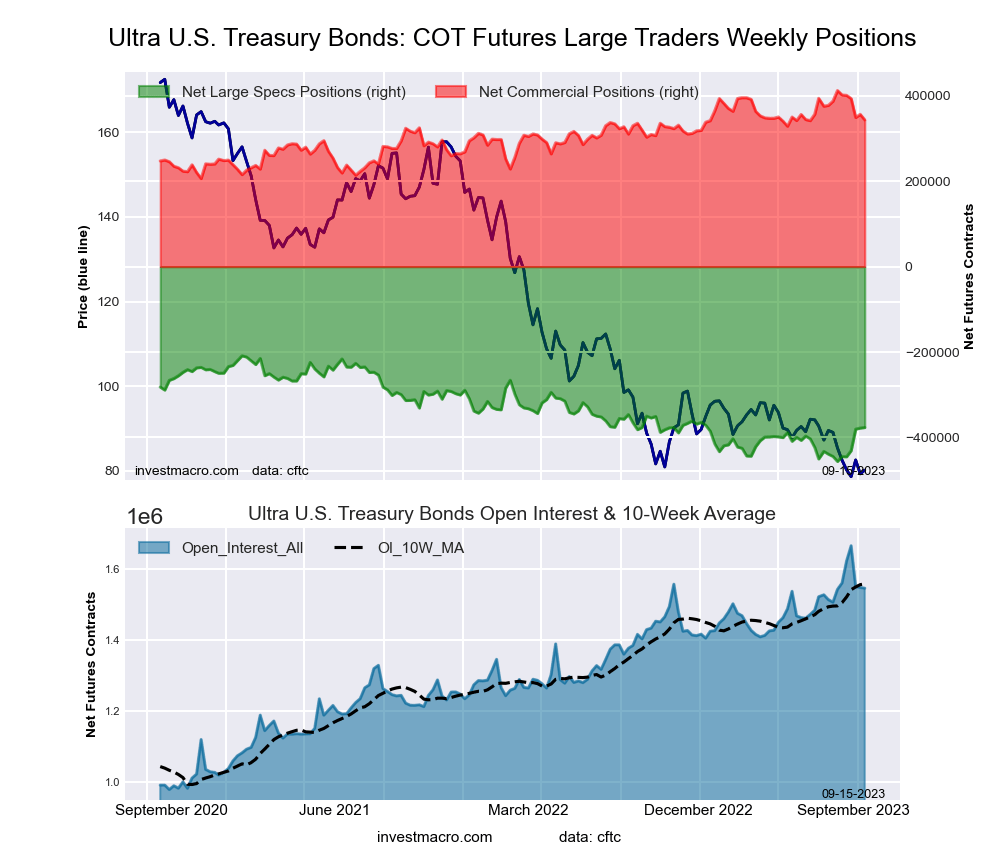
Leading the gains for the bond markets was the 10-Year Bonds (47,233 contracts) with SOFR 3-Months (44,439 contracts), the Ultra 10-Year Bonds (30,615 contracts), the 5-Year Bonds (25,238 contracts), the US Treasury Bonds (5,605 contracts) and the Ultra Treasury Bonds (1,346 contracts) also showing positive weeks.
The bond markets with declines in speculator bets for the week were the Fed Funds with a drop by -38,064 contracts and the 2-Year Bonds with a decline of -21,719 contracts on the week.
| Sep-12-2023 | OI | OI-Index | Spec-Net | Spec-Index | Com-Net | COM-Index | Smalls-Net | Smalls-Index |
|---|---|---|---|---|---|---|---|---|
| SOFR-3-Months | 10,667,873 | 100 | 316,511 | 99 | -313,438 | 0 | -3,073 | 86 |
| FedFunds | 1,458,261 | 43 | -184,954 | 25 | 195,040 | 75 | -10,086 | 71 |
| 2-Year | 3,653,520 | 85 | -1,239,609 | 2 | 1,128,539 | 99 | 111,070 | 93 |
| Long T-Bond | 1,339,675 | 72 | -192,687 | 22 | 152,663 | 65 | 40,024 | 78 |
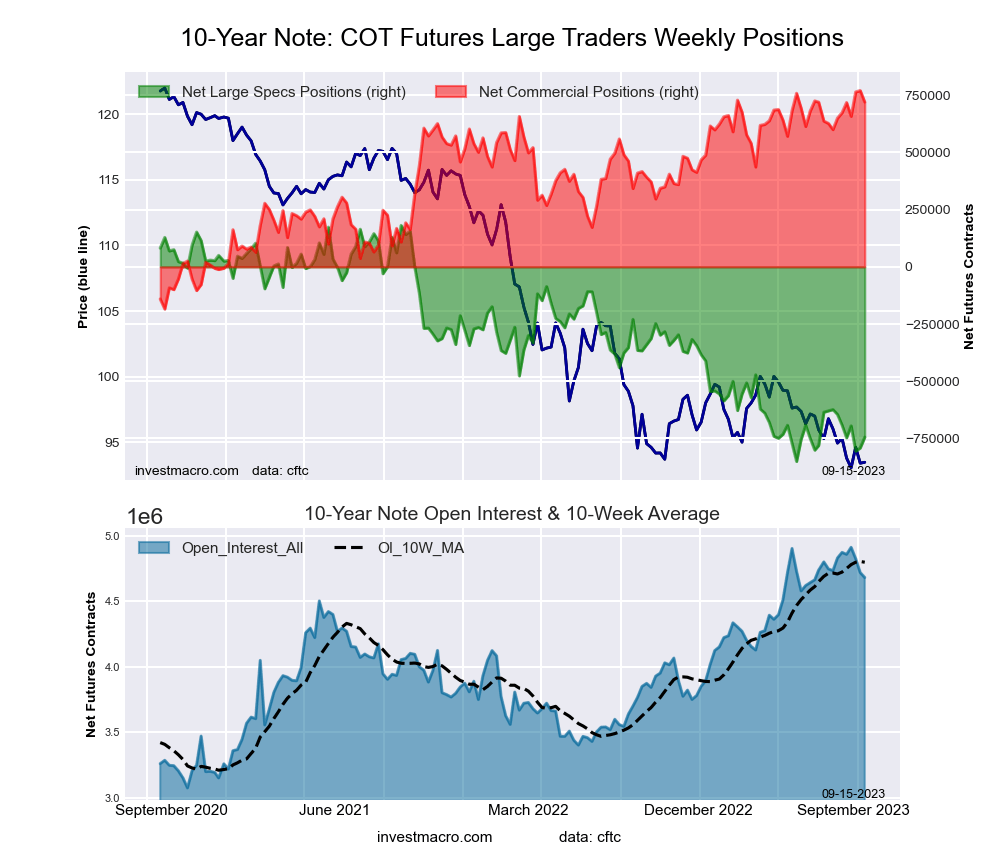
| 10-Year | 4,681,032 | 87 | -744,302 | 10 | 720,210 | 95 | 24,092 | 79 |
| 5-Year | 5,391,830 | 85 | -1,031,030 | 17 | 954,444 | 79 | 76,586 | 90 |
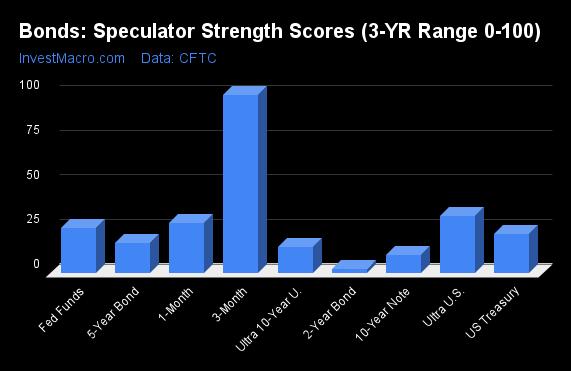
COT Strength Scores (a normalized measure of Speculator positions over a 3-Year range, from 0 to 100 where above 80 is Extreme-Bullish and below 20 is Extreme-Bearish) showed that the SOFR 3-Months (99 percent) leads the bond markets this week. The Ultra Treasury Bonds (32 percent) comes in as the next highest in the weekly strength scores.
On the downside, the 2-Year Bonds (2 percent), the 10-Year Bonds (10 percent), the Ultra 10-Year Bonds (15 percent) and the 5-Year Bonds (17 percent) come in at the lowest strength level currently and are in Extreme-Bearish territory (below 20 percent).
Strength Statistics:
Fed Funds (24.9 percent) vs Fed Funds previous week (31.9 percent)
2-Year Bond (2.3 percent) vs 2-Year Bond previous week (3.9 percent)
5-Year Bond (16.7 percent) vs 5-Year Bond previous week (14.8 percent)
10-Year Bond (10.3 percent) vs 10-Year Bond previous week (5.7 percent)
Ultra 10-Year Bond (14.6 percent) vs Ultra 10-Year Bond previous week (8.4 percent)
US Treasury Bond (21.9 percent) vs US Treasury Bond previous week (20.1 percent)
Ultra US Treasury Bond (32.1 percent) vs Ultra US Treasury Bond previous week (31.6 percent)
SOFR 3-Months (99.4 percent) vs SOFR 3-Months previous week (96.4 percent)
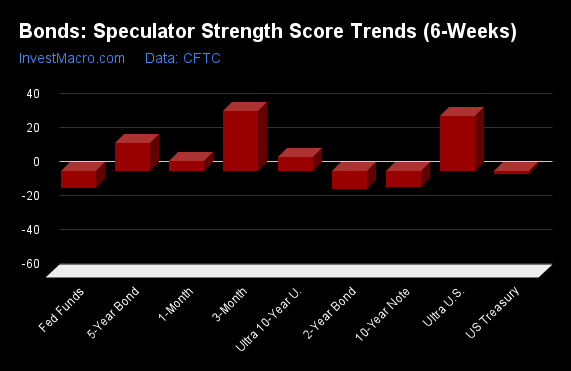
COT Strength Score Trends (or move index, calculates the 6-week changes in strength scores) showed that the SOFR 3-Months (35 percent) and the Ultra Treasury Bonds (32 percent) lead the past six weeks trends for bonds. The 5-Year Bonds (17 percent) and the are the next highest positive movers in the latest trends data.
The 2-Year Bonds (-11 percent), the 10-Year Bonds (-10 percent) and the Fed Funds (-10 percent) lead the downside trend scores currently.
Strength Trend Statistics:
Fed Funds (-9.8 percent) vs Fed Funds previous week (2.2 percent)
2-Year Bond (-10.6 percent) vs 2-Year Bond previous week (-5.3 percent)
5-Year Bond (16.7 percent) vs 5-Year Bond previous week (6.0 percent)
10-Year Bond (-9.6 percent) vs 10-Year Bond previous week (-16.3 percent)
Ultra 10-Year Bond (7.9 percent) vs Ultra 10-Year Bond previous week (4.3 percent)
US Treasury Bond (-2.0 percent) vs US Treasury Bond previous week (-17.1 percent)
Ultra US Treasury Bond (32.1 percent) vs Ultra US Treasury Bond previous week (26.8 percent)
SOFR 3-Months (35.2 percent) vs SOFR 3-Months previous week (18.2 percent)
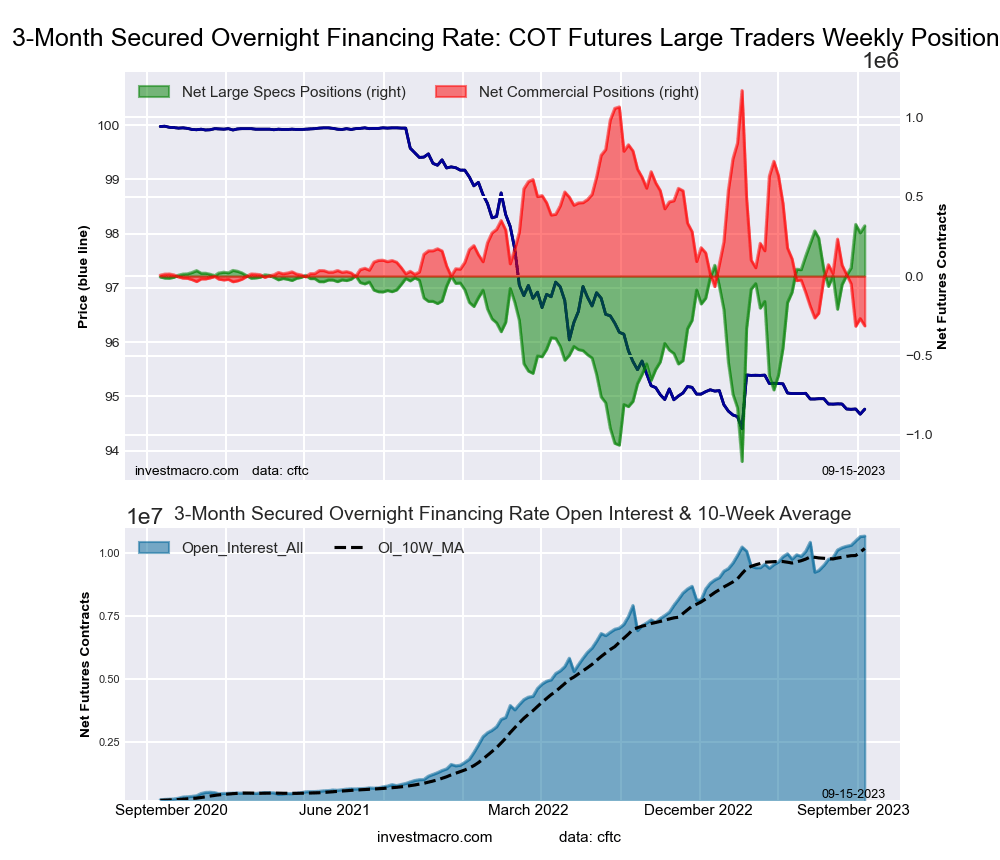
This week’s current strength score (the trader positioning range over the past three years, measured from 0 to 100) shows the speculators are currently Bullish-Extreme with a score of 99.4 percent. The commercials are Bearish-Extreme with a score of 0.1 percent and the small traders (not shown in chart) are Bullish-Extreme with a score of 86.2 percent.
Our weekly trend-following model classifies the current market price position as: Weak Uptrend. The current action for the model is considered to be: Hold – Maintain Long Position.
| SOFR 3-Months Statistics | SPECULATORS | COMMERCIALS | SMALL TRADERS |
| – Percent of Open Interest Longs: | 17.9 | 58.2 | 0.3 |
| – Percent of Open Interest Shorts: | 14.9 | 61.1 | 0.4 |
| – Net Position: | 316,511 | -313,438 | -3,073 |
| – Gross Longs: | 1,910,702 | 6,204,626 | 37,259 |
| – Gross Shorts: | 1,594,191 | 6,518,064 | 40,332 |
| – Long to Short Ratio: | 1.2 to 1 | 1.0 to 1 | 0.9 to 1 |
| NET POSITION TREND: | |||
| – Strength Index Score (3 Year Range Pct): | 99.4 | 0.1 | 86.2 |
| – Strength Index Reading (3 Year Range): | Bullish-Extreme | Bearish-Extreme | Bullish-Extreme |
| NET POSITION MOVEMENT INDEX: | |||
| – 6-Week Change in Strength Index: | 35.2 | -36.8 | 11.6 |
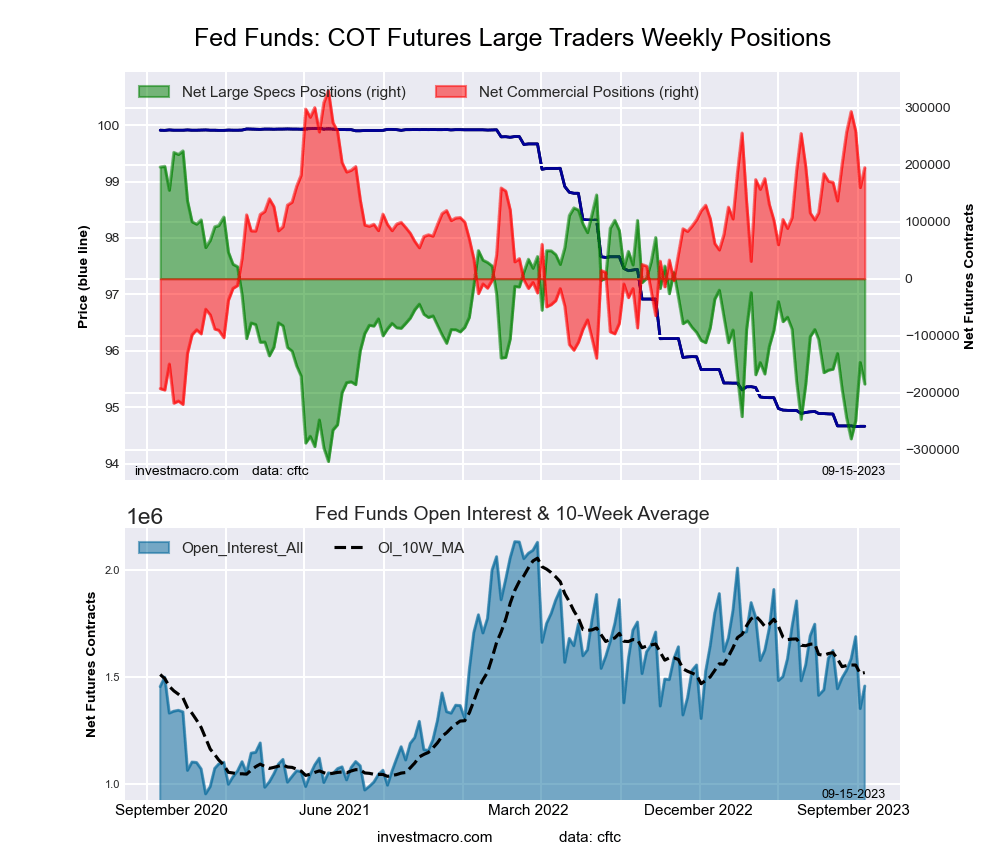
This week’s current strength score (the trader positioning range over the past three years, measured from 0 to 100) shows the speculators are currently Bearish with a score of 24.9 percent. The commercials are Bullish with a score of 75.4 percent and the small traders (not shown in chart) are Bullish with a score of 71.2 percent.
Our weekly trend-following model classifies the current market price position as: Downtrend. The current action for the model is considered to be: Hold – Maintain Short Position.
| 30-Day Federal Funds Statistics | SPECULATORS | COMMERCIALS | SMALL TRADERS |
| – Percent of Open Interest Longs: | 7.2 | 74.8 | 2.4 |
| – Percent of Open Interest Shorts: | 19.9 | 61.4 | 3.1 |
| – Net Position: | -184,954 | 195,040 | -10,086 |
| – Gross Longs: | 104,572 | 1,091,054 | 35,676 |
| – Gross Shorts: | 289,526 | 896,014 | 45,762 |
| – Long to Short Ratio: | 0.4 to 1 | 1.2 to 1 | 0.8 to 1 |
| NET POSITION TREND: | |||
| – Strength Index Score (3 Year Range Pct): | 24.9 | 75.4 | 71.2 |
| – Strength Index Reading (3 Year Range): | Bearish | Bullish | Bullish |
| NET POSITION MOVEMENT INDEX: | |||
| – 6-Week Change in Strength Index: | -9.8 | 10.6 | -9.4 |
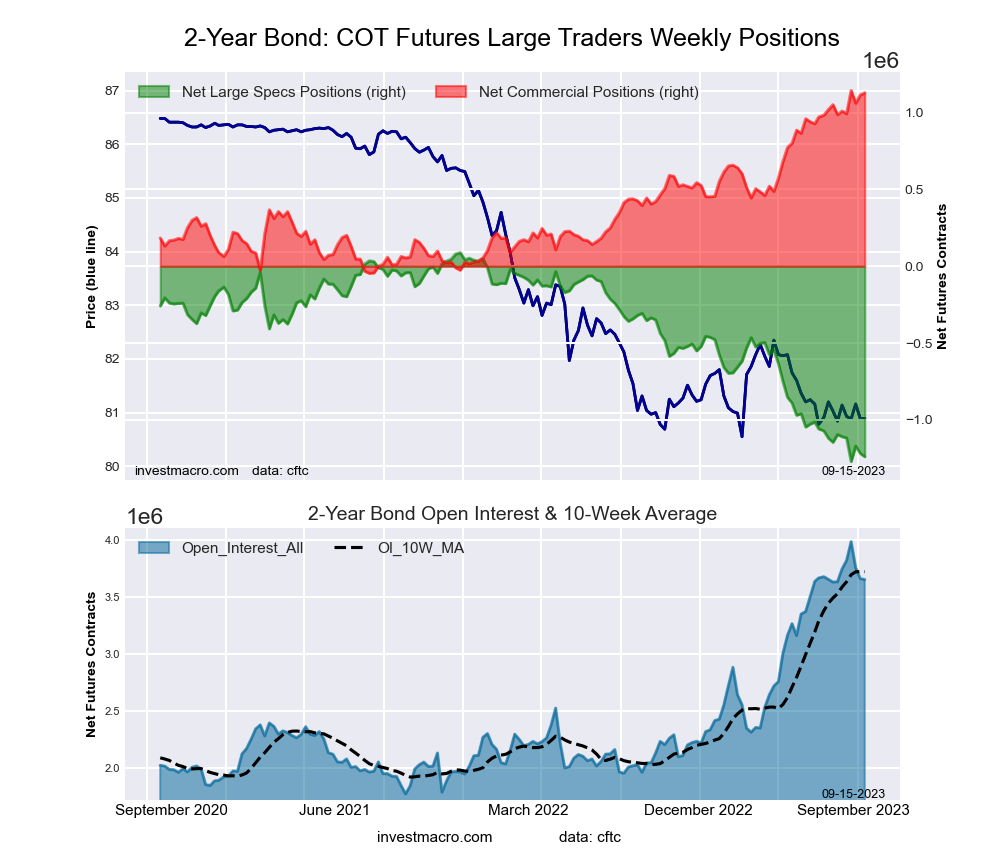
This week’s current strength score (the trader positioning range over the past three years, measured from 0 to 100) shows the speculators are currently Bearish-Extreme with a score of 2.3 percent. The commercials are Bullish-Extreme with a score of 98.8 percent and the small traders (not shown in chart) are Bullish-Extreme with a score of 93.2 percent.
Our weekly trend-following model classifies the current market price position as: Downtrend. The current action for the model is considered to be: Hold – Maintain Short Position.
| 2-Year Treasury Note Statistics | SPECULATORS | COMMERCIALS | SMALL TRADERS |
| – Percent of Open Interest Longs: | 8.8 | 83.0 | 7.1 |
| – Percent of Open Interest Shorts: | 42.7 | 52.1 | 4.1 |
| – Net Position: | -1,239,609 | 1,128,539 | 111,070 |
| – Gross Longs: | 320,048 | 3,031,053 | 259,610 |
| – Gross Shorts: | 1,559,657 | 1,902,514 | 148,540 |
| – Long to Short Ratio: | 0.2 to 1 | 1.6 to 1 | 1.7 to 1 |
| NET POSITION TREND: | |||
| – Strength Index Score (3 Year Range Pct): | 2.3 | 98.8 | 93.2 |
| – Strength Index Reading (3 Year Range): | Bearish-Extreme | Bullish-Extreme | Bullish-Extreme |
| NET POSITION MOVEMENT INDEX: | |||
| – 6-Week Change in Strength Index: | -10.6 | 12.0 | 0.6 |
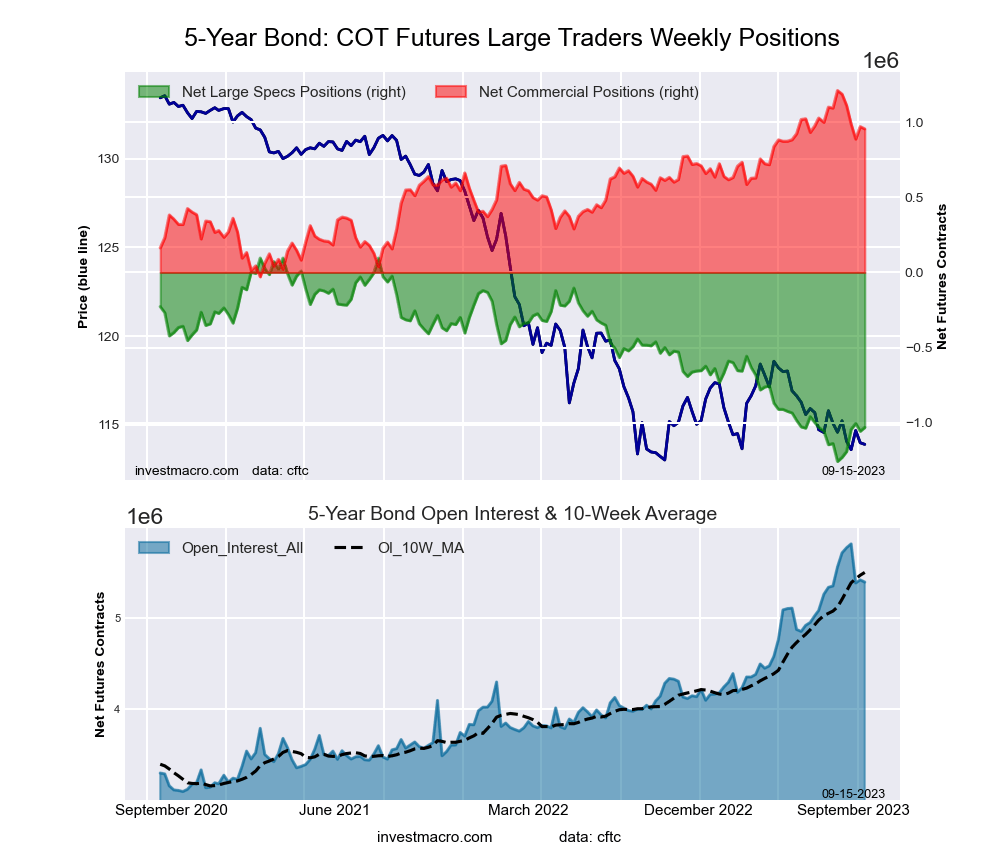
This week’s current strength score (the trader positioning range over the past three years, measured from 0 to 100) shows the speculators are currently Bearish-Extreme with a score of 16.7 percent. The commercials are Bullish with a score of 79.4 percent and the small traders (not shown in chart) are Bullish-Extreme with a score of 90.0 percent.
Our weekly trend-following model classifies the current market price position as: Downtrend. The current action for the model is considered to be: Hold – Maintain Short Position.
| 5-Year Treasury Note Statistics | SPECULATORS | COMMERCIALS | SMALL TRADERS |
| – Percent of Open Interest Longs: | 8.6 | 82.8 | 7.5 |
| – Percent of Open Interest Shorts: | 27.8 | 65.1 | 6.1 |
| – Net Position: | -1,031,030 | 954,444 | 76,586 |
| – Gross Longs: | 465,279 | 4,464,077 | 405,798 |
| – Gross Shorts: | 1,496,309 | 3,509,633 | 329,212 |
| – Long to Short Ratio: | 0.3 to 1 | 1.3 to 1 | 1.2 to 1 |
| NET POSITION TREND: | |||
| – Strength Index Score (3 Year Range Pct): | 16.7 | 79.4 | 90.0 |
| – Strength Index Reading (3 Year Range): | Bearish-Extreme | Bullish | Bullish-Extreme |
| NET POSITION MOVEMENT INDEX: | |||
| – 6-Week Change in Strength Index: | 16.7 | -20.6 | 7.1 |
This week’s current strength score (the trader positioning range over the past three years, measured from 0 to 100) shows the speculators are currently Bearish-Extreme with a score of 10.3 percent. The commercials are Bullish-Extreme with a score of 94.7 percent and the small traders (not shown in chart) are Bullish with a score of 78.8 percent.
Our weekly trend-following model classifies the current market price position as: Downtrend. The current action for the model is considered to be: Hold – Maintain Short Position.
| 10-Year Treasury Note Statistics | SPECULATORS | COMMERCIALS | SMALL TRADERS |
| – Percent of Open Interest Longs: | 10.0 | 79.3 | 8.6 |
| – Percent of Open Interest Shorts: | 25.9 | 63.9 | 8.1 |
| – Net Position: | -744,302 | 720,210 | 24,092 |
| – Gross Longs: | 467,114 | 3,712,430 | 404,705 |
| – Gross Shorts: | 1,211,416 | 2,992,220 | 380,613 |
| – Long to Short Ratio: | 0.4 to 1 | 1.2 to 1 | 1.1 to 1 |
| NET POSITION TREND: | |||
| – Strength Index Score (3 Year Range Pct): | 10.3 | 94.7 | 78.8 |
| – Strength Index Reading (3 Year Range): | Bearish-Extreme | Bullish-Extreme | Bullish |
| NET POSITION MOVEMENT INDEX: | |||
| – 6-Week Change in Strength Index: | -9.6 | 7.3 | 6.3 |
This week’s current strength score (the trader positioning range over the past three years, measured from 0 to 100) shows the speculators are currently Bearish-Extreme with a score of 14.6 percent. The commercials are Bullish-Extreme with a score of 84.3 percent and the small traders (not shown in chart) are Bullish with a score of 62.0 percent.
Our weekly trend-following model classifies the current market price position as: Weak Uptrend. The current action for the model is considered to be: Hold – Maintain Long Position.
| Ultra 10-Year Notes Statistics | SPECULATORS | COMMERCIALS | SMALL TRADERS |
| – Percent of Open Interest Longs: | 12.1 | 75.5 | 10.7 |
| – Percent of Open Interest Shorts: | 20.4 | 62.3 | 15.6 |
| – Net Position: | -146,433 | 233,935 | -87,502 |
| – Gross Longs: | 216,251 | 1,344,525 | 189,889 |
| – Gross Shorts: | 362,684 | 1,110,590 | 277,391 |
| – Long to Short Ratio: | 0.6 to 1 | 1.2 to 1 | 0.7 to 1 |
| NET POSITION TREND: | |||
| – Strength Index Score (3 Year Range Pct): | 14.6 | 84.3 | 62.0 |
| – Strength Index Reading (3 Year Range): | Bearish-Extreme | Bullish-Extreme | Bullish |
| NET POSITION MOVEMENT INDEX: | |||
| – 6-Week Change in Strength Index: | 7.9 | -9.4 | 2.9 |
This week’s current strength score (the trader positioning range over the past three years, measured from 0 to 100) shows the speculators are currently Bearish with a score of 21.9 percent. The commercials are Bullish with a score of 65.0 percent and the small traders (not shown in chart) are Bullish with a score of 77.6 percent.
Our weekly trend-following model classifies the current market price position as: Strong Downtrend. The current action for the model is considered to be: Hold – Maintain Short Position.
| US Treasury Bonds Statistics | SPECULATORS | COMMERCIALS | SMALL TRADERS |
| – Percent of Open Interest Longs: | 5.9 | 78.8 | 14.3 |
| – Percent of Open Interest Shorts: | 20.3 | 67.4 | 11.3 |
| – Net Position: | -192,687 | 152,663 | 40,024 |
| – Gross Longs: | 79,656 | 1,056,184 | 191,340 |
| – Gross Shorts: | 272,343 | 903,521 | 151,316 |
| – Long to Short Ratio: | 0.3 to 1 | 1.2 to 1 | 1.3 to 1 |
| NET POSITION TREND: | |||
| – Strength Index Score (3 Year Range Pct): | 21.9 | 65.0 | 77.6 |
| – Strength Index Reading (3 Year Range): | Bearish | Bullish | Bullish |
| NET POSITION MOVEMENT INDEX: | |||
| – 6-Week Change in Strength Index: | -2.0 | 0.0 | 4.3 |
This week’s current strength score (the trader positioning range over the past three years, measured from 0 to 100) shows the speculators are currently Bearish with a score of 32.1 percent. The commercials are Bullish with a score of 66.6 percent and the small traders (not shown in chart) are Bullish with a score of 68.5 percent.
Our weekly trend-following model classifies the current market price position as: Strong Downtrend. The current action for the model is considered to be: Hold – Maintain Short Position.
| Ultra US Treasury Bonds Statistics | SPECULATORS | COMMERCIALS | SMALL TRADERS |
| – Percent of Open Interest Longs: | 5.4 | 82.8 | 11.1 |
| – Percent of Open Interest Shorts: | 29.8 | 60.5 | 9.0 |
| – Net Position: | -376,925 | 343,799 | 33,126 |
| – Gross Longs: | 83,739 | 1,279,765 | 172,214 |
| – Gross Shorts: | 460,664 | 935,966 | 139,088 |
| – Long to Short Ratio: | 0.2 to 1 | 1.4 to 1 | 1.2 to 1 |
| NET POSITION TREND: | |||
| – Strength Index Score (3 Year Range Pct): | 32.1 | 66.6 | 68.5 |
| – Strength Index Reading (3 Year Range): | Bearish | Bullish | Bullish |
| NET POSITION MOVEMENT INDEX: | |||
| – 6-Week Change in Strength Index: | 32.1 | -33.4 | -10.1 |
Article By InvestMacro – Receive our weekly COT Newsletter
*COT Report: The COT data, released weekly to the public each Friday, is updated through the most recent Tuesday (data is 3 days old) and shows a quick view of how large speculators or non-commercials (for-profit traders) were positioned in the futures markets.
The CFTC categorizes trader positions according to commercial hedgers (traders who use futures contracts for hedging as part of the business), non-commercials (large traders who speculate to realize trading profits) and nonreportable traders (usually small traders/speculators) as well as their open interest (contracts open in the market at time of reporting). See CFTC criteria here.
By Jeffrey Young, Georgia Institute of Technology You’ve probably heard artificial intelligence models described as…
Source: Barry Dawes (7/23/26) Barry Dawes of Martin Place Securities shares his analysis of the…
By JustMarkets The US stock indices ended Thursday’s session with a notable decline amid a…
By Analytical Department RoboForex USD/JPY soared to 163.81 on Friday, marking a new 40-year high.…
By JustMarkets The US equities ended Wednesday’s session lower amid investor caution ahead of the…
By Analytical Department RoboForex EUR/USD rose to 1.1429 on Thursday, with the US dollar continuing…
This website uses cookies.