By InvestMacro | COT | Data Tables | COT Leaders | Downloads | COT Newsletter
Here are the latest charts and statistics for the Commitment of Traders (COT) data published by the Commodities Futures Trading Commission (CFTC).
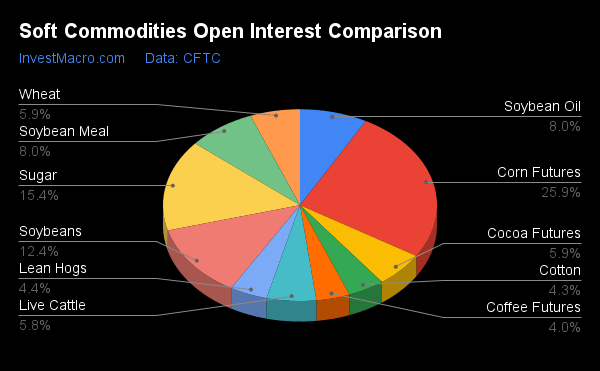
The latest COT data is updated through Tuesday August 30th (COT Week 35) and shows a quick view of how large traders (for-profit speculators and commercial entities) were positioned in the futures markets.
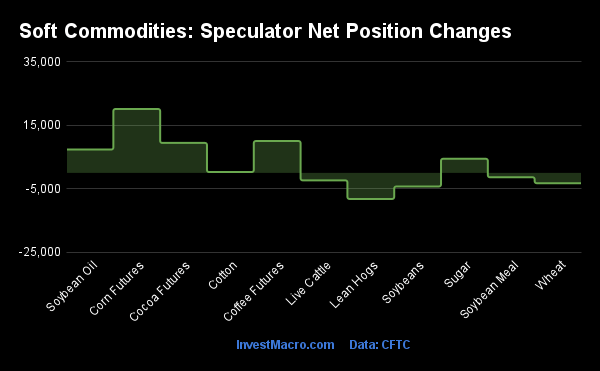
COT soft commodities speculator bets were slightly higher this week as six out of the eleven soft commodities markets we cover had higher positioning this week while the other five markets had lower contracts.
Leading the gains for soft commodities markets was Corn (20,154 contracts) and Coffee (10,054 contracts) with Cocoa (9,461 contracts), Soybean Oil (7,381 contracts), Sugar (4,464 contracts) and Cotton (282 contracts) also showing a positive weeks.
Free Reports:
The softs markets leading the declines in speculator bets this week was Lean Hogs (-8,204 contracts) with Soybeans (-4,274 contracts), Wheat (-3,243 contracts), Live Cattle (-2,346 contracts) and Soybean Meal (-1,365 contracts) also registering lower bets on the week.
| Aug-30-2022 | OI | OI-Index | Spec-Net | Spec-Index | Com-Net | COM-Index | Smalls-Net | Smalls-Index |
|---|---|---|---|---|---|---|---|---|
| WTI Crude | 1,470,207 | 0 | 229,189 | 5 | -256,248 | 95 | 27,059 | 48 |
| Gold | 459,165 | 2 | 117,734 | 10 | -129,679 | 92 | 11,945 | 2 |
| Silver | 138,714 | 6 | -8,271 | 0 | 265 | 100 | 8,006 | 8 |
| Copper | 158,390 | 0 | -23,255 | 19 | 24,985 | 83 | -1,730 | 15 |
| Palladium | 5,875 | 0 | -1,129 | 16 | 1,323 | 82 | -194 | 33 |
| Platinum | 70,747 | 40 | -5,378 | 1 | 646 | 99 | 4,732 | 28 |
| Natural Gas | 978,881 | 4 | -128,765 | 40 | 92,463 | 60 | 36,302 | 66 |
| Brent | 180,952 | 24 | -40,013 | 44 | 36,585 | 54 | 3,428 | 56 |
| Heating Oil | 283,427 | 29 | 25,196 | 79 | -43,761 | 25 | 18,565 | 63 |
| Soybeans | 605,924 | 7 | 83,562 | 40 | -52,791 | 68 | -30,771 | 19 |
| Corn | 1,267,735 | 0 | 283,397 | 66 | -225,759 | 40 | -57,638 | 10 |
| Coffee | 193,889 | 7 | 48,687 | 81 | -50,983 | 23 | 2,296 | 21 |
| Sugar | 752,642 | 9 | 62,551 | 49 | -72,593 | 54 | 10,042 | 20 |
| Wheat | 288,545 | 0 | -11,499 | 4 | 14,914 | 81 | -3,415 | 93 |
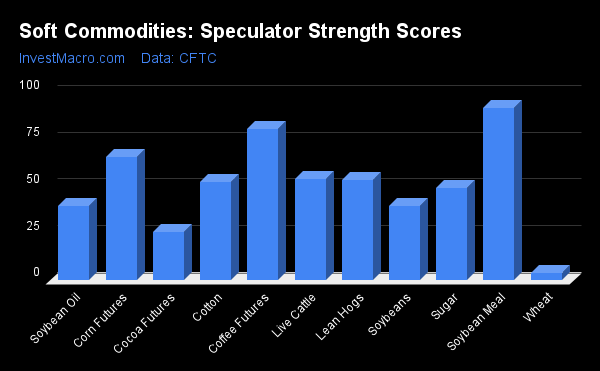
Strength Scores (a normalized measure of Speculator positions over a 3-Year range, from 0 to 100 where above 80 is extreme bullish and below 20 is extreme bearish) showed that Soybean Meal (92.2 percent) and Coffee (80.9 percent) lead the soft commodity markets and are both in bullish extreme positions (above 80 percent). Corn (66.2 percent) comes in as the next highest soft commodity markets market in strength scores.
On the downside, Wheat (4.1 percent) comes in at the lowest strength level currently and is in a bearish extreme state (below 20 percent). Cocoa (25.8 percent) comes in as the next lowest followed by Soybeans (39.6 percent) and Soybean Oil (40.0 percent).
Strength Statistics:
Corn (66.2 percent) vs Corn previous week (63.7 percent)
Sugar (49.5 percent) vs Sugar previous week (48.6 percent)
Coffee (80.9 percent) vs Coffee previous week (72.2 percent)
Soybeans (39.6 percent) vs Soybeans previous week (40.9 percent)
Soybean Oil (40.0 percent) vs Soybean Oil previous week (34.9 percent)
Soybean Meal (92.2 percent) vs Soybean Meal previous week (92.9 percent)
Live Cattle (54.3 percent) vs Live Cattle previous week (57.2 percent)
Lean Hogs (53.8 percent) vs Lean Hogs previous week (62.7 percent)
Cotton (52.7 percent) vs Cotton previous week (52.5 percent)
Cocoa (25.8 percent) vs Cocoa previous week (16.5 percent)
Wheat (4.1 percent) vs Wheat previous week (8.3 percent)
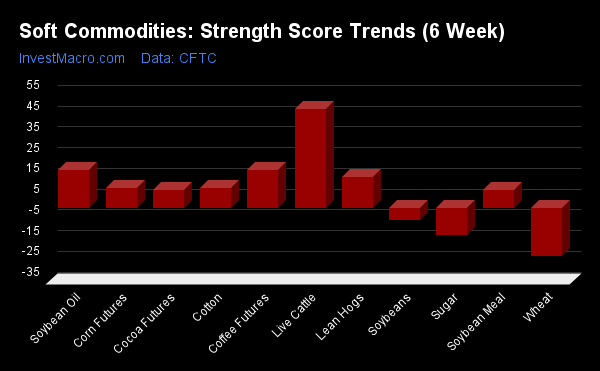
Strength Score Trends (or move index, calculates the 6-week changes in strength scores) showed that Live Cattle (47.4 percent) leads the past six weeks trends for soft commodity markets this week. Soybean Oil (18.3 percent), Coffee (17.9 percent) and Lean Hogs (14.8 percent) fill out the top movers in the latest trends data.
Wheat (-23.5 percent) leads the downside trend scores currently while the next market with lower trend scores were Sugar (-13.3 percent) followed by Soybeans (-5.8 percent).
Strength Trend Statistics:
Corn (9.4 percent) vs Corn previous week (2.1 percent)
Sugar (-13.3 percent) vs Sugar previous week (-9.8 percent)
Coffee (17.9 percent) vs Coffee previous week (3.7 percent)
Soybeans (-5.8 percent) vs Soybeans previous week (-8.3 percent)
Soybean Oil (18.3 percent) vs Soybean Oil previous week (11.5 percent)
Soybean Meal (8.6 percent) vs Soybean Meal previous week (9.6 percent)
Live Cattle (47.4 percent) vs Live Cattle previous week (50.4 percent)
Lean Hogs (14.8 percent) vs Lean Hogs previous week (28.7 percent)
Cotton (9.5 percent) vs Cotton previous week (6.0 percent)
Cocoa (8.7 percent) vs Cocoa previous week (3.0 percent)
Wheat (-23.5 percent) vs Wheat previous week (-16.8 percent)
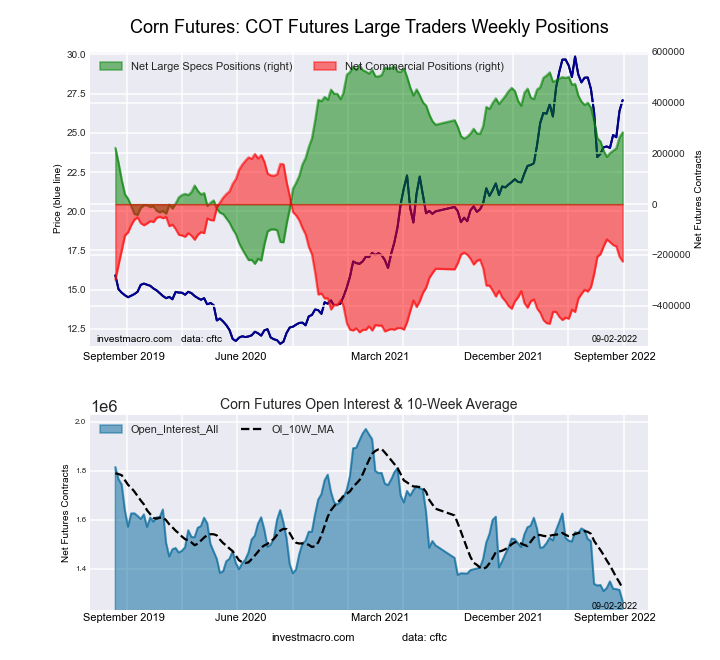
This week’s current strength score (the trader positioning range over the past three years, measured from 0 to 100) shows the speculators are currently Bullish with a score of 66.2 percent. The commercials are Bearish with a score of 39.7 percent and the small traders (not shown in chart) are Bearish-Extreme with a score of 9.9 percent.
| CORN Futures Statistics | SPECULATORS | COMMERCIALS | SMALL TRADERS |
| – Percent of Open Interest Longs: | 31.7 | 47.0 | 9.1 |
| – Percent of Open Interest Shorts: | 9.4 | 64.8 | 13.6 |
| – Net Position: | 283,397 | -225,759 | -57,638 |
| – Gross Longs: | 402,312 | 595,440 | 115,050 |
| – Gross Shorts: | 118,915 | 821,199 | 172,688 |
| – Long to Short Ratio: | 3.4 to 1 | 0.7 to 1 | 0.7 to 1 |
| NET POSITION TREND: | |||
| – Strength Index Score (3 Year Range Pct): | 66.2 | 39.7 | 9.9 |
| – Strength Index Reading (3 Year Range): | Bullish | Bearish | Bearish-Extreme |
| NET POSITION MOVEMENT INDEX: | |||
| – 6-Week Change in Strength Index: | 9.4 | -8.6 | -7.6 |
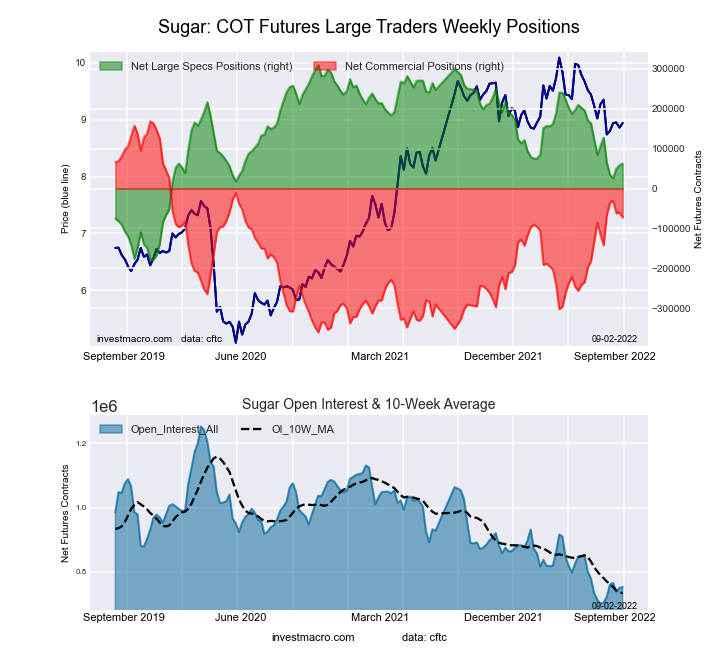
This week’s current strength score (the trader positioning range over the past three years, measured from 0 to 100) shows the speculators are currently Bearish with a score of 49.5 percent. The commercials are Bullish with a score of 54.4 percent and the small traders (not shown in chart) are Bearish with a score of 20.3 percent.
| SUGAR Futures Statistics | SPECULATORS | COMMERCIALS | SMALL TRADERS |
| – Percent of Open Interest Longs: | 23.3 | 53.5 | 8.8 |
| – Percent of Open Interest Shorts: | 15.0 | 63.1 | 7.5 |
| – Net Position: | 62,551 | -72,593 | 10,042 |
| – Gross Longs: | 175,450 | 402,664 | 66,576 |
| – Gross Shorts: | 112,899 | 475,257 | 56,534 |
| – Long to Short Ratio: | 1.6 to 1 | 0.8 to 1 | 1.2 to 1 |
| NET POSITION TREND: | |||
| – Strength Index Score (3 Year Range Pct): | 49.5 | 54.4 | 20.3 |
| – Strength Index Reading (3 Year Range): | Bearish | Bullish | Bearish |
| NET POSITION MOVEMENT INDEX: | |||
| – 6-Week Change in Strength Index: | -13.3 | 13.1 | -5.7 |
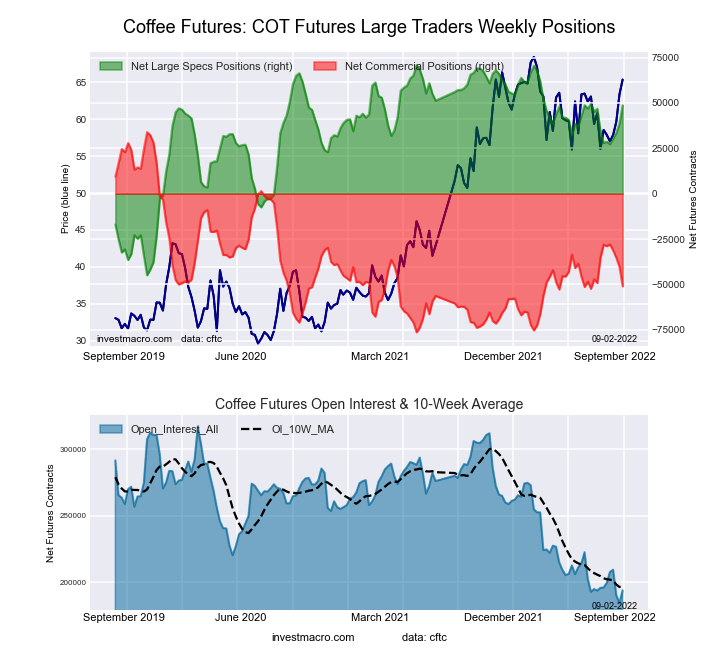
This week’s current strength score (the trader positioning range over the past three years, measured from 0 to 100) shows the speculators are currently Bullish-Extreme with a score of 80.9 percent. The commercials are Bearish with a score of 23.0 percent and the small traders (not shown in chart) are Bearish with a score of 20.6 percent.
| COFFEE Futures Statistics | SPECULATORS | COMMERCIALS | SMALL TRADERS |
| – Percent of Open Interest Longs: | 31.7 | 45.0 | 4.9 |
| – Percent of Open Interest Shorts: | 6.6 | 71.3 | 3.7 |
| – Net Position: | 48,687 | -50,983 | 2,296 |
| – Gross Longs: | 61,416 | 87,194 | 9,555 |
| – Gross Shorts: | 12,729 | 138,177 | 7,259 |
| – Long to Short Ratio: | 4.8 to 1 | 0.6 to 1 | 1.3 to 1 |
| NET POSITION TREND: | |||
| – Strength Index Score (3 Year Range Pct): | 80.9 | 23.0 | 20.6 |
| – Strength Index Reading (3 Year Range): | Bullish-Extreme | Bearish | Bearish |
| NET POSITION MOVEMENT INDEX: | |||
| – 6-Week Change in Strength Index: | 17.9 | -20.8 | 20.6 |
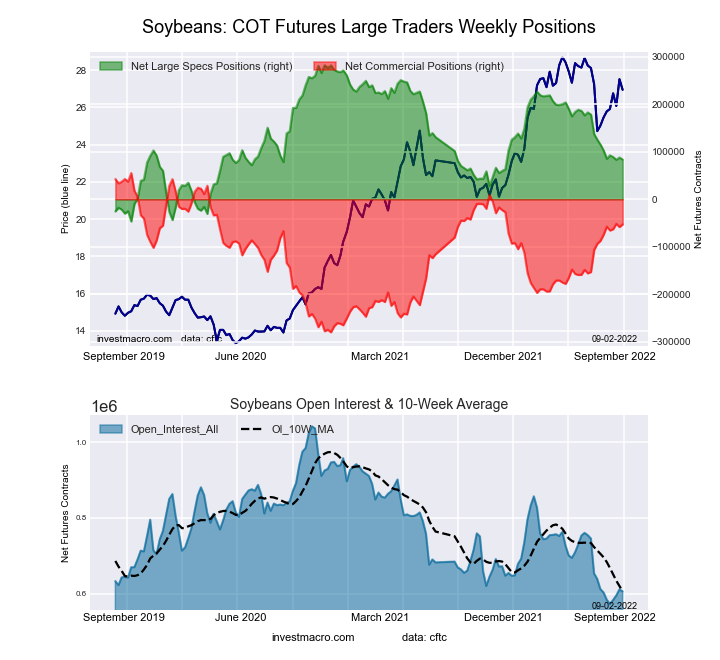
This week’s current strength score (the trader positioning range over the past three years, measured from 0 to 100) shows the speculators are currently Bearish with a score of 39.6 percent. The commercials are Bullish with a score of 67.8 percent and the small traders (not shown in chart) are Bearish-Extreme with a score of 19.0 percent.
| SOYBEANS Futures Statistics | SPECULATORS | COMMERCIALS | SMALL TRADERS |
| – Percent of Open Interest Longs: | 25.7 | 55.3 | 6.2 |
| – Percent of Open Interest Shorts: | 11.9 | 64.0 | 11.3 |
| – Net Position: | 83,562 | -52,791 | -30,771 |
| – Gross Longs: | 155,472 | 335,048 | 37,513 |
| – Gross Shorts: | 71,910 | 387,839 | 68,284 |
| – Long to Short Ratio: | 2.2 to 1 | 0.9 to 1 | 0.5 to 1 |
| NET POSITION TREND: | |||
| – Strength Index Score (3 Year Range Pct): | 39.6 | 67.8 | 19.0 |
| – Strength Index Reading (3 Year Range): | Bearish | Bullish | Bearish-Extreme |
| NET POSITION MOVEMENT INDEX: | |||
| – 6-Week Change in Strength Index: | -5.8 | 6.5 | -4.4 |
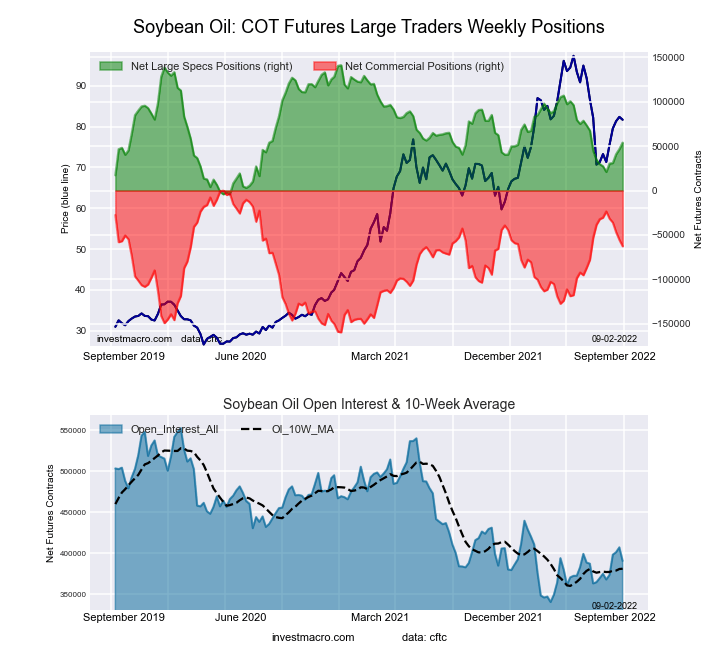
This week’s current strength score (the trader positioning range over the past three years, measured from 0 to 100) shows the speculators are currently Bearish with a score of 40.0 percent. The commercials are Bullish with a score of 60.8 percent and the small traders (not shown in chart) are Bearish with a score of 46.1 percent.
| SOYBEAN OIL Futures Statistics | SPECULATORS | COMMERCIALS | SMALL TRADERS |
| – Percent of Open Interest Longs: | 21.2 | 51.7 | 7.6 |
| – Percent of Open Interest Shorts: | 7.4 | 67.8 | 5.4 |
| – Net Position: | 53,958 | -62,711 | 8,753 |
| – Gross Longs: | 83,033 | 202,095 | 29,895 |
| – Gross Shorts: | 29,075 | 264,806 | 21,142 |
| – Long to Short Ratio: | 2.9 to 1 | 0.8 to 1 | 1.4 to 1 |
| NET POSITION TREND: | |||
| – Strength Index Score (3 Year Range Pct): | 40.0 | 60.8 | 46.1 |
| – Strength Index Reading (3 Year Range): | Bearish | Bullish | Bearish |
| NET POSITION MOVEMENT INDEX: | |||
| – 6-Week Change in Strength Index: | 18.3 | -20.2 | 21.0 |
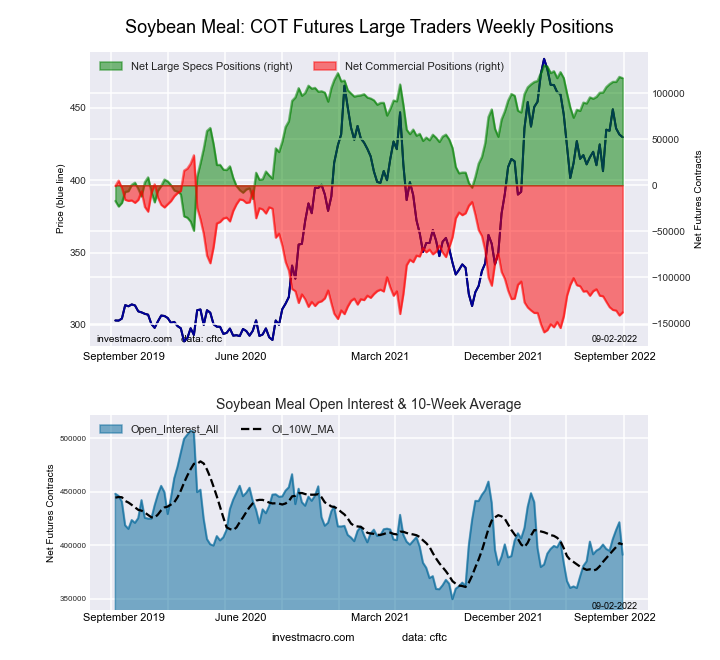
This week’s current strength score (the trader positioning range over the past three years, measured from 0 to 100) shows the speculators are currently Bullish-Extreme with a score of 92.2 percent. The commercials are Bearish-Extreme with a score of 11.3 percent and the small traders (not shown in chart) are Bearish with a score of 45.1 percent.
| SOYBEAN MEAL Futures Statistics | SPECULATORS | COMMERCIALS | SMALL TRADERS |
| – Percent of Open Interest Longs: | 32.4 | 43.0 | 12.0 |
| – Percent of Open Interest Shorts: | 2.7 | 78.3 | 6.4 |
| – Net Position: | 116,189 | -137,835 | 21,646 |
| – Gross Longs: | 126,866 | 168,316 | 46,829 |
| – Gross Shorts: | 10,677 | 306,151 | 25,183 |
| – Long to Short Ratio: | 11.9 to 1 | 0.5 to 1 | 1.9 to 1 |
| NET POSITION TREND: | |||
| – Strength Index Score (3 Year Range Pct): | 92.2 | 11.3 | 45.1 |
| – Strength Index Reading (3 Year Range): | Bullish-Extreme | Bearish-Extreme | Bearish |
| NET POSITION MOVEMENT INDEX: | |||
| – 6-Week Change in Strength Index: | 8.6 | -9.1 | 10.4 |
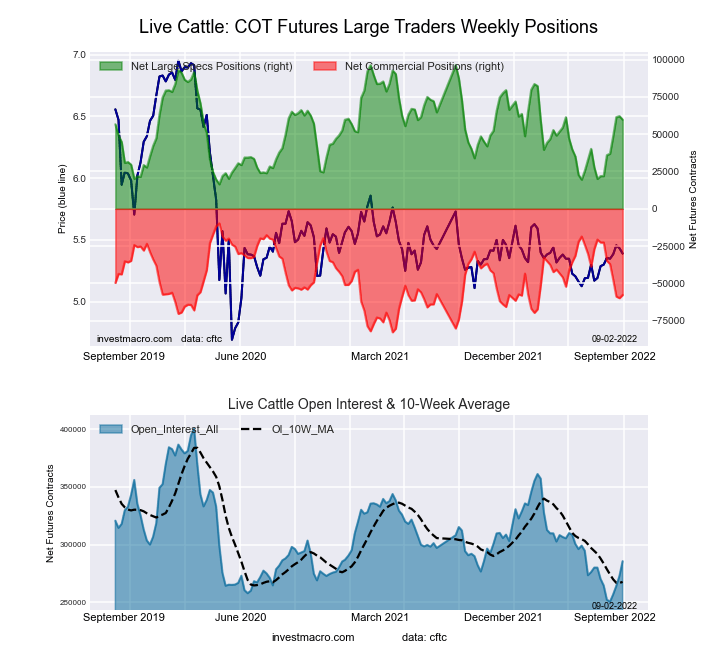
This week’s current strength score (the trader positioning range over the past three years, measured from 0 to 100) shows the speculators are currently Bullish with a score of 54.3 percent. The commercials are Bearish with a score of 34.2 percent and the small traders (not shown in chart) are Bullish with a score of 77.7 percent.
| LIVE CATTLE Futures Statistics | SPECULATORS | COMMERCIALS | SMALL TRADERS |
| – Percent of Open Interest Longs: | 38.1 | 32.9 | 11.3 |
| – Percent of Open Interest Shorts: | 17.2 | 53.1 | 12.0 |
| – Net Position: | 59,731 | -57,725 | -2,006 |
| – Gross Longs: | 108,976 | 93,974 | 32,255 |
| – Gross Shorts: | 49,245 | 151,699 | 34,261 |
| – Long to Short Ratio: | 2.2 to 1 | 0.6 to 1 | 0.9 to 1 |
| NET POSITION TREND: | |||
| – Strength Index Score (3 Year Range Pct): | 54.3 | 34.2 | 77.7 |
| – Strength Index Reading (3 Year Range): | Bullish | Bearish | Bullish |
| NET POSITION MOVEMENT INDEX: | |||
| – 6-Week Change in Strength Index: | 47.4 | -48.2 | -9.3 |
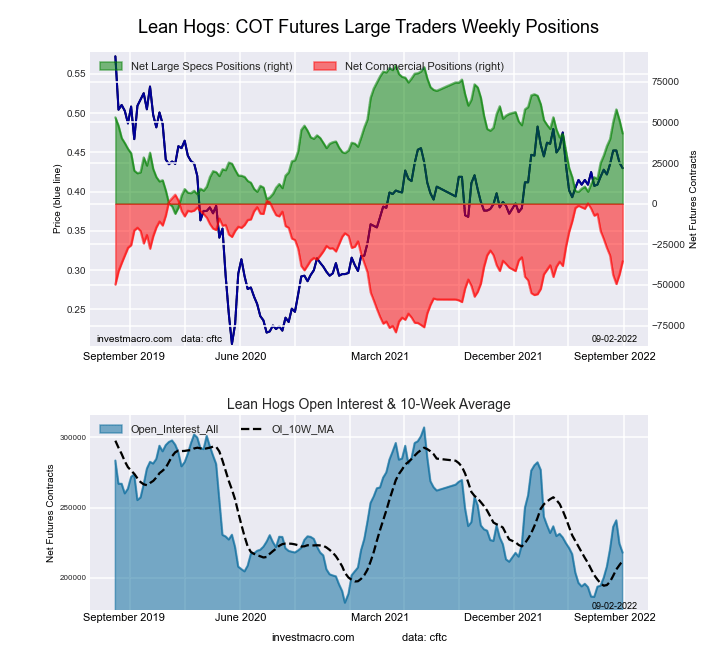
This week’s current strength score (the trader positioning range over the past three years, measured from 0 to 100) shows the speculators are currently Bullish with a score of 53.8 percent. The commercials are Bullish with a score of 51.6 percent and the small traders (not shown in chart) are Bullish with a score of 56.2 percent.
| LEAN HOGS Futures Statistics | SPECULATORS | COMMERCIALS | SMALL TRADERS |
| – Percent of Open Interest Longs: | 39.0 | 36.0 | 8.9 |
| – Percent of Open Interest Shorts: | 19.2 | 52.3 | 12.5 |
| – Net Position: | 43,199 | -35,424 | -7,775 |
| – Gross Longs: | 84,944 | 78,505 | 19,440 |
| – Gross Shorts: | 41,745 | 113,929 | 27,215 |
| – Long to Short Ratio: | 2.0 to 1 | 0.7 to 1 | 0.7 to 1 |
| NET POSITION TREND: | |||
| – Strength Index Score (3 Year Range Pct): | 53.8 | 51.6 | 56.2 |
| – Strength Index Reading (3 Year Range): | Bullish | Bullish | Bullish |
| NET POSITION MOVEMENT INDEX: | |||
| – 6-Week Change in Strength Index: | 14.8 | -16.2 | 0.9 |
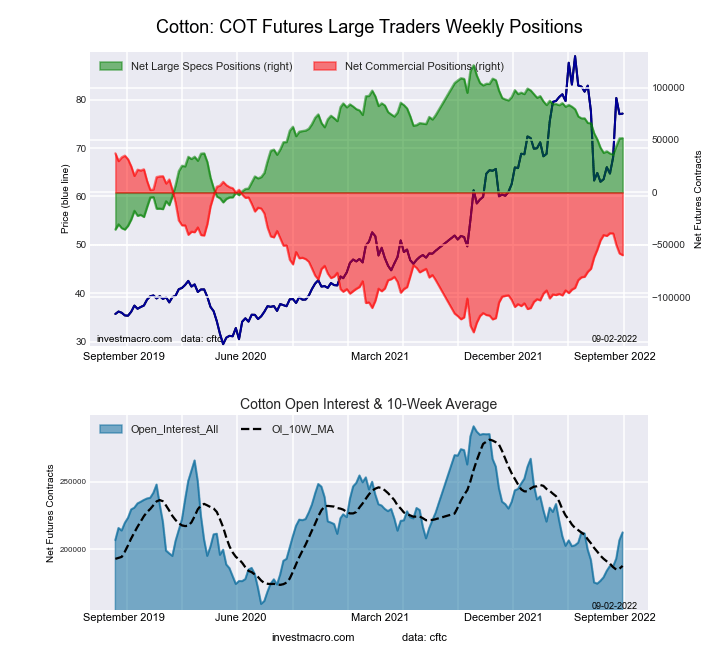
This week’s current strength score (the trader positioning range over the past three years, measured from 0 to 100) shows the speculators are currently Bullish with a score of 52.7 percent. The commercials are Bearish with a score of 46.5 percent and the small traders (not shown in chart) are Bullish with a score of 62.1 percent.
| COTTON Futures Statistics | SPECULATORS | COMMERCIALS | SMALL TRADERS |
| – Percent of Open Interest Longs: | 37.0 | 43.7 | 7.2 |
| – Percent of Open Interest Shorts: | 12.6 | 71.8 | 3.4 |
| – Net Position: | 51,767 | -59,761 | 7,994 |
| – Gross Longs: | 78,599 | 92,717 | 15,280 |
| – Gross Shorts: | 26,832 | 152,478 | 7,286 |
| – Long to Short Ratio: | 2.9 to 1 | 0.6 to 1 | 2.1 to 1 |
| NET POSITION TREND: | |||
| – Strength Index Score (3 Year Range Pct): | 52.7 | 46.5 | 62.1 |
| – Strength Index Reading (3 Year Range): | Bullish | Bearish | Bullish |
| NET POSITION MOVEMENT INDEX: | |||
| – 6-Week Change in Strength Index: | 9.5 | -12.1 | 33.1 |
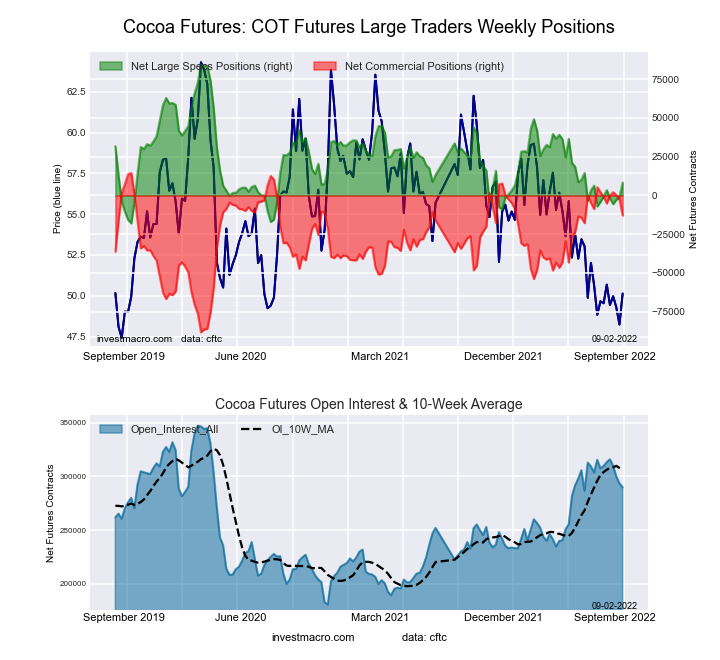
This week’s current strength score (the trader positioning range over the past three years, measured from 0 to 100) shows the speculators are currently Bearish with a score of 25.8 percent. The commercials are Bullish with a score of 73.3 percent and the small traders (not shown in chart) are Bearish with a score of 43.1 percent.
| COCOA Futures Statistics | SPECULATORS | COMMERCIALS | SMALL TRADERS |
| – Percent of Open Interest Longs: | 33.4 | 45.4 | 4.8 |
| – Percent of Open Interest Shorts: | 30.6 | 49.9 | 3.2 |
| – Net Position: | 8,311 | -12,968 | 4,657 |
| – Gross Longs: | 96,892 | 131,596 | 13,945 |
| – Gross Shorts: | 88,581 | 144,564 | 9,288 |
| – Long to Short Ratio: | 1.1 to 1 | 0.9 to 1 | 1.5 to 1 |
| NET POSITION TREND: | |||
| – Strength Index Score (3 Year Range Pct): | 25.8 | 73.3 | 43.1 |
| – Strength Index Reading (3 Year Range): | Bearish | Bullish | Bearish |
| NET POSITION MOVEMENT INDEX: | |||
| – 6-Week Change in Strength Index: | 8.7 | -11.6 | 30.4 |
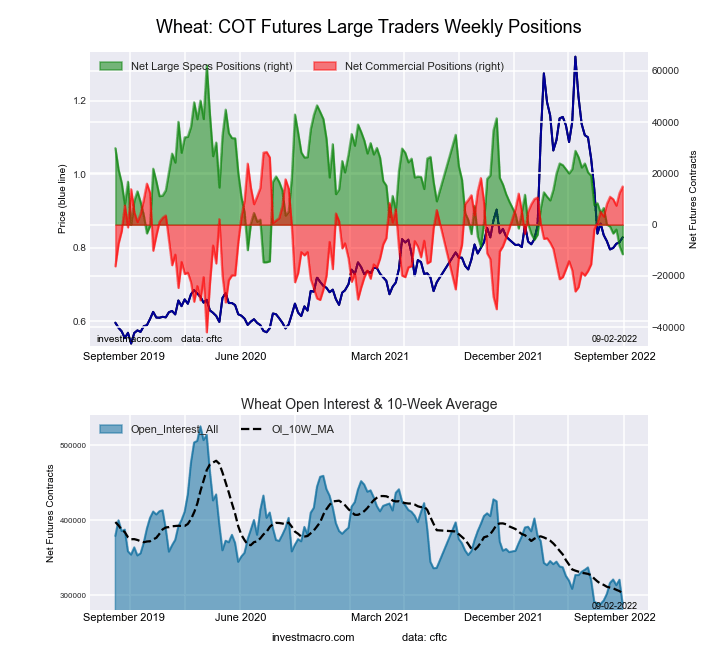
This week’s current strength score (the trader positioning range over the past three years, measured from 0 to 100) shows the speculators are currently Bearish-Extreme with a score of 4.1 percent. The commercials are Bullish-Extreme with a score of 80.9 percent and the small traders (not shown in chart) are Bullish-Extreme with a score of 92.7 percent.
| WHEAT Futures Statistics | SPECULATORS | COMMERCIALS | SMALL TRADERS |
| – Percent of Open Interest Longs: | 30.9 | 41.5 | 10.2 |
| – Percent of Open Interest Shorts: | 34.9 | 36.3 | 11.4 |
| – Net Position: | -11,499 | 14,914 | -3,415 |
| – Gross Longs: | 89,300 | 119,733 | 29,557 |
| – Gross Shorts: | 100,799 | 104,819 | 32,972 |
| – Long to Short Ratio: | 0.9 to 1 | 1.1 to 1 | 0.9 to 1 |
| NET POSITION TREND: | |||
| – Strength Index Score (3 Year Range Pct): | 4.1 | 80.9 | 92.7 |
| – Strength Index Reading (3 Year Range): | Bearish-Extreme | Bullish-Extreme | Bullish-Extreme |
| NET POSITION MOVEMENT INDEX: | |||
| – 6-Week Change in Strength Index: | -23.5 | 16.7 | 32.6 |
Article By InvestMacro – Receive our weekly COT Reports by Email
*COT Report: The COT data, released weekly to the public each Friday, is updated through the most recent Tuesday (data is 3 days old) and shows a quick view of how large speculators or non-commercials (for-profit traders) were positioned in the futures markets.
The CFTC categorizes trader positions according to commercial hedgers (traders who use futures contracts for hedging as part of the business), non-commercials (large traders who speculate to realize trading profits) and nonreportable traders (usually small traders/speculators) as well as their open interest (contracts open in the market at time of reporting). See CFTC criteria here.
By Jeffrey Young, Georgia Institute of Technology You’ve probably heard artificial intelligence models described as…
Source: Barry Dawes (7/23/26) Barry Dawes of Martin Place Securities shares his analysis of the…
By JustMarkets The US stock indices ended Thursday’s session with a notable decline amid a…
By Analytical Department RoboForex USD/JPY soared to 163.81 on Friday, marking a new 40-year high.…
By JustMarkets The US equities ended Wednesday’s session lower amid investor caution ahead of the…
By Analytical Department RoboForex EUR/USD rose to 1.1429 on Thursday, with the US dollar continuing…
This website uses cookies.