By InvestMacro | COT | Data Tables | COT Leaders | Downloads | COT Newsletter
Here are the latest charts and statistics for the Commitment of Traders (COT) data published by the Commodities Futures Trading Commission (CFTC).
The latest COT data is updated through Tuesday June 28th and shows a quick view of how large traders (for-profit speculators and commercial entities) were positioned in the futures markets.
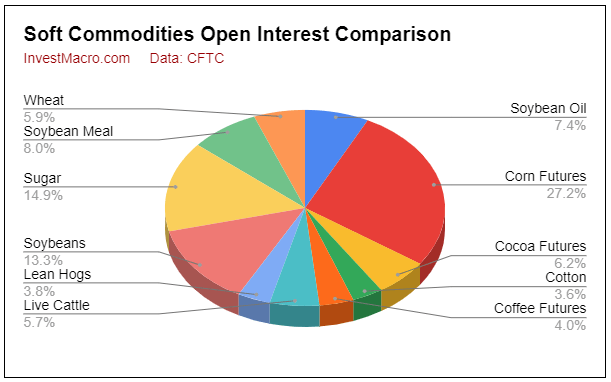
The soft commodities market speculator bets were sharply lower this week as just two out of the eleven soft commodities markets we cover had higher positioning this week while nine markets had lower contracts.
Leading the gains for soft commodities markets was Lean Hogs (4,228 contracts) and Cocoa (3,034 contracts) as the only markets showing positive weeks. Meanwhile, leading the declines in speculator bets this week were Corn (-52,067 contracts), Soybeans (-41,186 contracts) and Sugar (-40,402 contracts) with Soybean Oil (-22,612 contracts), Live Cattle (-12,287 contracts), Wheat (-11,388 contracts), Cotton (-9,655 contracts), Coffee (-4,171 contracts) and Soybean Meal (-1,446 contracts) also registering lower bets on the week.
Free Reports:
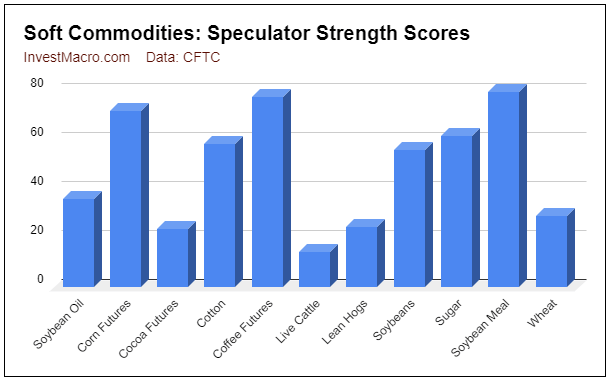
Strength scores (measuring the 3-Year range of Speculator positions, from 0 to 100 where above 80 percent is extreme bullish and below 20 percent is extreme bearish) show that Soybean Meal (80 percent) is leading the speculator strength positions at an extreme bullish score. Coffee (78 percent) and Corn (72 percent) are the next highest in strength scores. Live Cattle (14 percent) is the lone extreme bearish market with Cocoa (24 percent) coming in as the next lowest.
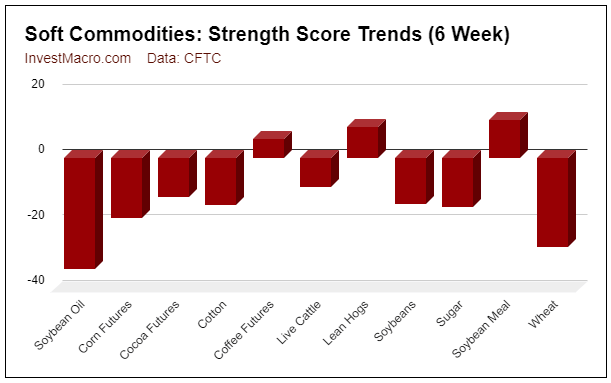
Strength score trends (or move index, that calculate 6-week changes in strength scores) shows the trends for soft commodities are on the downside with eight out of the eleven markets showing negative trends. Soybean Oil (-34 percent) and Wheat (-28 percent) are leading the negative scores currently. The only markets with positive scores this week are Coffee (6 percent), Lean Hogs (9 percent) and Soybean Meal (12 percent).
| Jun-28-2022 | OI | OI-Index | Spec-Net | Spec-Index | Com-Net | COM-Index | Smalls-Net | Smalls-Index |
|---|---|---|---|---|---|---|---|---|
| WTI Crude | 1,651,566 | 0 | 299,692 | 3 | -327,938 | 99 | 28,246 | 55 |
| Gold | 497,005 | 13 | 157,693 | 2 | -182,007 | 98 | 24,314 | 16 |
| Silver | 135,775 | 3 | 10,891 | 0 | -18,485 | 100 | 7,594 | 0 |
| Copper | 182,352 | 14 | -30,696 | 20 | 31,197 | 81 | -501 | 22 |
| Palladium | 7,765 | 6 | -3,825 | 1 | 4,441 | 100 | -616 | 8 |
| Platinum | 68,232 | 36 | -1,306 | 2 | -3,381 | 100 | 4,687 | 27 |
| Natural Gas | 987,740 | 0 | -129,419 | 40 | 90,840 | 60 | 38,579 | 71 |
| Brent | 173,920 | 19 | -42,677 | 40 | 41,434 | 62 | 1,243 | 26 |
| Heating Oil | 269,168 | 23 | 7,508 | 53 | -25,743 | 44 | 18,235 | 62 |
| Soybeans | 653,337 | 11 | 137,193 | 56 | -106,705 | 52 | -30,488 | 20 |
| Corn | 1,338,054 | 0 | 328,102 | 72 | -274,110 | 33 | -53,992 | 12 |
| Coffee | 194,896 | 2 | 45,200 | 78 | -47,147 | 26 | 1,947 | 9 |
| Sugar | 734,324 | 0 | 122,709 | 62 | -132,877 | 43 | 10,168 | 20 |
| Wheat | 291,041 | 0 | 7,679 | 29 | -1,871 | 57 | -5,808 | 80 |
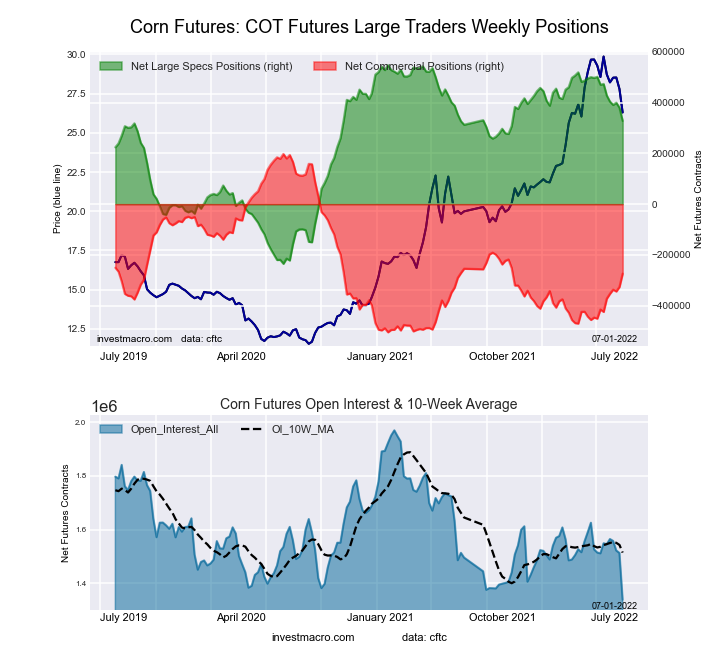
This week’s current strength score (the trader positioning range over the past three years, measured from 0 to 100) shows the speculators are currently Bullish with a score of 71.9 percent. The commercials are Bearish with a score of 32.9 percent and the small traders (not shown in chart) are Bearish-Extreme with a score of 12.0 percent.
| CORN Futures Statistics | SPECULATORS | COMMERCIALS | SMALL TRADERS |
| – Percent of Open Interest Longs: | 32.4 | 44.6 | 9.4 |
| – Percent of Open Interest Shorts: | 7.9 | 65.1 | 13.4 |
| – Net Position: | 328,102 | -274,110 | -53,992 |
| – Gross Longs: | 433,710 | 597,265 | 125,886 |
| – Gross Shorts: | 105,608 | 871,375 | 179,878 |
| – Long to Short Ratio: | 4.1 to 1 | 0.7 to 1 | 0.7 to 1 |
| NET POSITION TREND: | |||
| – Strength Index Score (3 Year Range Pct): | 71.9 | 32.9 | 12.0 |
| – Strength Index Reading (3 Year Range): | Bullish | Bearish | Bearish-Extreme |
| NET POSITION MOVEMENT INDEX: | |||
| – 6-Week Change in Strength Index: | -18.6 | 21.4 | -2.9 |
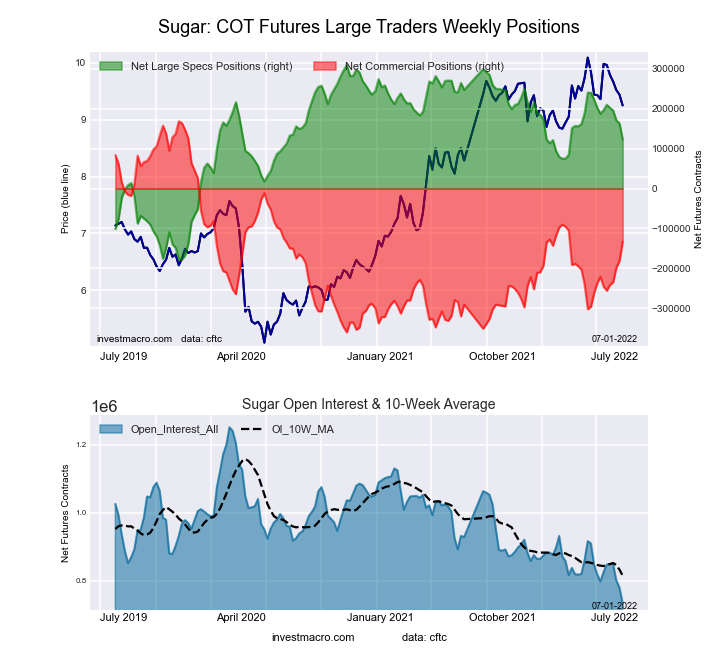
This week’s current strength score (the trader positioning range over the past three years, measured from 0 to 100) shows the speculators are currently Bullish with a score of 61.8 percent. The commercials are Bearish with a score of 43.0 percent and the small traders (not shown in chart) are Bearish with a score of 20.4 percent.
| SUGAR Futures Statistics | SPECULATORS | COMMERCIALS | SMALL TRADERS |
| – Percent of Open Interest Longs: | 28.7 | 49.2 | 9.1 |
| – Percent of Open Interest Shorts: | 12.0 | 67.3 | 7.7 |
| – Net Position: | 122,709 | -132,877 | 10,168 |
| – Gross Longs: | 210,575 | 361,005 | 66,813 |
| – Gross Shorts: | 87,866 | 493,882 | 56,645 |
| – Long to Short Ratio: | 2.4 to 1 | 0.7 to 1 | 1.2 to 1 |
| NET POSITION TREND: | |||
| – Strength Index Score (3 Year Range Pct): | 61.8 | 43.0 | 20.4 |
| – Strength Index Reading (3 Year Range): | Bullish | Bearish | Bearish |
| NET POSITION MOVEMENT INDEX: | |||
| – 6-Week Change in Strength Index: | -15.2 | 21.3 | -47.7 |
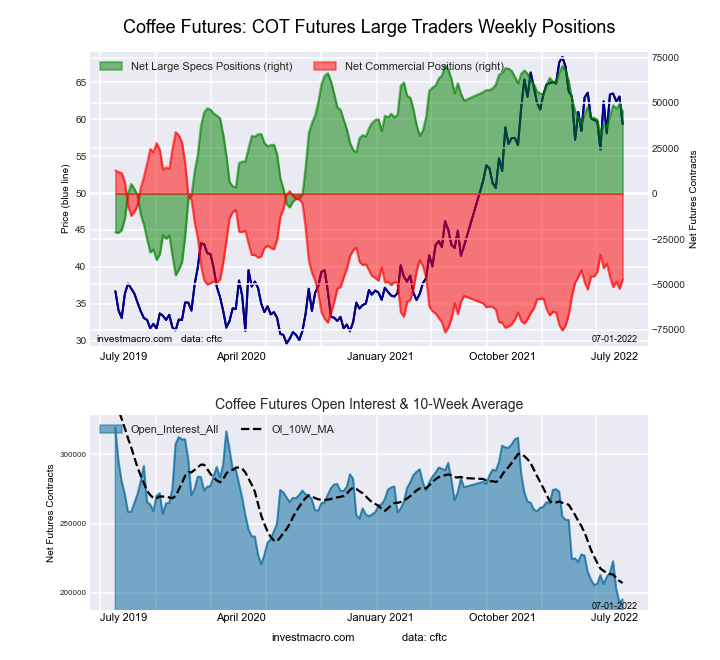
This week’s current strength score (the trader positioning range over the past three years, measured from 0 to 100) shows the speculators are currently Bullish with a score of 77.9 percent. The commercials are Bearish with a score of 26.5 percent and the small traders (not shown in chart) are Bearish-Extreme with a score of 9.5 percent.
| COFFEE Futures Statistics | SPECULATORS | COMMERCIALS | SMALL TRADERS |
| – Percent of Open Interest Longs: | 28.5 | 49.4 | 4.1 |
| – Percent of Open Interest Shorts: | 5.3 | 73.6 | 3.1 |
| – Net Position: | 45,200 | -47,147 | 1,947 |
| – Gross Longs: | 55,545 | 96,232 | 8,006 |
| – Gross Shorts: | 10,345 | 143,379 | 6,059 |
| – Long to Short Ratio: | 5.4 to 1 | 0.7 to 1 | 1.3 to 1 |
| NET POSITION TREND: | |||
| – Strength Index Score (3 Year Range Pct): | 77.9 | 26.5 | 9.5 |
| – Strength Index Reading (3 Year Range): | Bullish | Bearish | Bearish-Extreme |
| NET POSITION MOVEMENT INDEX: | |||
| – 6-Week Change in Strength Index: | 5.8 | -5.6 | -5.2 |
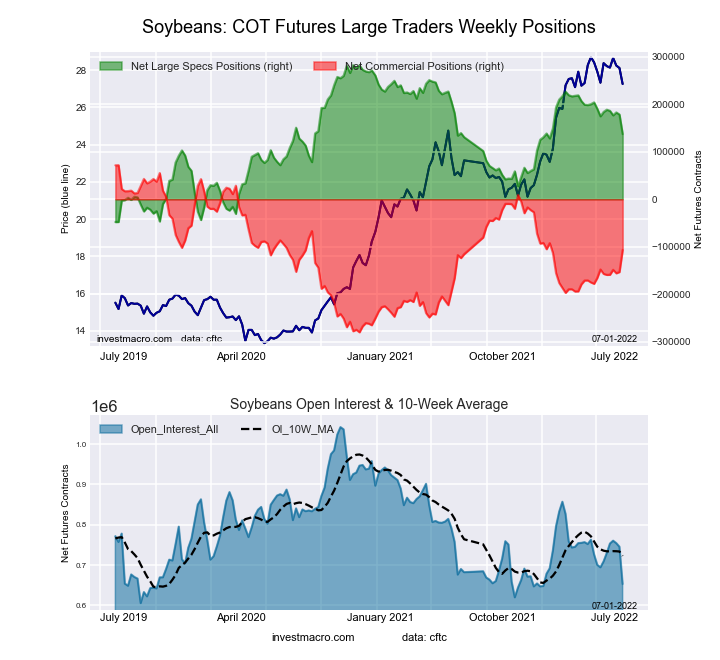
This week’s current strength score (the trader positioning range over the past three years, measured from 0 to 100) shows the speculators are currently Bullish with a score of 55.9 percent. The commercials are Bullish with a score of 51.7 percent and the small traders (not shown in chart) are Bearish-Extreme with a score of 19.5 percent.
| SOYBEANS Futures Statistics | SPECULATORS | COMMERCIALS | SMALL TRADERS |
| – Percent of Open Interest Longs: | 29.3 | 52.5 | 5.9 |
| – Percent of Open Interest Shorts: | 8.3 | 68.9 | 10.5 |
| – Net Position: | 137,193 | -106,705 | -30,488 |
| – Gross Longs: | 191,380 | 343,227 | 38,323 |
| – Gross Shorts: | 54,187 | 449,932 | 68,811 |
| – Long to Short Ratio: | 3.5 to 1 | 0.8 to 1 | 0.6 to 1 |
| NET POSITION TREND: | |||
| – Strength Index Score (3 Year Range Pct): | 55.9 | 51.7 | 19.5 |
| – Strength Index Reading (3 Year Range): | Bullish | Bullish | Bearish-Extreme |
| NET POSITION MOVEMENT INDEX: | |||
| – 6-Week Change in Strength Index: | -14.1 | 15.0 | -6.4 |
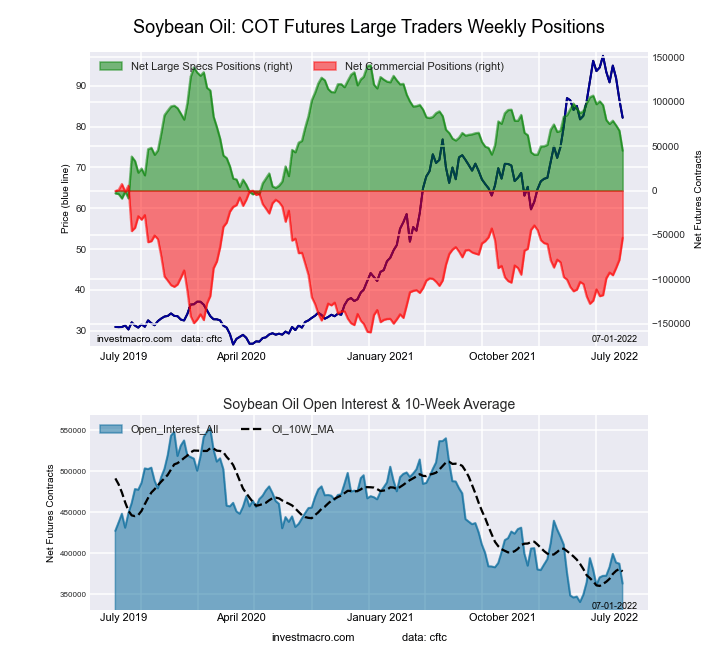
This week’s current strength score (the trader positioning range over the past three years, measured from 0 to 100) shows the speculators are currently Bearish with a score of 35.9 percent. The commercials are Bullish with a score of 63.7 percent and the small traders (not shown in chart) are Bearish with a score of 44.4 percent.
| SOYBEAN OIL Futures Statistics | SPECULATORS | COMMERCIALS | SMALL TRADERS |
| – Percent of Open Interest Longs: | 22.7 | 55.7 | 8.4 |
| – Percent of Open Interest Shorts: | 10.3 | 70.4 | 6.1 |
| – Net Position: | 44,918 | -53,225 | 8,307 |
| – Gross Longs: | 82,491 | 202,343 | 30,416 |
| – Gross Shorts: | 37,573 | 255,568 | 22,109 |
| – Long to Short Ratio: | 2.2 to 1 | 0.8 to 1 | 1.4 to 1 |
| NET POSITION TREND: | |||
| – Strength Index Score (3 Year Range Pct): | 35.9 | 63.7 | 44.4 |
| – Strength Index Reading (3 Year Range): | Bearish | Bullish | Bearish |
| NET POSITION MOVEMENT INDEX: | |||
| – 6-Week Change in Strength Index: | -34.2 | 38.6 | -48.9 |
This week’s current strength score (the trader positioning range over the past three years, measured from 0 to 100) shows the speculators are currently Bullish with a score of 79.8 percent. The commercials are Bearish with a score of 23.2 percent and the small traders (not shown in chart) are Bearish with a score of 42.3 percent.
| SOYBEAN MEAL Futures Statistics | SPECULATORS | COMMERCIALS | SMALL TRADERS |
| – Percent of Open Interest Longs: | 27.3 | 43.5 | 11.4 |
| – Percent of Open Interest Shorts: | 3.3 | 72.8 | 6.0 |
| – Net Position: | 93,925 | -114,869 | 20,944 |
| – Gross Longs: | 106,995 | 170,250 | 44,567 |
| – Gross Shorts: | 13,070 | 285,119 | 23,623 |
| – Long to Short Ratio: | 8.2 to 1 | 0.6 to 1 | 1.9 to 1 |
| NET POSITION TREND: | |||
| – Strength Index Score (3 Year Range Pct): | 79.8 | 23.2 | 42.3 |
| – Strength Index Reading (3 Year Range): | Bullish | Bearish | Bearish |
| NET POSITION MOVEMENT INDEX: | |||
| – 6-Week Change in Strength Index: | 11.5 | -7.4 | -33.0 |
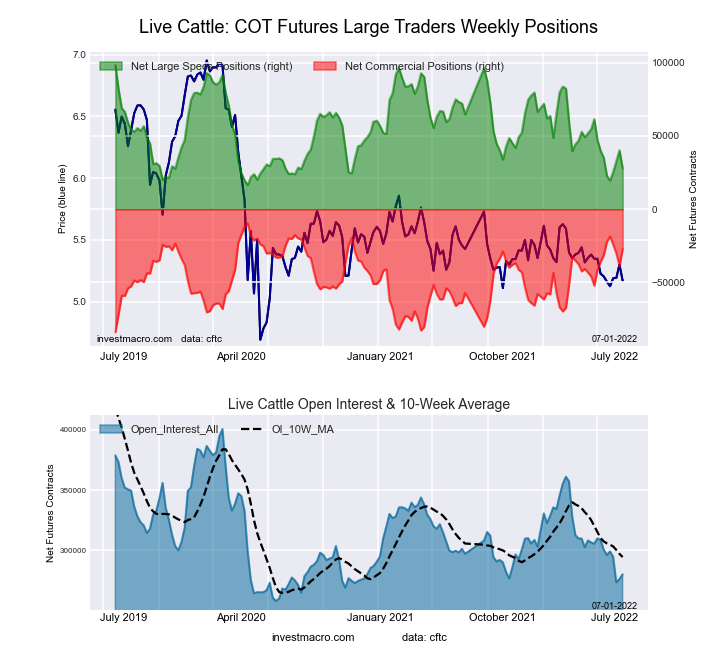
This week’s current strength score (the trader positioning range over the past three years, measured from 0 to 100) shows the speculators are currently Bearish-Extreme with a score of 14.3 percent. The commercials are Bullish with a score of 76.2 percent and the small traders (not shown in chart) are Bullish with a score of 79.2 percent.
| LIVE CATTLE Futures Statistics | SPECULATORS | COMMERCIALS | SMALL TRADERS |
| – Percent of Open Interest Longs: | 35.0 | 39.4 | 11.2 |
| – Percent of Open Interest Shorts: | 25.1 | 49.1 | 11.5 |
| – Net Position: | 27,835 | -27,080 | -755 |
| – Gross Longs: | 98,030 | 110,513 | 31,369 |
| – Gross Shorts: | 70,195 | 137,593 | 32,124 |
| – Long to Short Ratio: | 1.4 to 1 | 0.8 to 1 | 1.0 to 1 |
| NET POSITION TREND: | |||
| – Strength Index Score (3 Year Range Pct): | 14.3 | 76.2 | 79.2 |
| – Strength Index Reading (3 Year Range): | Bearish-Extreme | Bullish | Bullish |
| NET POSITION MOVEMENT INDEX: | |||
| – 6-Week Change in Strength Index: | -9.0 | 5.9 | 9.9 |
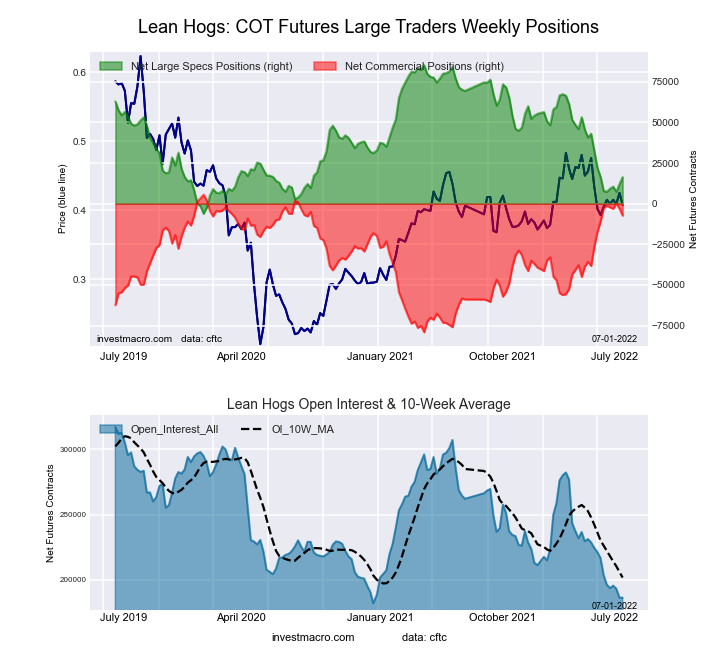
This week’s current strength score (the trader positioning range over the past three years, measured from 0 to 100) shows the speculators are currently Bearish with a score of 24.5 percent. The commercials are Bullish-Extreme with a score of 84.8 percent and the small traders (not shown in chart) are Bullish with a score of 50.1 percent.
| LEAN HOGS Futures Statistics | SPECULATORS | COMMERCIALS | SMALL TRADERS |
| – Percent of Open Interest Longs: | 32.9 | 41.6 | 9.7 |
| – Percent of Open Interest Shorts: | 24.2 | 45.5 | 14.5 |
| – Net Position: | 16,287 | -7,339 | -8,948 |
| – Gross Longs: | 61,378 | 77,472 | 18,100 |
| – Gross Shorts: | 45,091 | 84,811 | 27,048 |
| – Long to Short Ratio: | 1.4 to 1 | 0.9 to 1 | 0.7 to 1 |
| NET POSITION TREND: | |||
| – Strength Index Score (3 Year Range Pct): | 24.5 | 84.8 | 50.1 |
| – Strength Index Reading (3 Year Range): | Bearish | Bullish-Extreme | Bullish |
| NET POSITION MOVEMENT INDEX: | |||
| – 6-Week Change in Strength Index: | 9.3 | -5.5 | -19.9 |
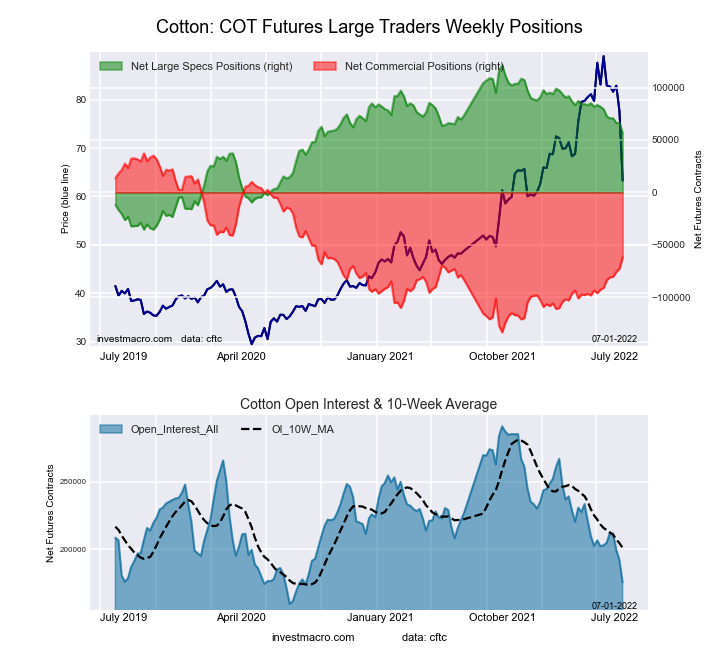
This week’s current strength score (the trader positioning range over the past three years, measured from 0 to 100) shows the speculators are currently Bullish with a score of 58.6 percent. The commercials are Bearish with a score of 41.9 percent and the small traders (not shown in chart) are Bearish with a score of 46.8 percent.
| COTTON Futures Statistics | SPECULATORS | COMMERCIALS | SMALL TRADERS |
| – Percent of Open Interest Longs: | 41.4 | 40.3 | 7.6 |
| – Percent of Open Interest Shorts: | 9.3 | 75.6 | 4.5 |
| – Net Position: | 56,390 | -61,856 | 5,466 |
| – Gross Longs: | 72,622 | 70,585 | 13,385 |
| – Gross Shorts: | 16,232 | 132,441 | 7,919 |
| – Long to Short Ratio: | 4.5 to 1 | 0.5 to 1 | 1.7 to 1 |
| NET POSITION TREND: | |||
| – Strength Index Score (3 Year Range Pct): | 58.6 | 41.9 | 46.8 |
| – Strength Index Reading (3 Year Range): | Bullish | Bearish | Bearish |
| NET POSITION MOVEMENT INDEX: | |||
| – 6-Week Change in Strength Index: | -14.6 | 17.0 | -38.7 |
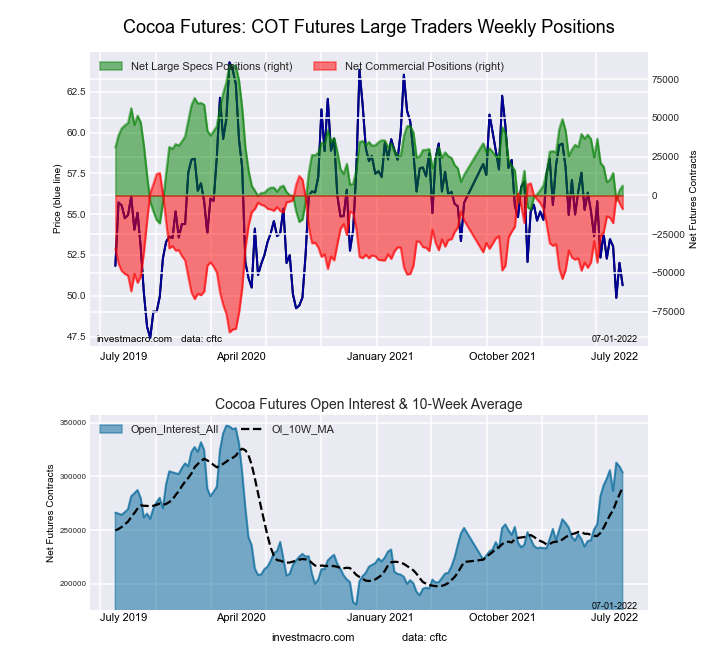
This week’s current strength score (the trader positioning range over the past three years, measured from 0 to 100) shows the speculators are currently Bearish with a score of 23.8 percent. The commercials are Bullish with a score of 77.4 percent and the small traders (not shown in chart) are Bearish with a score of 20.2 percent.
| COCOA Futures Statistics | SPECULATORS | COMMERCIALS | SMALL TRADERS |
| – Percent of Open Interest Longs: | 30.2 | 44.3 | 4.5 |
| – Percent of Open Interest Shorts: | 28.1 | 47.1 | 3.7 |
| – Net Position: | 6,339 | -8,708 | 2,369 |
| – Gross Longs: | 91,654 | 134,441 | 13,610 |
| – Gross Shorts: | 85,315 | 143,149 | 11,241 |
| – Long to Short Ratio: | 1.1 to 1 | 0.9 to 1 | 1.2 to 1 |
| NET POSITION TREND: | |||
| – Strength Index Score (3 Year Range Pct): | 23.8 | 77.4 | 20.2 |
| – Strength Index Reading (3 Year Range): | Bearish | Bullish | Bearish |
| NET POSITION MOVEMENT INDEX: | |||
| – 6-Week Change in Strength Index: | -12.0 | 14.6 | -27.2 |
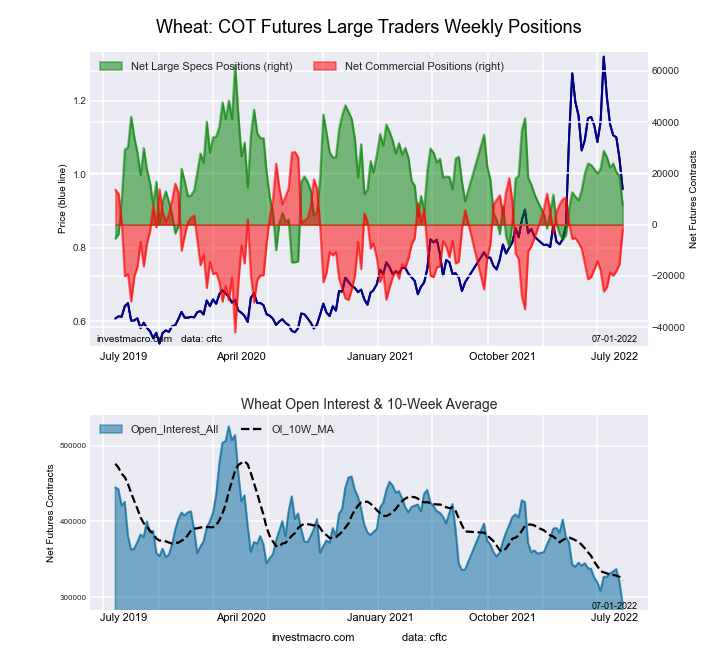
This week’s current strength score (the trader positioning range over the past three years, measured from 0 to 100) shows the speculators are currently Bearish with a score of 29.0 percent. The commercials are Bullish with a score of 57.0 percent and the small traders (not shown in chart) are Bullish-Extreme with a score of 80.3 percent.
| WHEAT Futures Statistics | SPECULATORS | COMMERCIALS | SMALL TRADERS |
| – Percent of Open Interest Longs: | 30.9 | 40.8 | 10.1 |
| – Percent of Open Interest Shorts: | 28.3 | 41.5 | 12.1 |
| – Net Position: | 7,679 | -1,871 | -5,808 |
| – Gross Longs: | 89,989 | 118,839 | 29,465 |
| – Gross Shorts: | 82,310 | 120,710 | 35,273 |
| – Long to Short Ratio: | 1.1 to 1 | 1.0 to 1 | 0.8 to 1 |
| NET POSITION TREND: | |||
| – Strength Index Score (3 Year Range Pct): | 29.0 | 57.0 | 80.3 |
| – Strength Index Reading (3 Year Range): | Bearish | Bullish | Bullish-Extreme |
| NET POSITION MOVEMENT INDEX: | |||
| – 6-Week Change in Strength Index: | -27.5 | 34.3 | -15.7 |
Article By InvestMacro – Receive our weekly COT Reports by Email
*COT Report: The COT data, released weekly to the public each Friday, is updated through the most recent Tuesday (data is 3 days old) and shows a quick view of how large speculators or non-commercials (for-profit traders) were positioned in the futures markets.
The CFTC categorizes trader positions according to commercial hedgers (traders who use futures contracts for hedging as part of the business), non-commercials (large traders who speculate to realize trading profits) and nonreportable traders (usually small traders/speculators) as well as their open interest (contracts open in the market at time of reporting).See CFTC criteria here.
By JustMarkets The US stock indices ended Friday’s session in the red. By the end…
By Analytical Department RoboForex USD/JPY opens the week at 162.36 on Monday. The Japanese yen…
By InvestMacro Here are the latest charts and statistics for the Commitment of Traders (COT)…
By InvestMacro The latest update for the weekly Commitment of Traders (COT) report was released…
By InvestMacro Here are the latest charts and statistics for the Commitment of Traders (COT)…
By InvestMacro Here are the latest charts and statistics for the Commitment of Traders (COT)…
This website uses cookies.