By InvestMacro | COT | Data Tables | COT Leaders | Downloads | COT Newsletter
Here are the latest charts and statistics for the Commitment of Traders (COT) data published by the Commodities Futures Trading Commission (CFTC).
The latest COT data is updated through Tuesday June 7th and shows a quick view of how large traders (for-profit speculators and commercial entities) were positioned in the futures markets.
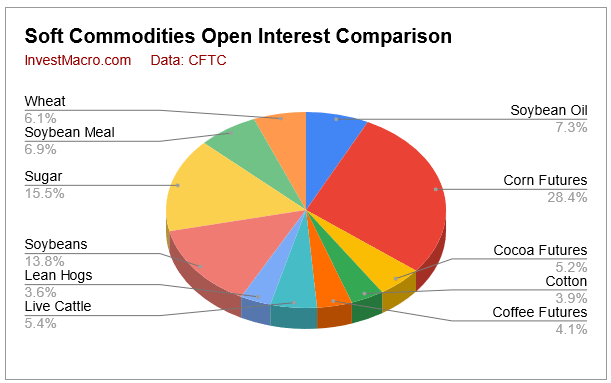
The soft commodities market speculator bets were mostly higher this week as seven out of the eleven soft commodities markets we cover had higher positioning this week while four markets had lower contracts.
Leading the gains for soft commodities markets was Soybean Meal (8,922 contracts) and Live Cattle (5,888 contracts) with Coffee (5,752 contracts), Cocoa (4,341 contracts), Soybean Oil (3,604 contracts), Wheat (1,572 contracts) and Lean Hogs (1,274 contracts) also showing a positive weeks.
Free Reports:
Meanwhile, leading the declines in speculator bets this week were Corn (-12,936 contracts) and Soybeans (-9,434 contracts) with Sugar (-6,277 contracts) and Cotton (-2 contracts) also registering lower bets on the week.
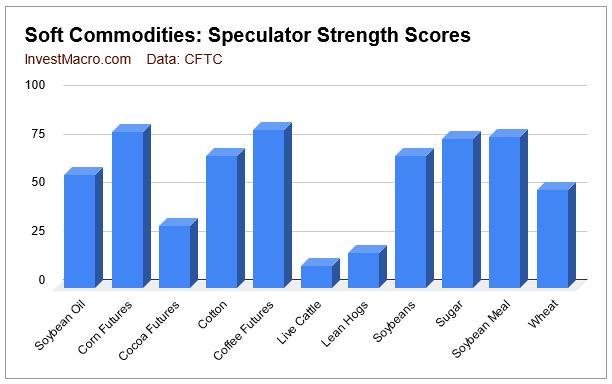
Strength scores (3-Year range of Speculator positions, from 0 to 100 where above 80 is extreme bullish and below 20 is extreme bearish) show that Corn and Coffee are in extreme-bullish levels currently. On the opposite position, Live Cattle and Lean Hogs hold extreme-bearish levels while most of the other markets are in strong bullish positions between 50 percent and 80 percent.
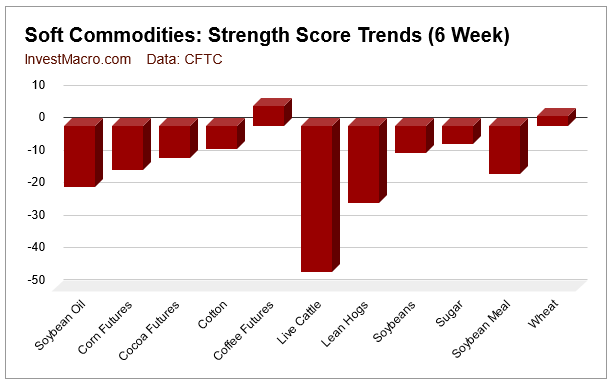
Strength score trends (or move index, that show 6-week changes in strength scores) shows that despite the strong strength scores in the blue chart previously, the trends have been cooling off mightily. This chart shows that only Coffee and Wheat have had rising scores over the past six weeks. Live Cattle and Lean Hogs have had strong declines in the trends over the past six weeks followed by Soybean Meal, Soybean Oil and Corn.
| Jun-07-2022 | OI | OI-Index | Spec-Net | Spec-Index | Com-Net | COM-Index | Smalls-Net | Smalls-Index |
|---|---|---|---|---|---|---|---|---|
| WTI Crude | 1,790,618 | 10 | 328,256 | 8 | -369,033 | 93 | 40,777 | 72 |
| Gold | 494,130 | 12 | 175,268 | 7 | -199,886 | 95 | 24,618 | 18 |
| Silver | 148,294 | 15 | 17,404 | 5 | -27,990 | 94 | 10,586 | 10 |
| Copper | 194,187 | 22 | -3,714 | 40 | 879 | 60 | 2,835 | 42 |
| Palladium | 7,035 | 3 | -3,461 | 2 | 3,581 | 97 | -120 | 37 |
| Platinum | 65,295 | 31 | 5,933 | 12 | -9,742 | 92 | 3,809 | 15 |
| Natural Gas | 1,127,731 | 10 | -114,342 | 44 | 66,419 | 52 | 47,923 | 93 |
| Brent | 169,802 | 16 | -36,098 | 51 | 34,208 | 50 | 1,890 | 35 |
| Heating Oil | 261,651 | 20 | 4,886 | 50 | -24,428 | 45 | 19,542 | 66 |
| Soybeans | 760,444 | 35 | 176,644 | 68 | -148,390 | 39 | -28,254 | 23 |
| Corn | 1,557,167 | 31 | 391,264 | 80 | -337,137 | 24 | -54,127 | 12 |
| Coffee | 222,583 | 15 | 48,767 | 81 | -51,363 | 23 | 2,596 | 16 |
| Sugar | 849,814 | 12 | 195,403 | 77 | -234,496 | 24 | 39,093 | 56 |
| Wheat | 333,705 | 12 | 23,881 | 50 | -19,863 | 31 | -4,018 | 90 |
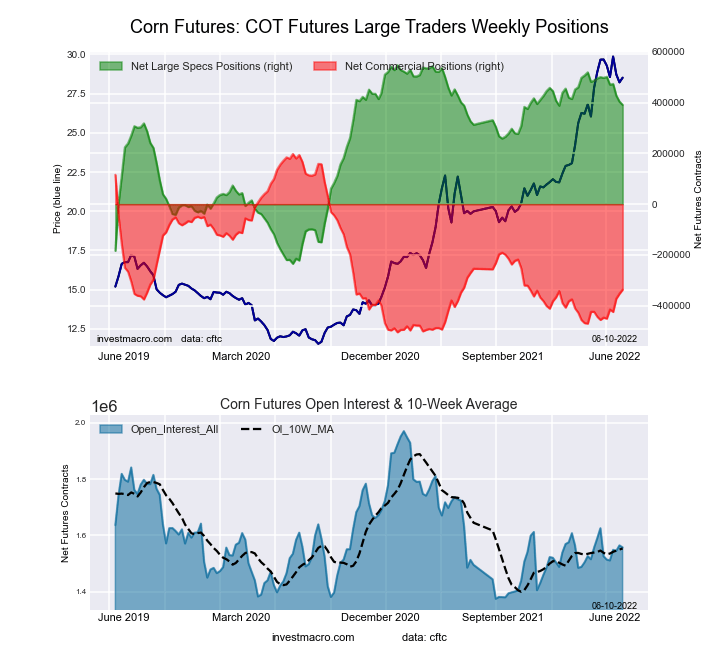
This week’s current strength score (the trader positioning range over the past three years, measured from 0 to 100) shows the speculators are currently Bullish-Extreme with a score of 80.0 percent. The commercials are Bearish with a score of 23.9 percent and the small traders (not shown in chart) are Bearish-Extreme with a score of 11.9 percent.
| CORN Futures Statistics | SPECULATORS | COMMERCIALS | SMALL TRADERS |
| – Percent of Open Interest Longs: | 33.4 | 43.2 | 8.8 |
| – Percent of Open Interest Shorts: | 8.3 | 64.9 | 12.3 |
| – Net Position: | 391,264 | -337,137 | -54,127 |
| – Gross Longs: | 520,783 | 673,039 | 137,311 |
| – Gross Shorts: | 129,519 | 1,010,176 | 191,438 |
| – Long to Short Ratio: | 4.0 to 1 | 0.7 to 1 | 0.7 to 1 |
| NET POSITION TREND: | |||
| – Strength Index Score (3 Year Range Pct): | 80.0 | 23.9 | 11.9 |
| – Strength Index Reading (3 Year Range): | Bullish-Extreme | Bearish | Bearish-Extreme |
| NET POSITION MOVEMENT INDEX: | |||
| – 6-Week Change in Strength Index: | -13.6 | 15.7 | -2.2 |
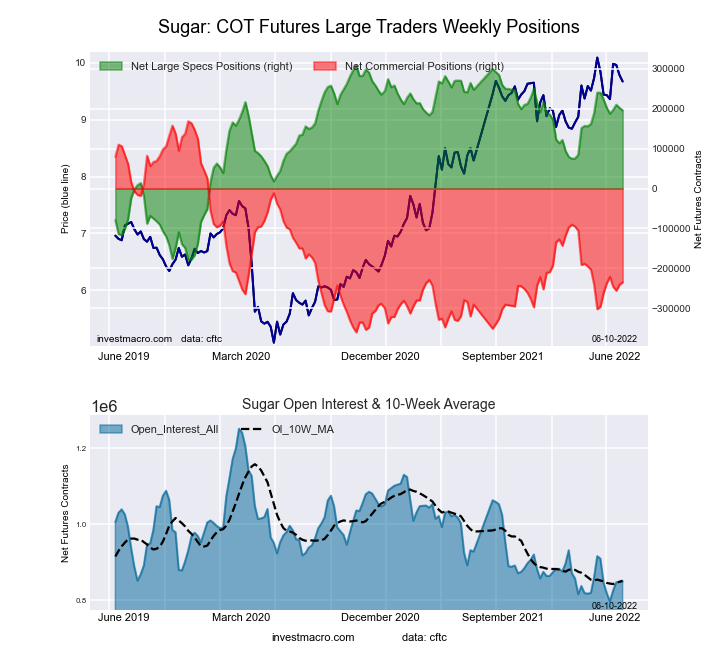
This week’s current strength score (the trader positioning range over the past three years, measured from 0 to 100) shows the speculators are currently Bullish with a score of 76.8 percent. The commercials are Bearish with a score of 23.7 percent and the small traders (not shown in chart) are Bullish with a score of 56.2 percent.
| SUGAR Futures Statistics | SPECULATORS | COMMERCIALS | SMALL TRADERS |
| – Percent of Open Interest Longs: | 29.7 | 45.1 | 10.6 |
| – Percent of Open Interest Shorts: | 6.7 | 72.7 | 6.0 |
| – Net Position: | 195,403 | -234,496 | 39,093 |
| – Gross Longs: | 252,688 | 383,138 | 90,314 |
| – Gross Shorts: | 57,285 | 617,634 | 51,221 |
| – Long to Short Ratio: | 4.4 to 1 | 0.6 to 1 | 1.8 to 1 |
| NET POSITION TREND: | |||
| – Strength Index Score (3 Year Range Pct): | 76.8 | 23.7 | 56.2 |
| – Strength Index Reading (3 Year Range): | Bullish | Bearish | Bullish |
| NET POSITION MOVEMENT INDEX: | |||
| – 6-Week Change in Strength Index: | -5.6 | 5.0 | 0.8 |
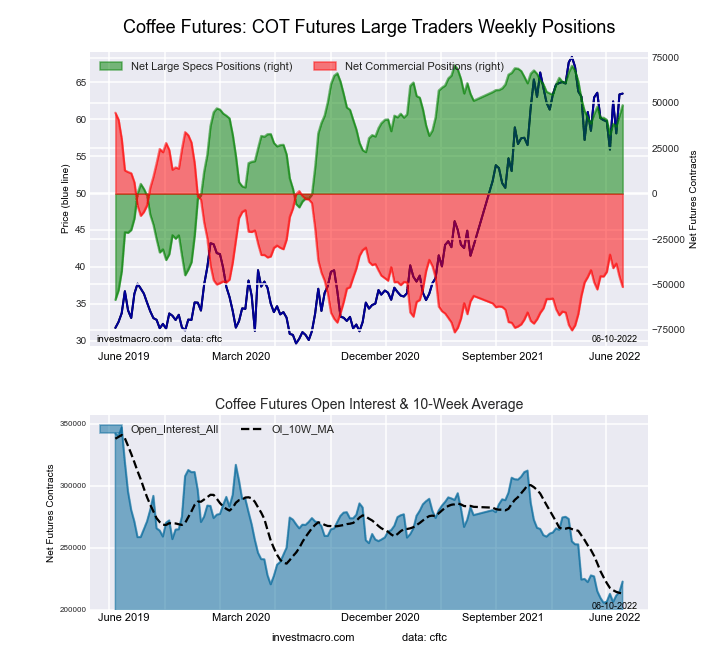
This week’s current strength score (the trader positioning range over the past three years, measured from 0 to 100) shows the speculators are currently Bullish-Extreme with a score of 81.0 percent. The commercials are Bearish with a score of 22.6 percent and the small traders (not shown in chart) are Bearish-Extreme with a score of 16.0 percent.
| COFFEE Futures Statistics | SPECULATORS | COMMERCIALS | SMALL TRADERS |
| – Percent of Open Interest Longs: | 25.8 | 48.7 | 4.1 |
| – Percent of Open Interest Shorts: | 3.9 | 71.8 | 3.0 |
| – Net Position: | 48,767 | -51,363 | 2,596 |
| – Gross Longs: | 57,417 | 108,343 | 9,164 |
| – Gross Shorts: | 8,650 | 159,706 | 6,568 |
| – Long to Short Ratio: | 6.6 to 1 | 0.7 to 1 | 1.4 to 1 |
| NET POSITION TREND: | |||
| – Strength Index Score (3 Year Range Pct): | 81.0 | 22.6 | 16.0 |
| – Strength Index Reading (3 Year Range): | Bullish-Extreme | Bearish | Bearish-Extreme |
| NET POSITION MOVEMENT INDEX: | |||
| – 6-Week Change in Strength Index: | 6.0 | -5.3 | -11.4 |
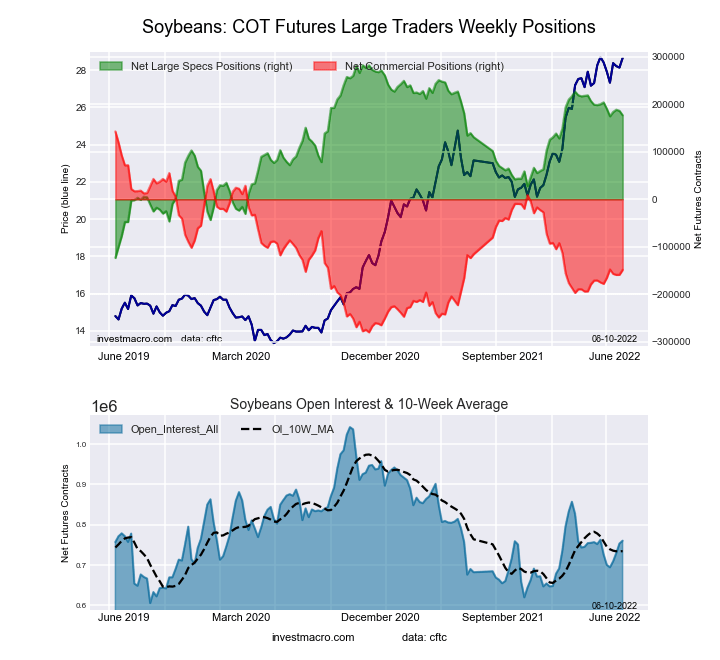
This week’s current strength score (the trader positioning range over the past three years, measured from 0 to 100) shows the speculators are currently Bullish with a score of 67.9 percent. The commercials are Bearish with a score of 39.2 percent and the small traders (not shown in chart) are Bearish with a score of 23.3 percent.
| SOYBEANS Futures Statistics | SPECULATORS | COMMERCIALS | SMALL TRADERS |
| – Percent of Open Interest Longs: | 30.2 | 47.3 | 6.5 |
| – Percent of Open Interest Shorts: | 7.0 | 66.8 | 10.2 |
| – Net Position: | 176,644 | -148,390 | -28,254 |
| – Gross Longs: | 229,895 | 359,587 | 49,303 |
| – Gross Shorts: | 53,251 | 507,977 | 77,557 |
| – Long to Short Ratio: | 4.3 to 1 | 0.7 to 1 | 0.6 to 1 |
| NET POSITION TREND: | |||
| – Strength Index Score (3 Year Range Pct): | 67.9 | 39.2 | 23.3 |
| – Strength Index Reading (3 Year Range): | Bullish | Bearish | Bearish |
| NET POSITION MOVEMENT INDEX: | |||
| – 6-Week Change in Strength Index: | -8.3 | 8.8 | -3.8 |
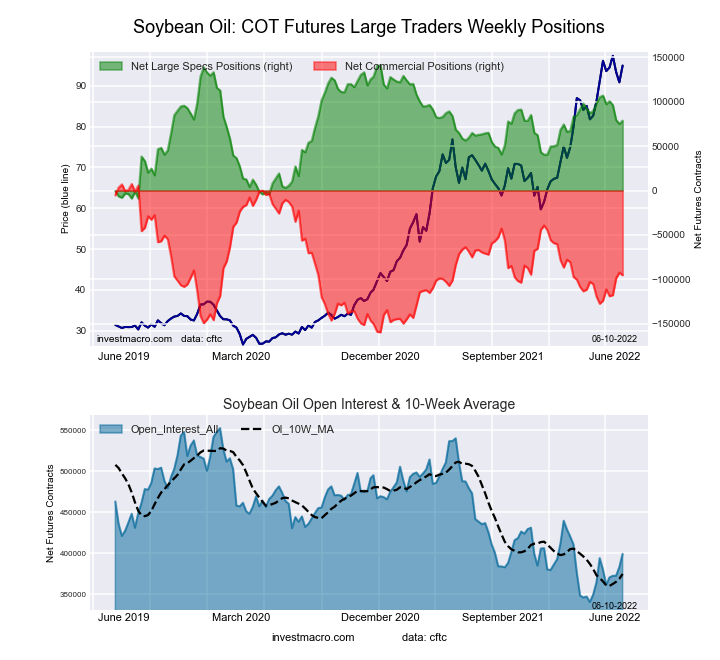
This week’s current strength score (the trader positioning range over the past three years, measured from 0 to 100) shows the speculators are currently Bullish with a score of 58.3 percent. The commercials are Bearish with a score of 38.5 percent and the small traders (not shown in chart) are Bullish with a score of 75.4 percent.
| SOYBEAN OIL Futures Statistics | SPECULATORS | COMMERCIALS | SMALL TRADERS |
| – Percent of Open Interest Longs: | 26.9 | 48.2 | 9.2 |
| – Percent of Open Interest Shorts: | 7.2 | 72.1 | 5.0 |
| – Net Position: | 78,645 | -95,258 | 16,613 |
| – Gross Longs: | 107,372 | 192,493 | 36,684 |
| – Gross Shorts: | 28,727 | 287,751 | 20,071 |
| – Long to Short Ratio: | 3.7 to 1 | 0.7 to 1 | 1.8 to 1 |
| NET POSITION TREND: | |||
| – Strength Index Score (3 Year Range Pct): | 58.3 | 38.5 | 75.4 |
| – Strength Index Reading (3 Year Range): | Bullish | Bearish | Bullish |
| NET POSITION MOVEMENT INDEX: | |||
| – 6-Week Change in Strength Index: | -18.9 | 17.2 | -1.2 |
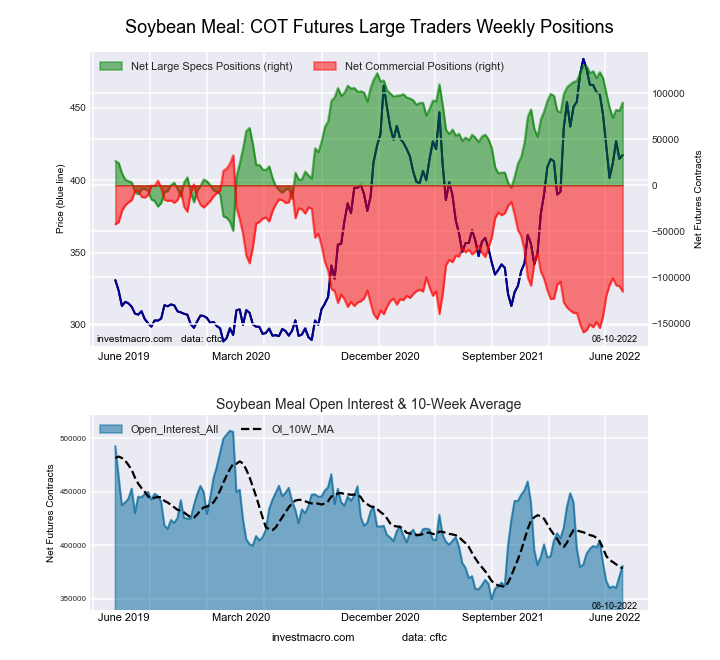
This week’s current strength score (the trader positioning range over the past three years, measured from 0 to 100) shows the speculators are currently Bullish with a score of 77.4 percent. The commercials are Bearish with a score of 23.0 percent and the small traders (not shown in chart) are Bullish with a score of 65.9 percent.
| SOYBEAN MEAL Futures Statistics | SPECULATORS | COMMERCIALS | SMALL TRADERS |
| – Percent of Open Interest Longs: | 28.3 | 43.9 | 12.2 |
| – Percent of Open Interest Shorts: | 4.8 | 74.2 | 5.5 |
| – Net Position: | 89,676 | -115,261 | 25,585 |
| – Gross Longs: | 107,791 | 167,306 | 46,628 |
| – Gross Shorts: | 18,115 | 282,567 | 21,043 |
| – Long to Short Ratio: | 6.0 to 1 | 0.6 to 1 | 2.2 to 1 |
| NET POSITION TREND: | |||
| – Strength Index Score (3 Year Range Pct): | 77.4 | 23.0 | 65.9 |
| – Strength Index Reading (3 Year Range): | Bullish | Bearish | Bullish |
| NET POSITION MOVEMENT INDEX: | |||
| – 6-Week Change in Strength Index: | -14.8 | 14.0 | -1.2 |
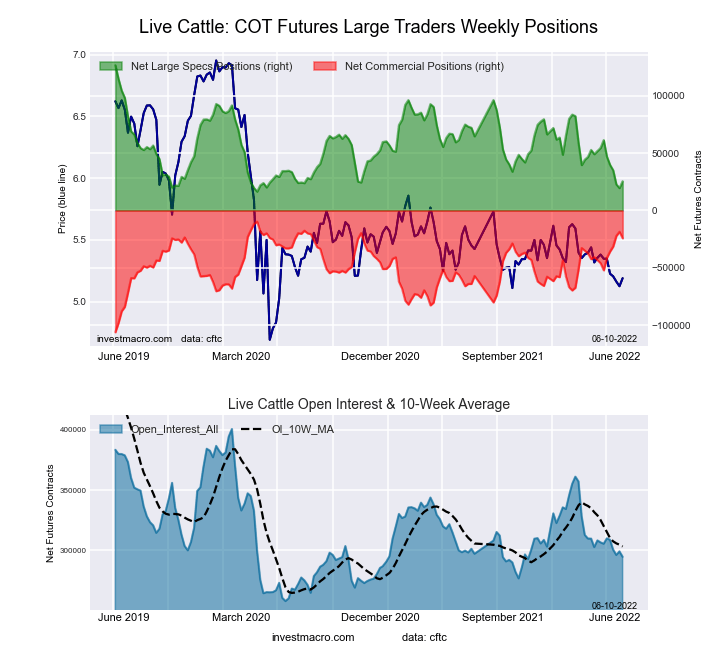
This week’s current strength score (the trader positioning range over the past three years, measured from 0 to 100) shows the speculators are currently Bearish-Extreme with a score of 11.3 percent. The commercials are Bullish-Extreme with a score of 80.2 percent and the small traders (not shown in chart) are Bullish with a score of 77.6 percent.
| LIVE CATTLE Futures Statistics | SPECULATORS | COMMERCIALS | SMALL TRADERS |
| – Percent of Open Interest Longs: | 35.5 | 40.5 | 11.5 |
| – Percent of Open Interest Shorts: | 26.9 | 48.7 | 11.9 |
| – Net Position: | 25,428 | -24,212 | -1,216 |
| – Gross Longs: | 104,585 | 119,324 | 33,798 |
| – Gross Shorts: | 79,157 | 143,536 | 35,014 |
| – Long to Short Ratio: | 1.3 to 1 | 0.8 to 1 | 1.0 to 1 |
| NET POSITION TREND: | |||
| – Strength Index Score (3 Year Range Pct): | 11.3 | 80.2 | 77.6 |
| – Strength Index Reading (3 Year Range): | Bearish-Extreme | Bullish-Extreme | Bullish |
| NET POSITION MOVEMENT INDEX: | |||
| – 6-Week Change in Strength Index: | -45.0 | 38.3 | 27.7 |
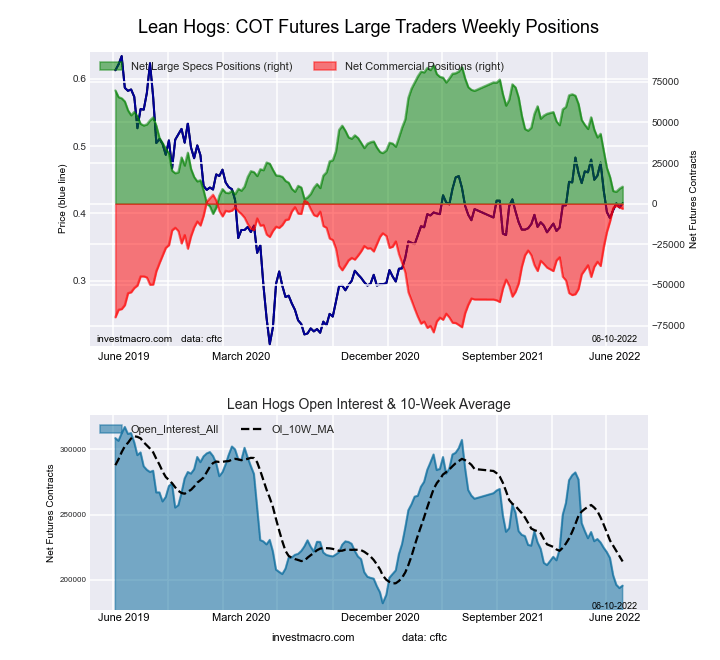
This week’s current strength score (the trader positioning range over the past three years, measured from 0 to 100) shows the speculators are currently Bearish-Extreme with a score of 18.2 percent. The commercials are Bullish-Extreme with a score of 89.8 percent and the small traders (not shown in chart) are Bullish with a score of 58.1 percent.
| LEAN HOGS Futures Statistics | SPECULATORS | COMMERCIALS | SMALL TRADERS |
| – Percent of Open Interest Longs: | 30.3 | 41.7 | 9.9 |
| – Percent of Open Interest Shorts: | 24.9 | 43.3 | 13.6 |
| – Net Position: | 10,491 | -3,090 | -7,401 |
| – Gross Longs: | 59,207 | 81,583 | 19,271 |
| – Gross Shorts: | 48,716 | 84,673 | 26,672 |
| – Long to Short Ratio: | 1.2 to 1 | 1.0 to 1 | 0.7 to 1 |
| NET POSITION TREND: | |||
| – Strength Index Score (3 Year Range Pct): | 18.2 | 89.8 | 58.1 |
| – Strength Index Reading (3 Year Range): | Bearish-Extreme | Bullish-Extreme | Bullish |
| NET POSITION MOVEMENT INDEX: | |||
| – 6-Week Change in Strength Index: | -23.8 | 27.8 | -8.7 |
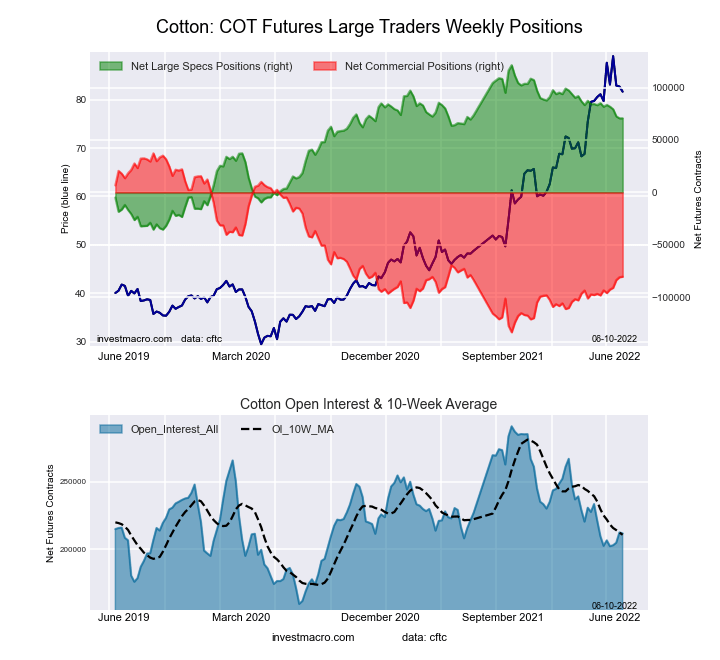
This week’s current strength score (the trader positioning range over the past three years, measured from 0 to 100) shows the speculators are currently Bullish with a score of 67.7 percent. The commercials are Bearish with a score of 31.0 percent and the small traders (not shown in chart) are Bullish with a score of 73.4 percent.
| COTTON Futures Statistics | SPECULATORS | COMMERCIALS | SMALL TRADERS |
| – Percent of Open Interest Longs: | 40.9 | 37.7 | 8.2 |
| – Percent of Open Interest Shorts: | 7.5 | 75.7 | 3.6 |
| – Net Position: | 70,682 | -80,347 | 9,665 |
| – Gross Longs: | 86,609 | 79,718 | 17,332 |
| – Gross Shorts: | 15,927 | 160,065 | 7,667 |
| – Long to Short Ratio: | 5.4 to 1 | 0.5 to 1 | 2.3 to 1 |
| NET POSITION TREND: | |||
| – Strength Index Score (3 Year Range Pct): | 67.7 | 31.0 | 73.4 |
| – Strength Index Reading (3 Year Range): | Bullish | Bearish | Bullish |
| NET POSITION MOVEMENT INDEX: | |||
| – 6-Week Change in Strength Index: | -7.1 | 7.6 | -12.1 |
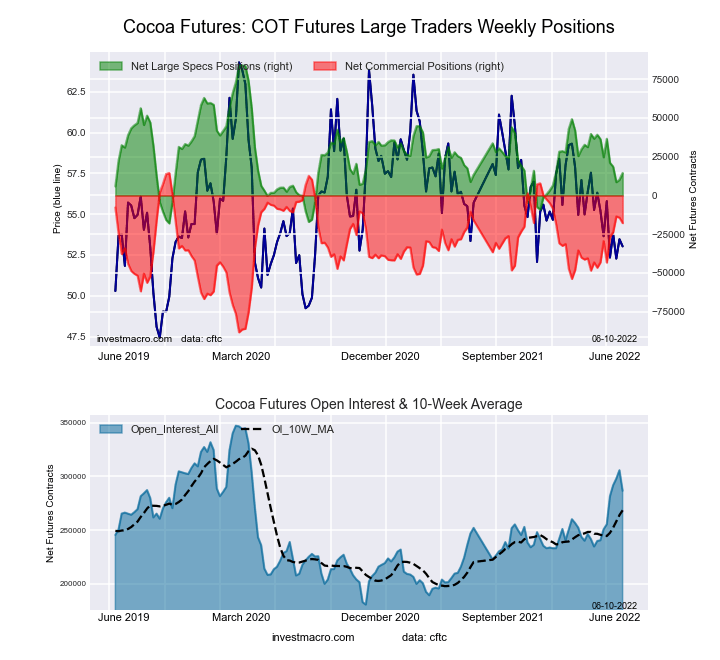
This week’s current strength score (the trader positioning range over the past three years, measured from 0 to 100) shows the speculators are currently Bearish with a score of 31.8 percent. The commercials are Bullish with a score of 68.6 percent and the small traders (not shown in chart) are Bearish with a score of 29.8 percent.
| COCOA Futures Statistics | SPECULATORS | COMMERCIALS | SMALL TRADERS |
| – Percent of Open Interest Longs: | 31.4 | 43.9 | 5.2 |
| – Percent of Open Interest Shorts: | 26.3 | 50.1 | 4.0 |
| – Net Position: | 14,494 | -17,823 | 3,329 |
| – Gross Longs: | 89,997 | 125,905 | 14,861 |
| – Gross Shorts: | 75,503 | 143,728 | 11,532 |
| – Long to Short Ratio: | 1.2 to 1 | 0.9 to 1 | 1.3 to 1 |
| NET POSITION TREND: | |||
| – Strength Index Score (3 Year Range Pct): | 31.8 | 68.6 | 29.8 |
| – Strength Index Reading (3 Year Range): | Bearish | Bullish | Bearish |
| NET POSITION MOVEMENT INDEX: | |||
| – 6-Week Change in Strength Index: | -10.0 | 11.3 | -14.6 |
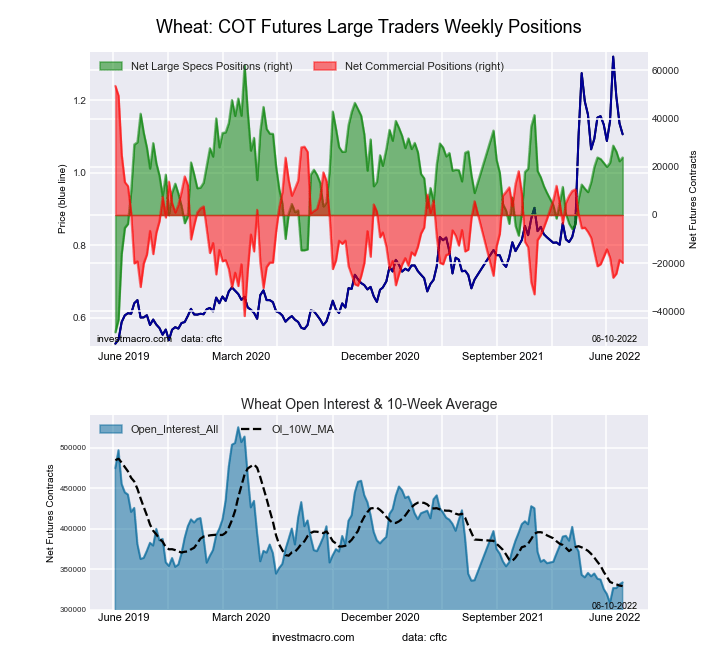
This week’s current strength score (the trader positioning range over the past three years, measured from 0 to 100) shows the speculators are currently Bullish with a score of 50.1 percent. The commercials are Bearish with a score of 31.4 percent and the small traders (not shown in chart) are Bullish-Extreme with a score of 89.6 percent.
| WHEAT Futures Statistics | SPECULATORS | COMMERCIALS | SMALL TRADERS |
| – Percent of Open Interest Longs: | 32.9 | 34.8 | 10.4 |
| – Percent of Open Interest Shorts: | 25.7 | 40.8 | 11.6 |
| – Net Position: | 23,881 | -19,863 | -4,018 |
| – Gross Longs: | 109,678 | 116,146 | 34,706 |
| – Gross Shorts: | 85,797 | 136,009 | 38,724 |
| – Long to Short Ratio: | 1.3 to 1 | 0.9 to 1 | 0.9 to 1 |
| NET POSITION TREND: | |||
| – Strength Index Score (3 Year Range Pct): | 50.1 | 31.4 | 89.6 |
| – Strength Index Reading (3 Year Range): | Bullish | Bearish | Bullish-Extreme |
| NET POSITION MOVEMENT INDEX: | |||
| – 6-Week Change in Strength Index: | 2.9 | -3.5 | 1.2 |
Article By InvestMacro – Receive our weekly COT Reports by Email
*COT Report: The COT data, released weekly to the public each Friday, is updated through the most recent Tuesday (data is 3 days old) and shows a quick view of how large speculators or non-commercials (for-profit traders) were positioned in the futures markets.
The CFTC categorizes trader positions according to commercial hedgers (traders who use futures contracts for hedging as part of the business), non-commercials (large traders who speculate to realize trading profits) and nonreportable traders (usually small traders/speculators) as well as their open interest (contracts open in the market at time of reporting).See CFTC criteria here.
By JustMarkets The US stock indices started the week on a downbeat note. By the…
By Analytical Department RoboForex GBP/USD fell to 1.3437 on Tuesday as investors assessed the appointment…
By JustMarkets The US stock indices ended Friday’s session in the red. By the end…
By Analytical Department RoboForex USD/JPY opens the week at 162.36 on Monday. The Japanese yen…
By InvestMacro Here are the latest charts and statistics for the Commitment of Traders (COT)…
By InvestMacro The latest update for the weekly Commitment of Traders (COT) report was released…
This website uses cookies.