By InvestMacro | COT | Data Tables | COT Leaders | Downloads | COT Newsletter
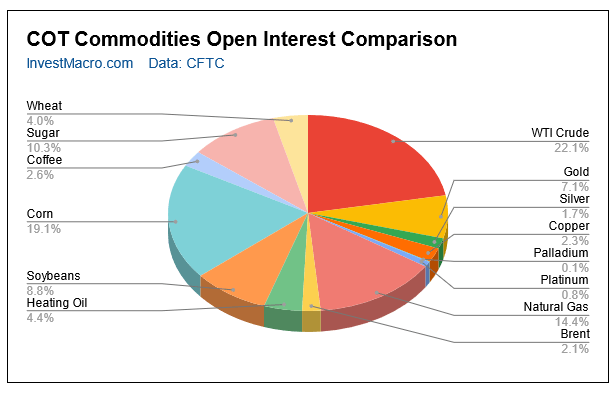
Here are the latest charts and statistics for the Commitment of Traders (COT) data published by the Commodities Futures Trading Commission (CFTC).
The latest COT data is updated through Tuesday May 3rd 2022 and shows a quick view of how large traders (for-profit speculators and commercial entities) were positioned in the futures markets.
The soft commodities that saw higher bets this week were Corn (4,240 contracts), Cotton (1,688 contracts) and Cocoa (11,905 contracts) while lower bets were seen in Sugar (-20,957 contracts), Coffee (-1,140 contracts), Soybeans (-13,404 contracts), Soybean Oil (-9,667 contracts), Soybean Meal (-16,734 contracts), Live Cattle (-14,313 contracts), Lean Hogs (-10,305 contracts) and Wheat (-1,638 contracts).
Free Reports:
| May-03-2022 | OI | OI-Index | Spec-Net | Spec-Index | Com-Net | COM-Index | Smalls-Net | Smalls-Index |
|---|---|---|---|---|---|---|---|---|
| WTI Crude | 1,751,564 | 2 | 321,701 | 6 | -366,213 | 94 | 44,512 | 78 |
| Gold | 560,441 | 31 | 199,168 | 42 | -231,852 | 55 | 32,684 | 57 |
| Silver | 137,692 | 5 | 28,068 | 50 | -39,317 | 60 | 11,249 | 8 |
| Copper | 185,255 | 16 | -15,623 | 31 | 10,080 | 66 | 5,543 | 57 |
| Palladium | 7,638 | 6 | -2,752 | 6 | 2,455 | 90 | 297 | 61 |
| Platinum | 66,545 | 33 | -1,541 | 1 | -3,667 | 100 | 5,208 | 35 |
| Natural Gas | 1,138,319 | 12 | -117,706 | 43 | 72,861 | 54 | 44,845 | 92 |
| Brent | 168,128 | 14 | -27,318 | 65 | 26,014 | 37 | 1,304 | 27 |
| Heating Oil | 349,618 | 31 | 6,455 | 52 | -32,434 | 37 | 25,979 | 88 |
| Soybeans | 700,856 | 22 | 190,402 | 77 | -165,353 | 27 | -25,049 | 29 |
| Corn | 1,513,880 | 23 | 501,865 | 94 | -451,210 | 8 | -50,655 | 14 |
| Coffee | 206,337 | 1 | 40,697 | 77 | -43,007 | 28 | 2,310 | 5 |
| Sugar | 818,627 | 1 | 201,592 | 78 | -236,394 | 23 | 34,802 | 51 |
| Wheat | 319,233 | 0 | 20,012 | 60 | -14,225 | 30 | -5,787 | 82 |
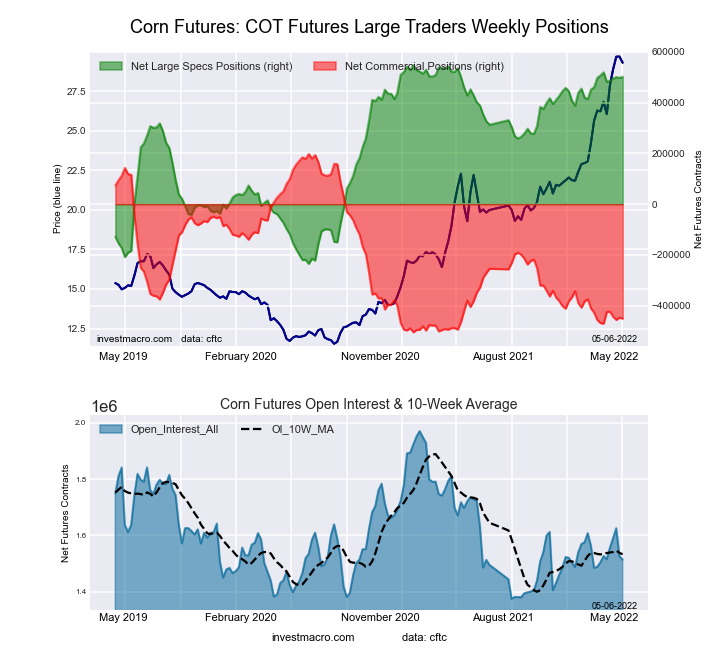
This week’s current strength score (the trader positioning range over the past three years, measured from 0 to 100) shows the speculators are currently Bullish-Extreme with a score of 94.1 percent. The commercials are Bearish-Extreme with a score of 7.7 percent and the small traders (not shown in chart) are Bearish-Extreme with a score of 13.9 percent.
| CORN Futures Statistics | SPECULATORS | COMMERCIALS | SMALL TRADERS |
| – Percent of Open Interest Longs: | 39.0 | 42.5 | 9.3 |
| – Percent of Open Interest Shorts: | 5.8 | 72.3 | 12.6 |
| – Net Position: | 501,865 | -451,210 | -50,655 |
| – Gross Longs: | 589,856 | 642,906 | 140,438 |
| – Gross Shorts: | 87,991 | 1,094,116 | 191,093 |
| – Long to Short Ratio: | 6.7 to 1 | 0.6 to 1 | 0.7 to 1 |
| NET POSITION TREND: | |||
| – Strength Index Score (3 Year Range Pct): | 94.1 | 7.7 | 13.9 |
| – Strength Index Reading (3 Year Range): | Bullish-Extreme | Bearish-Extreme | Bearish-Extreme |
| NET POSITION MOVEMENT INDEX: | |||
| – 6-Week Change in Strength Index: | -2.2 | 2.8 | -1.2 |
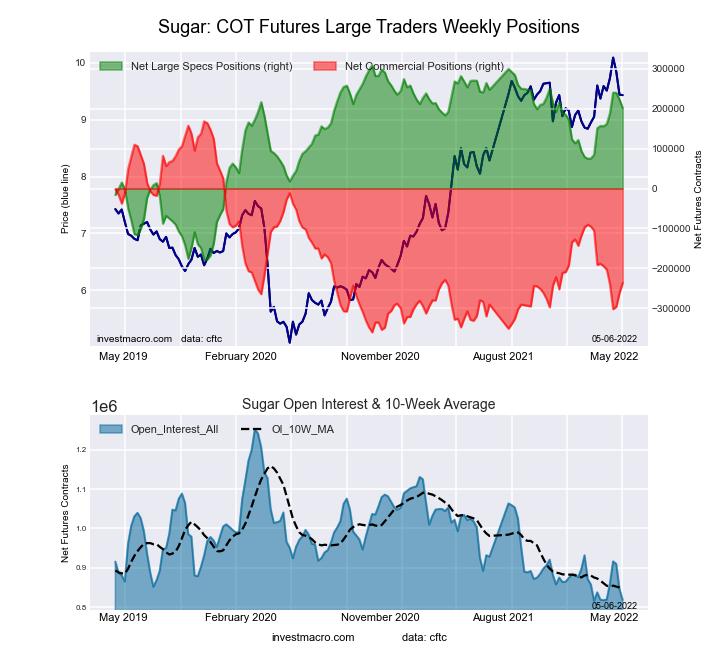
This week’s current strength score (the trader positioning range over the past three years, measured from 0 to 100) shows the speculators are currently Bullish with a score of 78.0 percent. The commercials are Bearish with a score of 23.3 percent and the small traders (not shown in chart) are Bullish with a score of 50.9 percent.
| SUGAR Futures Statistics | SPECULATORS | COMMERCIALS | SMALL TRADERS |
| – Percent of Open Interest Longs: | 32.4 | 44.8 | 10.4 |
| – Percent of Open Interest Shorts: | 7.7 | 73.7 | 6.1 |
| – Net Position: | 201,592 | -236,394 | 34,802 |
| – Gross Longs: | 264,899 | 366,584 | 85,022 |
| – Gross Shorts: | 63,307 | 602,978 | 50,220 |
| – Long to Short Ratio: | 4.2 to 1 | 0.6 to 1 | 1.7 to 1 |
| NET POSITION TREND: | |||
| – Strength Index Score (3 Year Range Pct): | 78.0 | 23.3 | 50.9 |
| – Strength Index Reading (3 Year Range): | Bullish | Bearish | Bullish |
| NET POSITION MOVEMENT INDEX: | |||
| – 6-Week Change in Strength Index: | 9.4 | -8.0 | -4.6 |
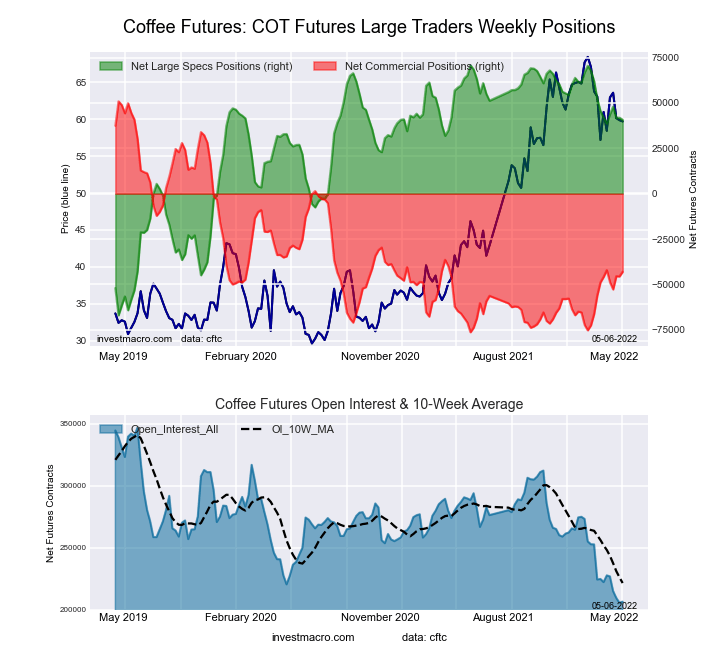
This week’s current strength score (the trader positioning range over the past three years, measured from 0 to 100) shows the speculators are currently Bullish with a score of 76.7 percent. The commercials are Bearish with a score of 27.6 percent and the small traders (not shown in chart) are Bearish-Extreme with a score of 5.1 percent.
| COFFEE Futures Statistics | SPECULATORS | COMMERCIALS | SMALL TRADERS |
| – Percent of Open Interest Longs: | 25.6 | 54.1 | 4.4 |
| – Percent of Open Interest Shorts: | 5.9 | 74.9 | 3.3 |
| – Net Position: | 40,697 | -43,007 | 2,310 |
| – Gross Longs: | 52,804 | 111,613 | 9,017 |
| – Gross Shorts: | 12,107 | 154,620 | 6,707 |
| – Long to Short Ratio: | 4.4 to 1 | 0.7 to 1 | 1.3 to 1 |
| NET POSITION TREND: | |||
| – Strength Index Score (3 Year Range Pct): | 76.7 | 27.6 | 5.1 |
| – Strength Index Reading (3 Year Range): | Bullish | Bearish | Bearish-Extreme |
| NET POSITION MOVEMENT INDEX: | |||
| – 6-Week Change in Strength Index: | -0.9 | 2.3 | -13.6 |
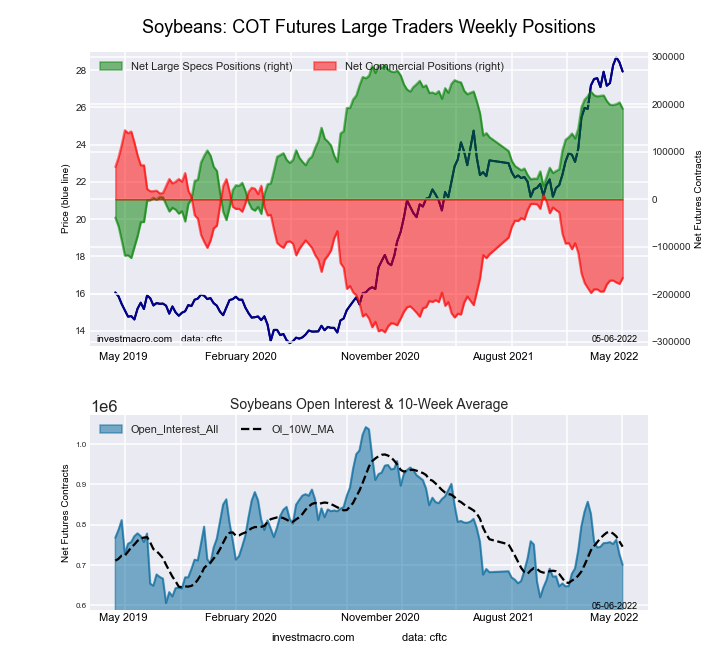
This week’s current strength score (the trader positioning range over the past three years, measured from 0 to 100) shows the speculators are currently Bullish with a score of 77.4 percent. The commercials are Bearish with a score of 27.1 percent and the small traders (not shown in chart) are Bearish with a score of 28.7 percent.
| SOYBEANS Futures Statistics | SPECULATORS | COMMERCIALS | SMALL TRADERS |
| – Percent of Open Interest Longs: | 34.2 | 46.5 | 7.3 |
| – Percent of Open Interest Shorts: | 7.0 | 70.1 | 10.9 |
| – Net Position: | 190,402 | -165,353 | -25,049 |
| – Gross Longs: | 239,355 | 325,746 | 51,469 |
| – Gross Shorts: | 48,953 | 491,099 | 76,518 |
| – Long to Short Ratio: | 4.9 to 1 | 0.7 to 1 | 0.7 to 1 |
| NET POSITION TREND: | |||
| – Strength Index Score (3 Year Range Pct): | 77.4 | 27.1 | 28.7 |
| – Strength Index Reading (3 Year Range): | Bullish | Bearish | Bearish |
| NET POSITION MOVEMENT INDEX: | |||
| – 6-Week Change in Strength Index: | -7.0 | 6.7 | -0.1 |
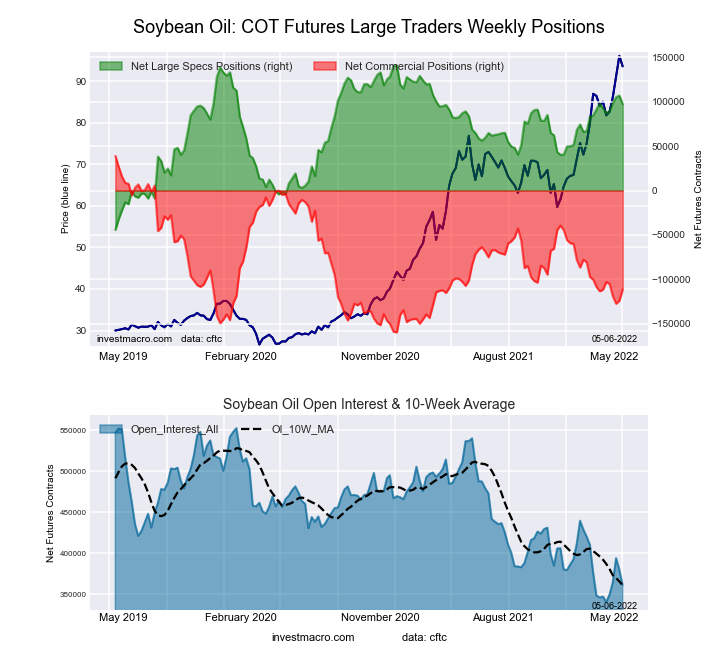
This week’s current strength score (the trader positioning range over the past three years, measured from 0 to 100) shows the speculators are currently Bullish with a score of 76.3 percent. The commercials are Bearish with a score of 24.3 percent and the small traders (not shown in chart) are Bullish with a score of 65.6 percent.
| SOYBEAN OIL Futures Statistics | SPECULATORS | COMMERCIALS | SMALL TRADERS |
| – Percent of Open Interest Longs: | 32.1 | 46.6 | 9.8 |
| – Percent of Open Interest Shorts: | 5.2 | 77.4 | 5.9 |
| – Net Position: | 97,291 | -111,267 | 13,976 |
| – Gross Longs: | 116,132 | 168,590 | 35,309 |
| – Gross Shorts: | 18,841 | 279,857 | 21,333 |
| – Long to Short Ratio: | 6.2 to 1 | 0.6 to 1 | 1.7 to 1 |
| NET POSITION TREND: | |||
| – Strength Index Score (3 Year Range Pct): | 76.3 | 24.3 | 65.6 |
| – Strength Index Reading (3 Year Range): | Bullish | Bearish | Bullish |
| NET POSITION MOVEMENT INDEX: | |||
| – 6-Week Change in Strength Index: | 2.5 | 0.1 | -18.5 |
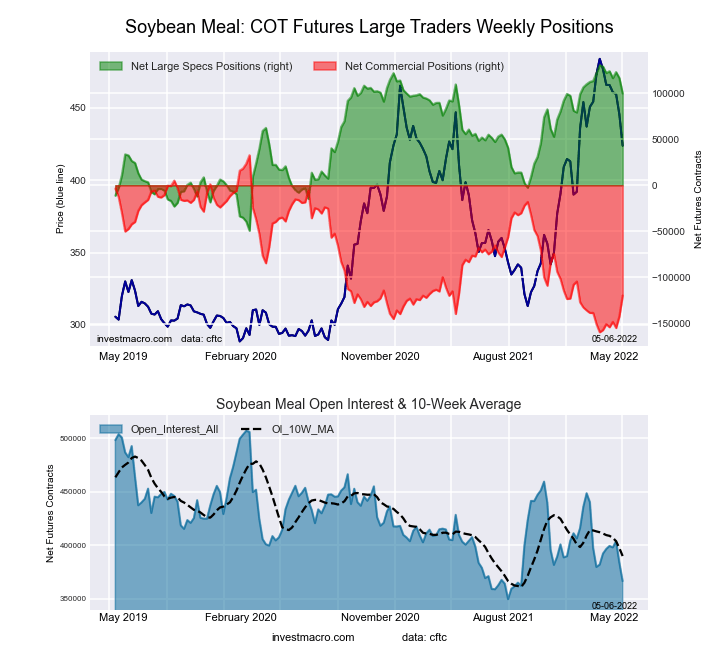
This week’s current strength score (the trader positioning range over the past three years, measured from 0 to 100) shows the speculators are currently Bullish-Extreme with a score of 82.9 percent. The commercials are Bearish with a score of 20.7 percent and the small traders (not shown in chart) are Bearish with a score of 38.3 percent.
| SOYBEAN MEAL Futures Statistics | SPECULATORS | COMMERCIALS | SMALL TRADERS |
| – Percent of Open Interest Longs: | 32.7 | 46.1 | 12.0 |
| – Percent of Open Interest Shorts: | 5.6 | 78.7 | 6.5 |
| – Net Position: | 99,561 | -119,714 | 20,153 |
| – Gross Longs: | 119,912 | 168,901 | 44,077 |
| – Gross Shorts: | 20,351 | 288,615 | 23,924 |
| – Long to Short Ratio: | 5.9 to 1 | 0.6 to 1 | 1.8 to 1 |
| NET POSITION TREND: | |||
| – Strength Index Score (3 Year Range Pct): | 82.9 | 20.7 | 38.3 |
| – Strength Index Reading (3 Year Range): | Bullish-Extreme | Bearish | Bearish |
| NET POSITION MOVEMENT INDEX: | |||
| – 6-Week Change in Strength Index: | -16.3 | 19.4 | -41.3 |
The LIVE CATTLE large speculator standing this week recorded a net position of 47,036 contracts in the data reported through Tuesday. This was a weekly reduction of -14,313 contracts from the previous week which had a total of 61,349 net contracts.
This week’s current strength score (the trader positioning range over the past three years, measured from 0 to 100) shows the speculators are currently Bearish with a score of 31.2 percent. The commercials are Bullish with a score of 64.2 percent and the small traders (not shown in chart) are Bullish with a score of 62.2 percent.
| LIVE CATTLE Futures Statistics | SPECULATORS | COMMERCIALS | SMALL TRADERS |
| – Percent of Open Interest Longs: | 36.8 | 38.5 | 9.6 |
| – Percent of Open Interest Shorts: | 21.7 | 51.9 | 11.5 |
| – Net Position: | 47,036 | -41,382 | -5,654 |
| – Gross Longs: | 114,213 | 119,484 | 29,911 |
| – Gross Shorts: | 67,177 | 160,866 | 35,565 |
| – Long to Short Ratio: | 1.7 to 1 | 0.7 to 1 | 0.8 to 1 |
| NET POSITION TREND: | |||
| – Strength Index Score (3 Year Range Pct): | 31.2 | 64.2 | 62.2 |
| – Strength Index Reading (3 Year Range): | Bearish | Bullish | Bullish |
| NET POSITION MOVEMENT INDEX: | |||
| – 6-Week Change in Strength Index: | 0.3 | -4.5 | 12.6 |
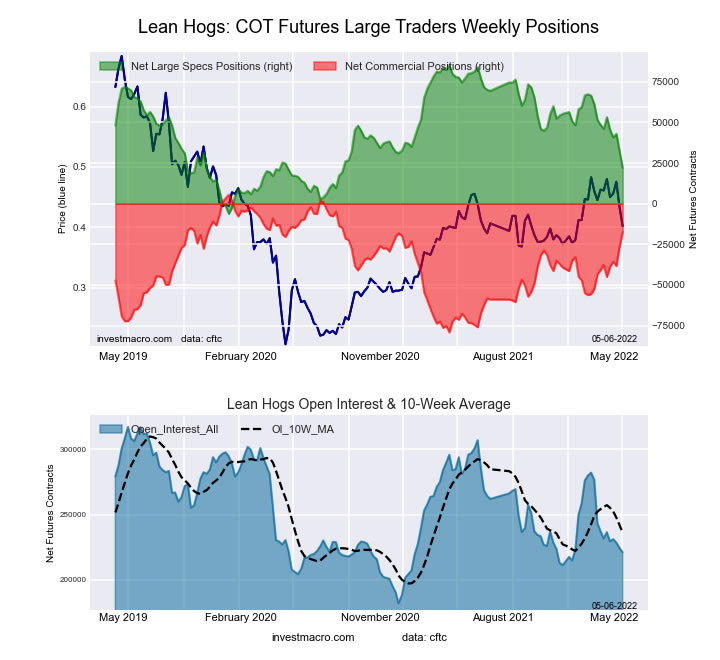
The LEAN HOGS large speculator standing this week recorded a net position of 22,031 contracts in the data reported through Tuesday. This was a weekly lowering of -10,305 contracts from the previous week which had a total of 32,336 net contracts.
This week’s current strength score (the trader positioning range over the past three years, measured from 0 to 100) shows the speculators are currently Bearish with a score of 30.7 percent. The commercials are Bullish with a score of 73.0 percent and the small traders (not shown in chart) are Bullish with a score of 72.3 percent.
| LEAN HOGS Futures Statistics | SPECULATORS | COMMERCIALS | SMALL TRADERS |
| – Percent of Open Interest Longs: | 32.1 | 37.2 | 10.0 |
| – Percent of Open Interest Shorts: | 22.2 | 45.1 | 12.1 |
| – Net Position: | 22,031 | -17,357 | -4,674 |
| – Gross Longs: | 71,110 | 82,388 | 22,152 |
| – Gross Shorts: | 49,079 | 99,745 | 26,826 |
| – Long to Short Ratio: | 1.4 to 1 | 0.8 to 1 | 0.8 to 1 |
| NET POSITION TREND: | |||
| – Strength Index Score (3 Year Range Pct): | 30.7 | 73.0 | 72.3 |
| – Strength Index Reading (3 Year Range): | Bearish | Bullish | Bullish |
| NET POSITION MOVEMENT INDEX: | |||
| – 6-Week Change in Strength Index: | -26.1 | 24.2 | 18.1 |
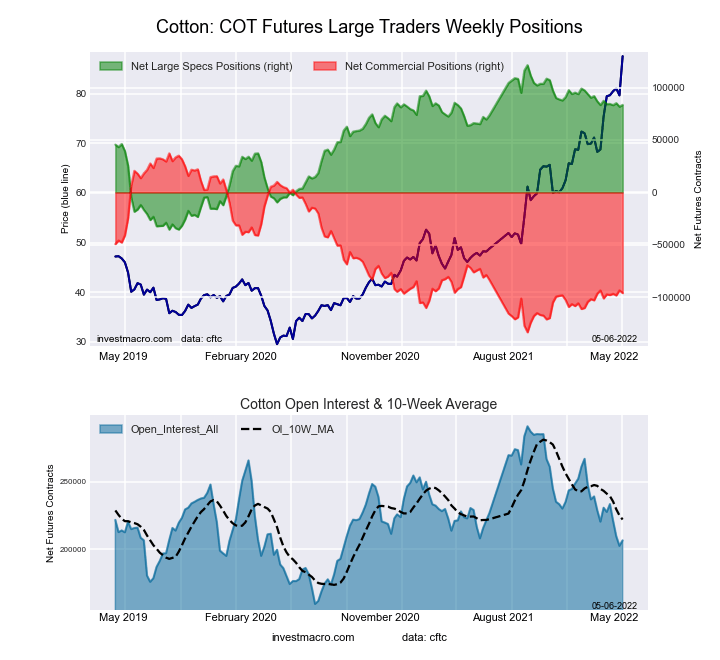
This week’s current strength score (the trader positioning range over the past three years, measured from 0 to 100) shows the speculators are currently Bullish with a score of 75.8 percent. The commercials are Bearish with a score of 21.9 percent and the small traders (not shown in chart) are Bullish-Extreme with a score of 91.4 percent.
| COTTON Futures Statistics | SPECULATORS | COMMERCIALS | SMALL TRADERS |
| – Percent of Open Interest Longs: | 46.2 | 34.0 | 9.3 |
| – Percent of Open Interest Shorts: | 5.8 | 80.4 | 3.3 |
| – Net Position: | 83,433 | -95,908 | 12,475 |
| – Gross Longs: | 95,320 | 70,082 | 19,238 |
| – Gross Shorts: | 11,887 | 165,990 | 6,763 |
| – Long to Short Ratio: | 8.0 to 1 | 0.4 to 1 | 2.8 to 1 |
| NET POSITION TREND: | |||
| – Strength Index Score (3 Year Range Pct): | 75.8 | 21.9 | 91.4 |
| – Strength Index Reading (3 Year Range): | Bullish | Bearish | Bullish-Extreme |
| NET POSITION MOVEMENT INDEX: | |||
| – 6-Week Change in Strength Index: | -2.5 | 3.0 | -7.4 |
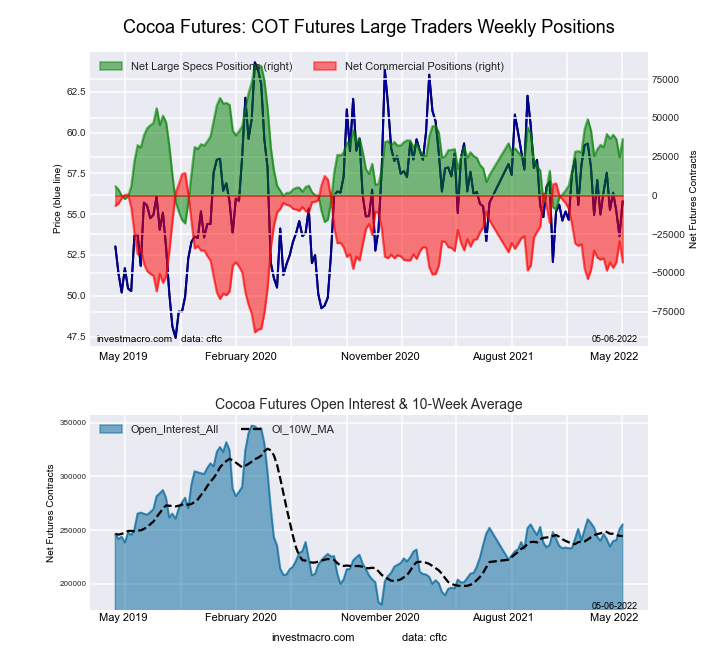
This week’s current strength score (the trader positioning range over the past three years, measured from 0 to 100) shows the speculators are currently Bullish with a score of 53.5 percent. The commercials are Bearish with a score of 43.8 percent and the small traders (not shown in chart) are Bullish with a score of 63.8 percent.
| COCOA Futures Statistics | SPECULATORS | COMMERCIALS | SMALL TRADERS |
| – Percent of Open Interest Longs: | 33.5 | 42.2 | 6.1 |
| – Percent of Open Interest Shorts: | 19.2 | 59.2 | 3.5 |
| – Net Position: | 36,559 | -43,277 | 6,718 |
| – Gross Longs: | 85,562 | 107,815 | 15,602 |
| – Gross Shorts: | 49,003 | 151,092 | 8,884 |
| – Long to Short Ratio: | 1.7 to 1 | 0.7 to 1 | 1.8 to 1 |
| NET POSITION TREND: | |||
| – Strength Index Score (3 Year Range Pct): | 53.5 | 43.8 | 63.8 |
| – Strength Index Reading (3 Year Range): | Bullish | Bearish | Bullish |
| NET POSITION MOVEMENT INDEX: | |||
| – 6-Week Change in Strength Index: | 5.2 | -2.7 | -26.2 |
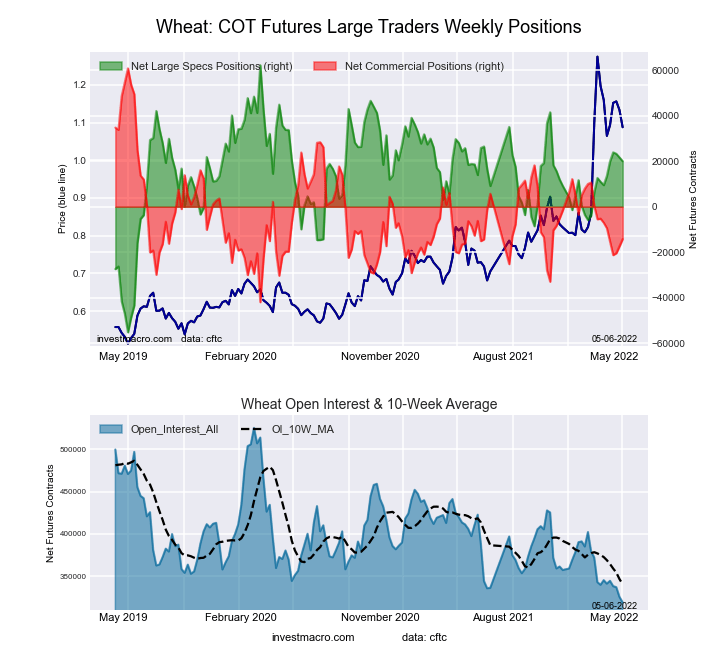
This week’s current strength score (the trader positioning range over the past three years, measured from 0 to 100) shows the speculators are currently Bullish with a score of 60.0 percent. The commercials are Bearish with a score of 30.3 percent and the small traders (not shown in chart) are Bullish-Extreme with a score of 82.3 percent.
| WHEAT Futures Statistics | SPECULATORS | COMMERCIALS | SMALL TRADERS |
| – Percent of Open Interest Longs: | 34.9 | 38.8 | 8.6 |
| – Percent of Open Interest Shorts: | 28.6 | 43.3 | 10.4 |
| – Net Position: | 20,012 | -14,225 | -5,787 |
| – Gross Longs: | 111,438 | 124,006 | 27,445 |
| – Gross Shorts: | 91,426 | 138,231 | 33,232 |
| – Long to Short Ratio: | 1.2 to 1 | 0.9 to 1 | 0.8 to 1 |
| NET POSITION TREND: | |||
| – Strength Index Score (3 Year Range Pct): | 60.0 | 30.3 | 82.3 |
| – Strength Index Reading (3 Year Range): | Bullish | Bearish | Bullish-Extreme |
| NET POSITION MOVEMENT INDEX: | |||
| – 6-Week Change in Strength Index: | 10.0 | -7.9 | -17.7 |
Article By InvestMacro – Receive our weekly COT Reports by Email
*COT Report: The COT data, released weekly to the public each Friday, is updated through the most recent Tuesday (data is 3 days old) and shows a quick view of how large speculators or non-commercials (for-profit traders) were positioned in the futures markets.
The CFTC categorizes trader positions according to commercial hedgers (traders who use futures contracts for hedging as part of the business), non-commercials (large traders who speculate to realize trading profits) and nonreportable traders (usually small traders/speculators) as well as their open interest (contracts open in the market at time of reporting).See CFTC criteria here.
By JustMarkets The US equities ended Wednesday’s session lower amid investor caution ahead of the…
By Analytical Department RoboForex EUR/USD rose to 1.1429 on Thursday, with the US dollar continuing…
By Laura Russo, University of Tennessee A surprisingly large number and diversity of bee species…
By JustMarkets The US stock indices ended Tuesday with confident gains, fully driven by a…
By Analytical Department RoboForex Gold traded around 4,080 USD per ounce on Wednesday, having risen…
By JustMarkets The US stock indices started the week on a downbeat note. By the…
This website uses cookies.