By InvestMacro | COT | Data Tables | COT Leaders | Downloads | COT Newsletter
Here are the latest charts and statistics for the Commitment of Traders (COT) data published by the Commodities Futures Trading Commission (CFTC).
The latest COT data is updated through Tuesday April 19th and shows a quick view of how large traders (for-profit speculators and commercial entities) were positioned in the futures markets.
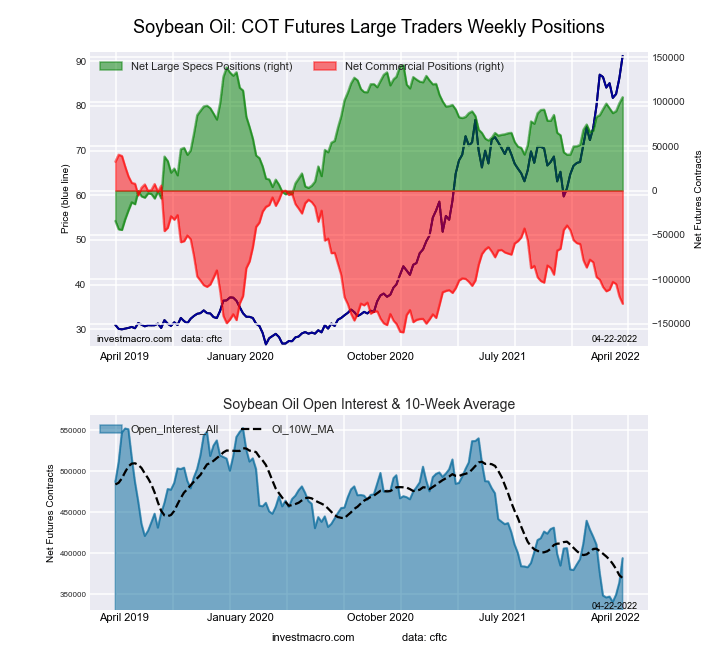
Highlighting the COT soft commodities data is the recent rises in Soybean Oil futures bets. The speculative net position in the Soybean Oil futures has gained for three straight weeks and has increased in eight out of the past ten weeks. Soybean Oil speculator positions have added a total of +39,176 contracts over the past ten weeks as well. This ascent in bullish bets has brought the current overall position to over +100,000 net contracts and to the highest level of the past fifty-six weeks, dating back to March 23rd of 2021.
Soybean Oil prices raced to a record high level at over $80 per pound this week and surpassed the previous price peaks of 2008 and 2021. The Soybean Oil prices have had a strong fundamental component driving it higher. The war in Ukraine has created a major disruption in Sunflower Oils (Ukraine and Russia are major suppliers) that has pushed the prices in alternative oils and other soft commodities sharply higher. Reuters news service also cited an Indonesia ban on exports of Palm Oil as having caused an even greater demand for alternative vegetable oils. The dreary outlook for vegetable oil production could mean we see even higher Soybean Oil prices.
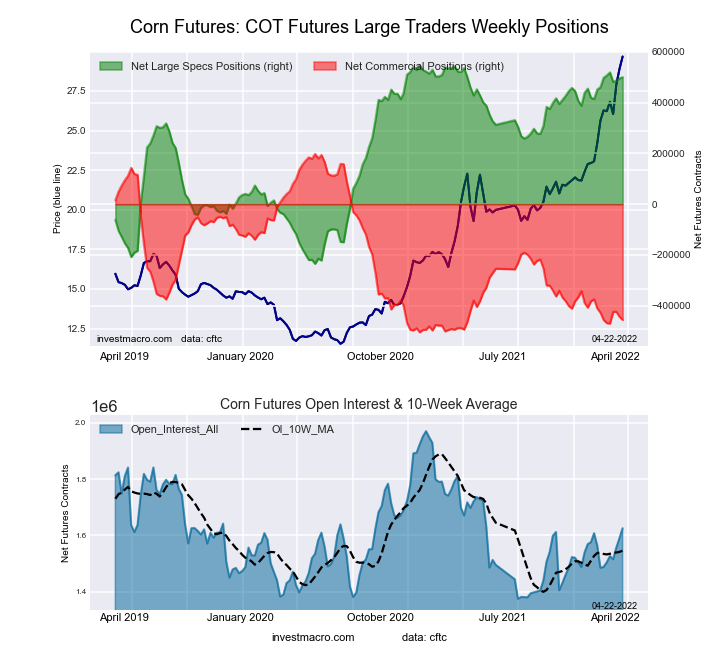
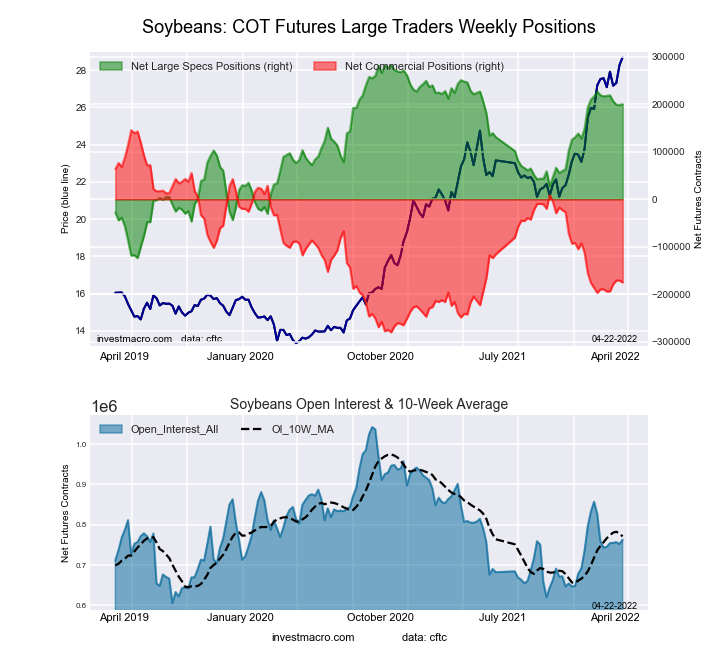
Overall, the soft commodities that saw higher bets this week were Corn (5,031 contracts), Soybeans (1,803 contracts), Soybean Oil (6,887 contracts), Soybean Meal (6,498 contracts), Live Cattle (2,683 contracts), Lean Hogs (2,231 contracts) and Cotton (1,900 contracts).
Free Reports:
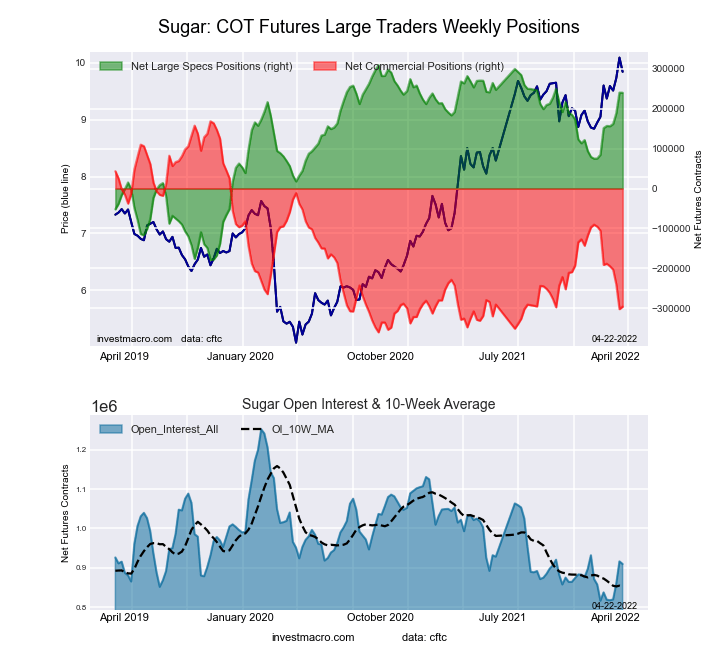
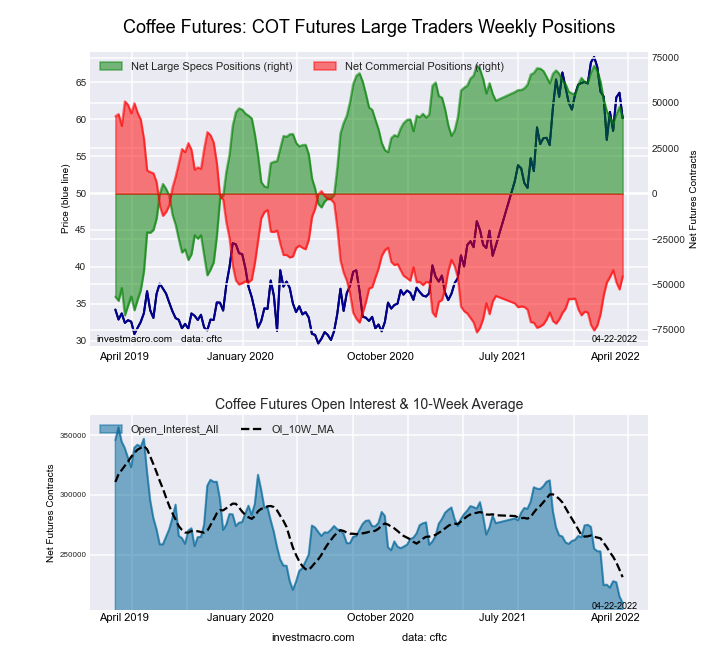
The soft commodities that saw lower bets this week were Sugar (-349 contracts), Coffee (-6,126 contracts), Cocoa (-2,802 contracts) and Wheat (-641 contracts).
| Apr-19-2022 | OI | OI-Index | Spec-Net | Spec-Index | Com-Net | COM-Index | Smalls-Net | Smalls-Index |
|---|---|---|---|---|---|---|---|---|
| WTI Crude | 1,740,300 | 0 | 307,697 | 1 | -351,252 | 100 | 43,555 | 76 |
| Gold | 575,202 | 40 | 239,757 | 60 | -275,525 | 37 | 35,768 | 66 |
| Silver | 170,577 | 35 | 46,429 | 69 | -63,288 | 37 | 16,859 | 41 |
| Copper | 203,896 | 29 | 18,840 | 56 | -28,307 | 40 | 9,467 | 80 |
| Palladium | 6,435 | 0 | -2,182 | 9 | 1,560 | 85 | 622 | 80 |
| Platinum | 61,603 | 24 | 7,537 | 13 | -13,812 | 89 | 6,275 | 50 |
| Natural Gas | 1,144,047 | 14 | -130,006 | 40 | 82,113 | 57 | 47,893 | 100 |
| Brent | 191,883 | 33 | -40,102 | 44 | 37,663 | 56 | 2,439 | 42 |
| Heating Oil | 349,618 | 31 | 6,455 | 52 | -32,434 | 37 | 25,979 | 88 |
| Soybeans | 762,855 | 36 | 200,098 | 80 | -174,873 | 25 | -25,225 | 28 |
| Corn | 1,625,198 | 42 | 500,612 | 94 | -456,269 | 7 | -44,343 | 18 |
| Coffee | 209,410 | 0 | 41,803 | 79 | -45,447 | 24 | 3,644 | 15 |
| Sugar | 909,622 | 21 | 239,515 | 86 | -295,470 | 12 | 55,955 | 77 |
| Wheat | 337,038 | 1 | 23,245 | 67 | -20,425 | 21 | -2,820 | 98 |
This week’s current strength score (the trader positioning range over the past three years, measured from 0 to 100) shows the speculators are currently Bullish-Extreme with a score of 94.0 percent. The commercials are Bearish-Extreme with a score of 6.9 percent and the small traders (not shown in chart) are Bearish-Extreme with a score of 17.5 percent.
| CORN Futures Statistics | SPECULATORS | COMMERCIALS | SMALL TRADERS |
| – Percent of Open Interest Longs: | 36.1 | 45.0 | 9.4 |
| – Percent of Open Interest Shorts: | 5.3 | 73.1 | 12.1 |
| – Net Position: | 500,612 | -456,269 | -44,343 |
| – Gross Longs: | 586,638 | 731,004 | 152,407 |
| – Gross Shorts: | 86,026 | 1,187,273 | 196,750 |
| – Long to Short Ratio: | 6.8 to 1 | 0.6 to 1 | 0.8 to 1 |
| NET POSITION TREND: | |||
| – Strength Index Score (3 Year Range Pct): | 94.0 | 6.9 | 17.5 |
| – Strength Index Reading (3 Year Range): | Bullish-Extreme | Bearish-Extreme | Bearish-Extreme |
| NET POSITION MOVEMENT INDEX: | |||
| – 6-Week Change in Strength Index: | 0.3 | 0.1 | -1.7 |
This week’s current strength score (the trader positioning range over the past three years, measured from 0 to 100) shows the speculators are currently Bullish-Extreme with a score of 85.8 percent. The commercials are Bearish-Extreme with a score of 12.1 percent and the small traders (not shown in chart) are Bullish with a score of 77.0 percent.
| SUGAR Futures Statistics | SPECULATORS | COMMERCIALS | SMALL TRADERS |
| – Percent of Open Interest Longs: | 32.6 | 44.2 | 11.6 |
| – Percent of Open Interest Shorts: | 6.3 | 76.7 | 5.5 |
| – Net Position: | 239,515 | -295,470 | 55,955 |
| – Gross Longs: | 296,437 | 402,400 | 105,565 |
| – Gross Shorts: | 56,922 | 697,870 | 49,610 |
| – Long to Short Ratio: | 5.2 to 1 | 0.6 to 1 | 2.1 to 1 |
| NET POSITION TREND: | |||
| – Strength Index Score (3 Year Range Pct): | 85.8 | 12.1 | 77.0 |
| – Strength Index Reading (3 Year Range): | Bullish-Extreme | Bearish-Extreme | Bullish |
| NET POSITION MOVEMENT INDEX: | |||
| – 6-Week Change in Strength Index: | 18.2 | -19.8 | 20.0 |
This week’s current strength score (the trader positioning range over the past three years, measured from 0 to 100) shows the speculators are currently Bullish with a score of 78.5 percent. The commercials are Bearish with a score of 24.5 percent and the small traders (not shown in chart) are Bearish-Extreme with a score of 15.4 percent.
| COFFEE Futures Statistics | SPECULATORS | COMMERCIALS | SMALL TRADERS |
| – Percent of Open Interest Longs: | 25.5 | 53.8 | 4.7 |
| – Percent of Open Interest Shorts: | 5.5 | 75.5 | 2.9 |
| – Net Position: | 41,803 | -45,447 | 3,644 |
| – Gross Longs: | 53,423 | 112,616 | 9,760 |
| – Gross Shorts: | 11,620 | 158,063 | 6,116 |
| – Long to Short Ratio: | 4.6 to 1 | 0.7 to 1 | 1.6 to 1 |
| NET POSITION TREND: | |||
| – Strength Index Score (3 Year Range Pct): | 78.5 | 24.5 | 15.4 |
| – Strength Index Reading (3 Year Range): | Bullish | Bearish | Bearish-Extreme |
| NET POSITION MOVEMENT INDEX: | |||
| – 6-Week Change in Strength Index: | -7.6 | 8.4 | -2.5 |
This week’s current strength score (the trader positioning range over the past three years, measured from 0 to 100) shows the speculators are currently Bullish with a score of 79.8 percent. The commercials are Bearish with a score of 24.7 percent and the small traders (not shown in chart) are Bearish with a score of 28.4 percent.
| SOYBEANS Futures Statistics | SPECULATORS | COMMERCIALS | SMALL TRADERS |
| – Percent of Open Interest Longs: | 32.8 | 46.0 | 7.2 |
| – Percent of Open Interest Shorts: | 6.6 | 69.0 | 10.5 |
| – Net Position: | 200,098 | -174,873 | -25,225 |
| – Gross Longs: | 250,566 | 351,286 | 55,231 |
| – Gross Shorts: | 50,468 | 526,159 | 80,456 |
| – Long to Short Ratio: | 5.0 to 1 | 0.7 to 1 | 0.7 to 1 |
| NET POSITION TREND: | |||
| – Strength Index Score (3 Year Range Pct): | 79.8 | 24.7 | 28.4 |
| – Strength Index Reading (3 Year Range): | Bullish | Bearish | Bearish |
| NET POSITION MOVEMENT INDEX: | |||
| – 6-Week Change in Strength Index: | -4.1 | 3.4 | 3.6 |
This week’s current strength score (the trader positioning range over the past three years, measured from 0 to 100) shows the speculators are currently Bullish-Extreme with a score of 80.6 percent. The commercials are Bearish-Extreme with a score of 16.1 percent and the small traders (not shown in chart) are Bullish-Extreme with a score of 96.2 percent.
| SOYBEAN OIL Futures Statistics | SPECULATORS | COMMERCIALS | SMALL TRADERS |
| – Percent of Open Interest Longs: | 31.5 | 44.2 | 10.5 |
| – Percent of Open Interest Shorts: | 4.8 | 76.5 | 4.9 |
| – Net Position: | 105,211 | -127,399 | 22,188 |
| – Gross Longs: | 124,302 | 174,162 | 41,383 |
| – Gross Shorts: | 19,091 | 301,561 | 19,195 |
| – Long to Short Ratio: | 6.5 to 1 | 0.6 to 1 | 2.2 to 1 |
| NET POSITION TREND: | |||
| – Strength Index Score (3 Year Range Pct): | 80.6 | 16.1 | 96.2 |
| – Strength Index Reading (3 Year Range): | Bullish-Extreme | Bearish-Extreme | Bullish-Extreme |
| NET POSITION MOVEMENT INDEX: | |||
| – 6-Week Change in Strength Index: | 7.3 | -9.5 | 20.0 |
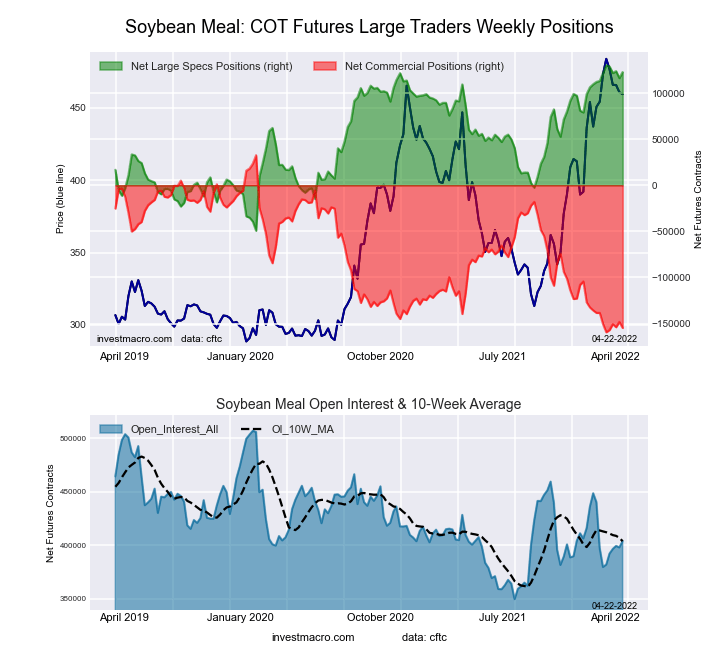
This week’s current strength score (the trader positioning range over the past three years, measured from 0 to 100) shows the speculators are currently Bullish-Extreme with a score of 95.8 percent. The commercials are Bearish-Extreme with a score of 2.4 percent and the small traders (not shown in chart) are Bullish-Extreme with a score of 99.0 percent.
| SOYBEAN MEAL Futures Statistics | SPECULATORS | COMMERCIALS | SMALL TRADERS |
| – Percent of Open Interest Longs: | 33.5 | 42.4 | 13.1 |
| – Percent of Open Interest Shorts: | 3.1 | 80.7 | 5.2 |
| – Net Position: | 122,756 | -154,801 | 32,045 |
| – Gross Longs: | 135,397 | 171,107 | 52,874 |
| – Gross Shorts: | 12,641 | 325,908 | 20,829 |
| – Long to Short Ratio: | 10.7 to 1 | 0.5 to 1 | 2.5 to 1 |
| NET POSITION TREND: | |||
| – Strength Index Score (3 Year Range Pct): | 95.8 | 2.4 | 99.0 |
| – Strength Index Reading (3 Year Range): | Bullish-Extreme | Bearish-Extreme | Bullish-Extreme |
| NET POSITION MOVEMENT INDEX: | |||
| – 6-Week Change in Strength Index: | 0.6 | -2.2 | 13.0 |
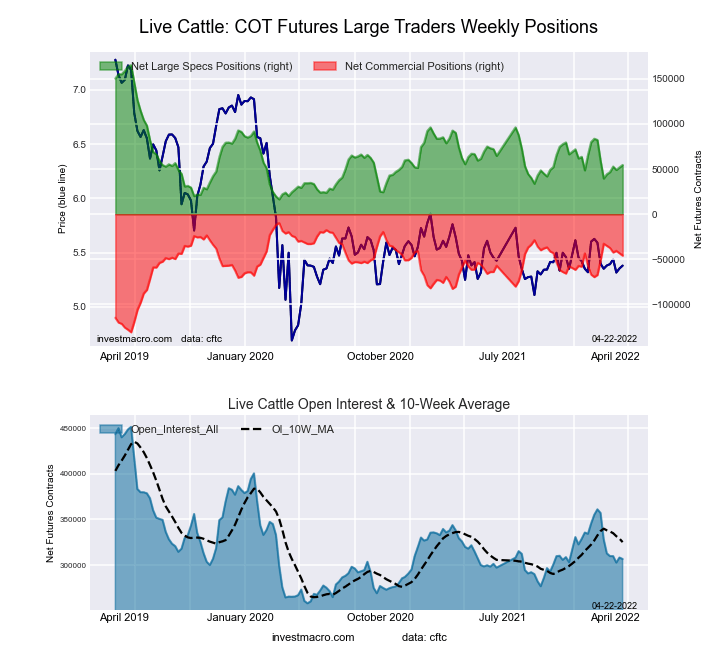
This week’s current strength score (the trader positioning range over the past three years, measured from 0 to 100) shows the speculators are currently Bearish with a score of 29.5 percent. The commercials are Bullish with a score of 67.0 percent and the small traders (not shown in chart) are Bullish with a score of 56.0 percent.
| LIVE CATTLE Futures Statistics | SPECULATORS | COMMERCIALS | SMALL TRADERS |
| – Percent of Open Interest Longs: | 37.6 | 39.8 | 10.1 |
| – Percent of Open Interest Shorts: | 19.8 | 54.8 | 12.9 |
| – Net Position: | 54,525 | -45,886 | -8,639 |
| – Gross Longs: | 115,285 | 122,065 | 30,955 |
| – Gross Shorts: | 60,760 | 167,951 | 39,594 |
| – Long to Short Ratio: | 1.9 to 1 | 0.7 to 1 | 0.8 to 1 |
| NET POSITION TREND: | |||
| – Strength Index Score (3 Year Range Pct): | 29.5 | 67.0 | 56.0 |
| – Strength Index Reading (3 Year Range): | Bearish | Bullish | Bullish |
| NET POSITION MOVEMENT INDEX: | |||
| – 6-Week Change in Strength Index: | 11.6 | -12.0 | -5.7 |
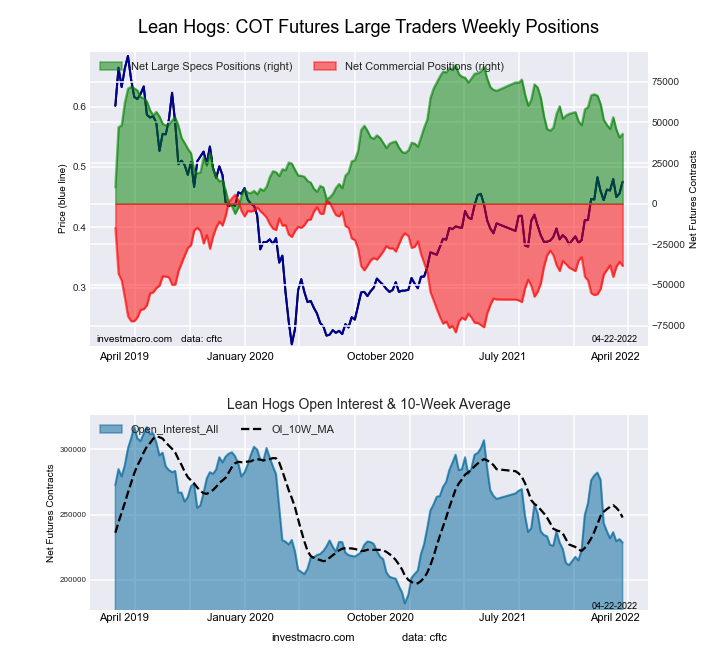
This week’s current strength score (the trader positioning range over the past three years, measured from 0 to 100) shows the speculators are currently Bullish with a score of 53.6 percent. The commercials are Bearish with a score of 48.2 percent and the small traders (not shown in chart) are Bullish with a score of 69.8 percent.
| LEAN HOGS Futures Statistics | SPECULATORS | COMMERCIALS | SMALL TRADERS |
| – Percent of Open Interest Longs: | 36.4 | 34.4 | 10.7 |
| – Percent of Open Interest Shorts: | 17.6 | 51.1 | 12.7 |
| – Net Position: | 43,002 | -38,275 | -4,727 |
| – Gross Longs: | 83,133 | 78,601 | 24,424 |
| – Gross Shorts: | 40,131 | 116,876 | 29,151 |
| – Long to Short Ratio: | 2.1 to 1 | 0.7 to 1 | 0.8 to 1 |
| NET POSITION TREND: | |||
| – Strength Index Score (3 Year Range Pct): | 53.6 | 48.2 | 69.8 |
| – Strength Index Reading (3 Year Range): | Bullish | Bearish | Bullish |
| NET POSITION MOVEMENT INDEX: | |||
| – 6-Week Change in Strength Index: | -9.3 | 6.1 | 16.7 |
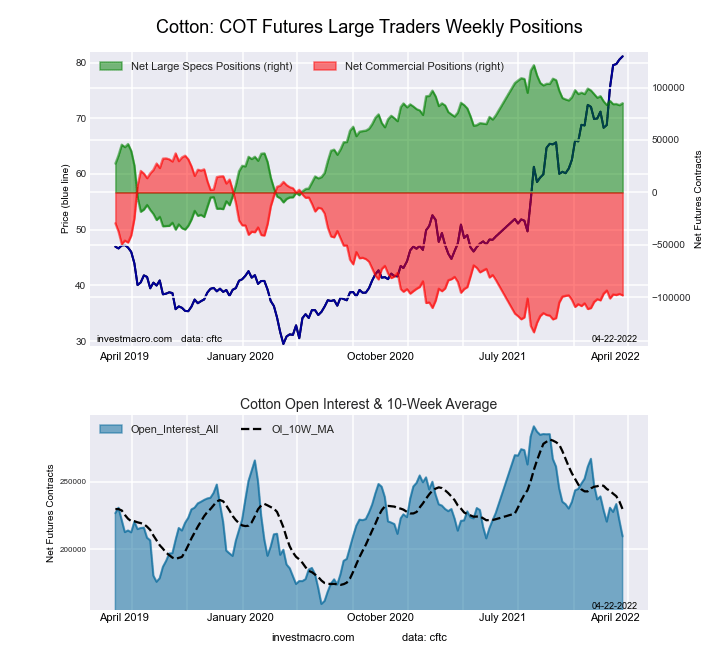
This week’s current strength score (the trader positioning range over the past three years, measured from 0 to 100) shows the speculators are currently Bullish with a score of 76.9 percent. The commercials are Bearish with a score of 20.6 percent and the small traders (not shown in chart) are Bullish-Extreme with a score of 94.6 percent.
| COTTON Futures Statistics | SPECULATORS | COMMERCIALS | SMALL TRADERS |
| – Percent of Open Interest Longs: | 46.6 | 35.0 | 9.4 |
| – Percent of Open Interest Shorts: | 6.0 | 81.8 | 3.1 |
| – Net Position: | 85,120 | -98,107 | 12,987 |
| – Gross Longs: | 97,613 | 73,296 | 19,582 |
| – Gross Shorts: | 12,493 | 171,403 | 6,595 |
| – Long to Short Ratio: | 7.8 to 1 | 0.4 to 1 | 3.0 to 1 |
| NET POSITION TREND: | |||
| – Strength Index Score (3 Year Range Pct): | 76.9 | 20.6 | 94.6 |
| – Strength Index Reading (3 Year Range): | Bullish | Bearish | Bullish-Extreme |
| NET POSITION MOVEMENT INDEX: | |||
| – 6-Week Change in Strength Index: | -1.1 | -1.0 | 20.9 |
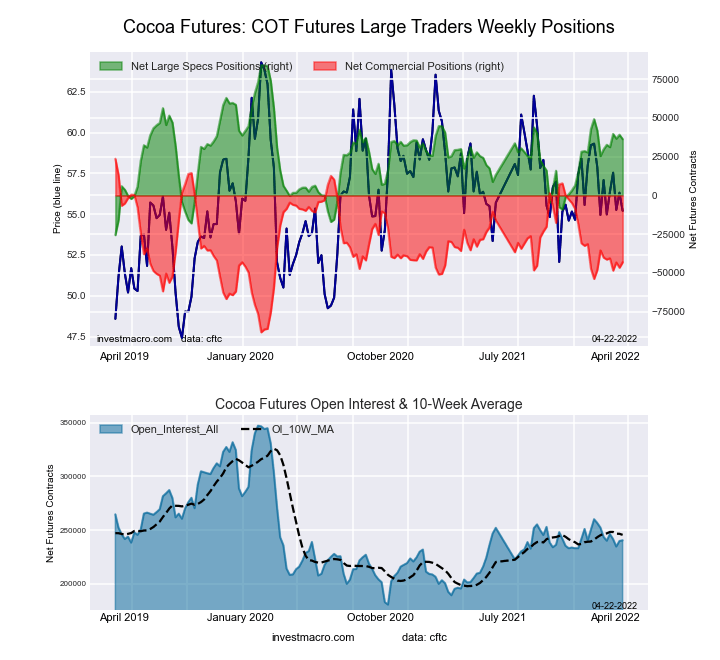
This week’s current strength score (the trader positioning range over the past three years, measured from 0 to 100) shows the speculators are currently Bullish with a score of 53.3 percent. The commercials are Bearish with a score of 44.0 percent and the small traders (not shown in chart) are Bullish with a score of 65.1 percent.
| COCOA Futures Statistics | SPECULATORS | COMMERCIALS | SMALL TRADERS |
| – Percent of Open Interest Longs: | 31.5 | 45.6 | 6.3 |
| – Percent of Open Interest Shorts: | 16.4 | 63.5 | 3.5 |
| – Net Position: | 36,357 | -43,099 | 6,742 |
| – Gross Longs: | 75,822 | 109,538 | 15,230 |
| – Gross Shorts: | 39,465 | 152,637 | 8,488 |
| – Long to Short Ratio: | 1.9 to 1 | 0.7 to 1 | 1.8 to 1 |
| NET POSITION TREND: | |||
| – Strength Index Score (3 Year Range Pct): | 53.3 | 44.0 | 65.1 |
| – Strength Index Reading (3 Year Range): | Bullish | Bearish | Bullish |
| NET POSITION MOVEMENT INDEX: | |||
| – 6-Week Change in Strength Index: | 6.5 | -2.9 | -34.9 |
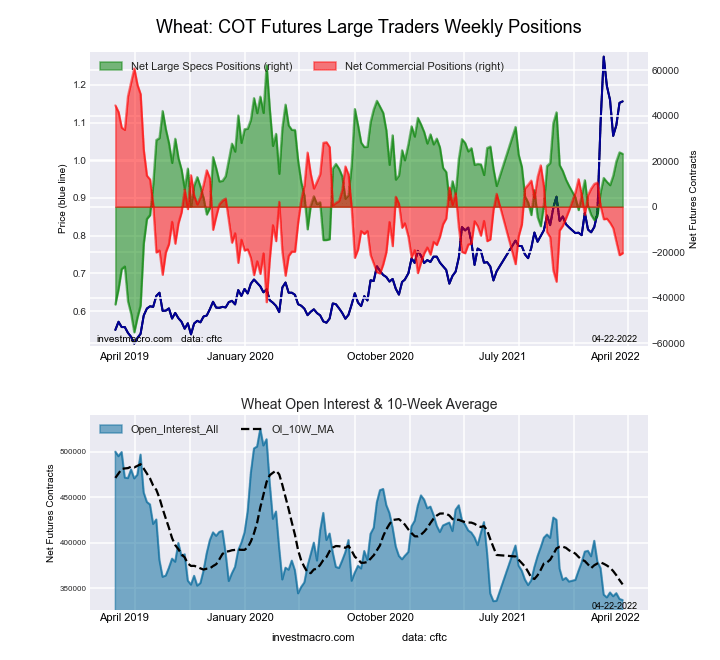
This week’s current strength score (the trader positioning range over the past three years, measured from 0 to 100) shows the speculators are currently Bullish with a score of 66.8 percent. The commercials are Bearish with a score of 21.0 percent and the small traders (not shown in chart) are Bullish-Extreme with a score of 98.1 percent.
| WHEAT Futures Statistics | SPECULATORS | COMMERCIALS | SMALL TRADERS |
| – Percent of Open Interest Longs: | 36.0 | 37.6 | 9.5 |
| – Percent of Open Interest Shorts: | 29.1 | 43.7 | 10.4 |
| – Net Position: | 23,245 | -20,425 | -2,820 |
| – Gross Longs: | 121,339 | 126,766 | 32,116 |
| – Gross Shorts: | 98,094 | 147,191 | 34,936 |
| – Long to Short Ratio: | 1.2 to 1 | 0.9 to 1 | 0.9 to 1 |
| NET POSITION TREND: | |||
| – Strength Index Score (3 Year Range Pct): | 66.8 | 21.0 | 98.1 |
| – Strength Index Reading (3 Year Range): | Bullish | Bearish | Bullish-Extreme |
| NET POSITION MOVEMENT INDEX: | |||
| – 6-Week Change in Strength Index: | 9.0 | -14.5 | 22.9 |
Article By InvestMacro – Receive our weekly COT Reports by Email
*COT Report: The COT data, released weekly to the public each Friday, is updated through the most recent Tuesday (data is 3 days old) and shows a quick view of how large speculators or non-commercials (for-profit traders) were positioned in the futures markets.
The CFTC categorizes trader positions according to commercial hedgers (traders who use futures contracts for hedging as part of the business), non-commercials (large traders who speculate to realize trading profits) and nonreportable traders (usually small traders/speculators) as well as their open interest (contracts open in the market at time of reporting).See CFTC criteria here.
By Analytical Department RoboForex Gold fell to 4,033 USD per ounce on Thursday, extending its…
By JustMarkets By the end of the day, the Dow Jones Index (US30) rose by…
By JustMarkets On Tuesday, the US stock indices finished the session in the green, supported…
By Analytical Department RoboForex GBP/USD rose to 1.3403 on Wednesday, with British politics taking centre…
By Analytical Department RoboForex USD/JPY ended Tuesday at 162.27, with the Japanese yen remaining near…
By JustMarkets On Friday, the Dow Jones Index (US30) rose by 0.29% (weekly: -0.36%). The…
This website uses cookies.