By InvestMacro | COT | Data Tables | COT Leaders | Downloads | COT Newsletter
Here are the latest charts and statistics for the Commitment of Traders (COT) data published by the Commodities Futures Trading Commission (CFTC).
The latest COT data is updated through Tuesday March 29th and shows a quick view of how large traders (for-profit speculators and commercial entities) were positioned in the futures markets.
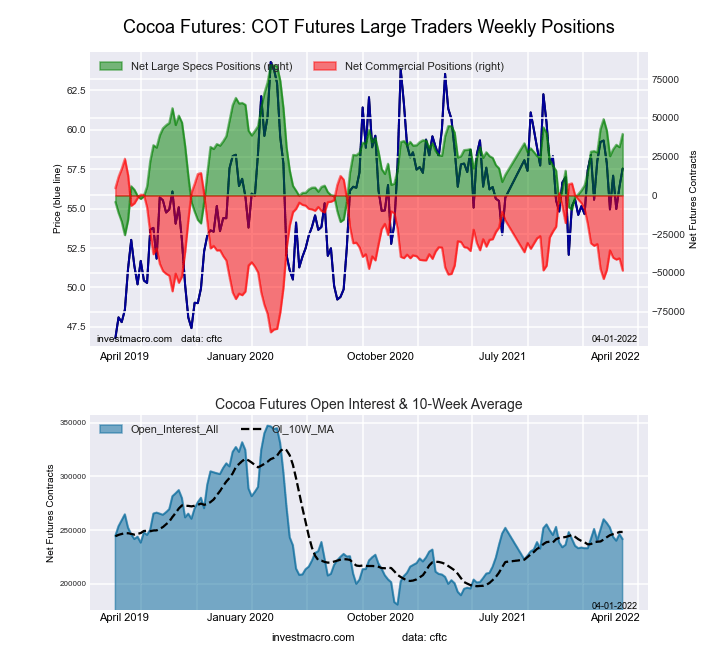
Highlighting the COT soft commodities data is the recent rises in Cocoa futures bets. The speculative net position in the Cocoa futures rose this week by the largest one-week amount in the past seven weeks and rose for the third time in the past four weeks. This week’s boost brought the current net standing to the highest standing in the past five weeks at just under the +40,000 net position level. The Cocoa speculator position has been mostly in bullish territory over the past three years with small, short-lived pockets in bearish territory along the way. Cocoa saw its highest sentiment levels of the past three years in early 2020 with speculator positions reaching over +80,000 contracts before spec positions dropped sharply as the pandemic began. Speculator bets fell as low as -17,038 contracts in July 2020. Since then, Cocoa bets have fluctuated between small bearish levels all the way up to +40,000 contracts while the Cocoa price has similarly fluctuated but has maintained a bullish uptrend. This week’s +39,674 contracts level marks a 56.5 percent strength index score which equates to a slightly bullish level compared to the past three years.
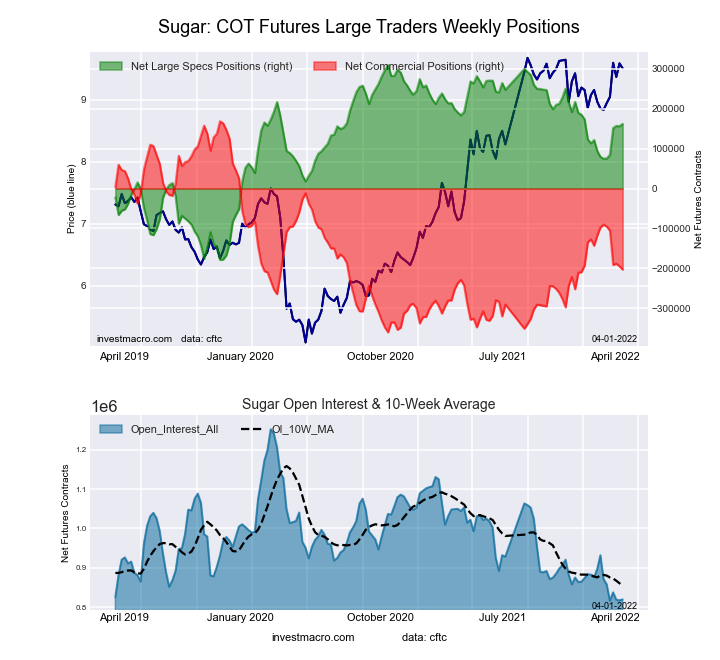
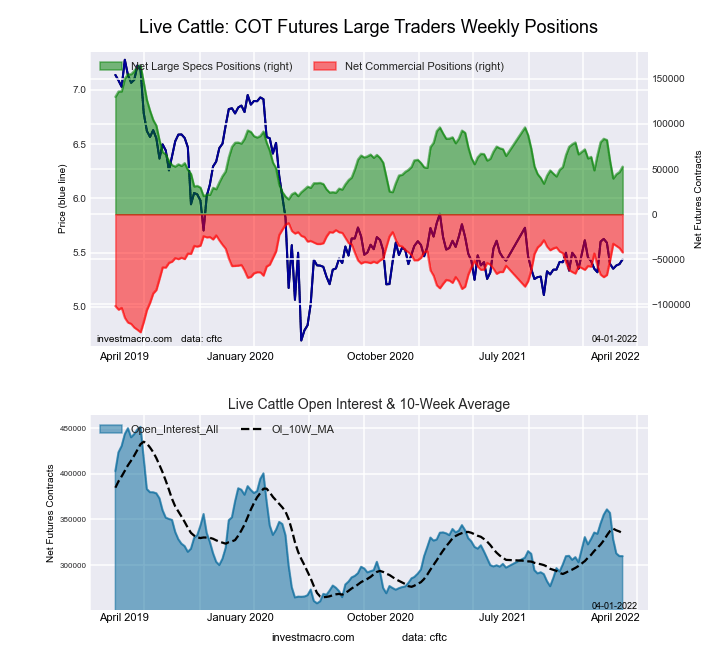
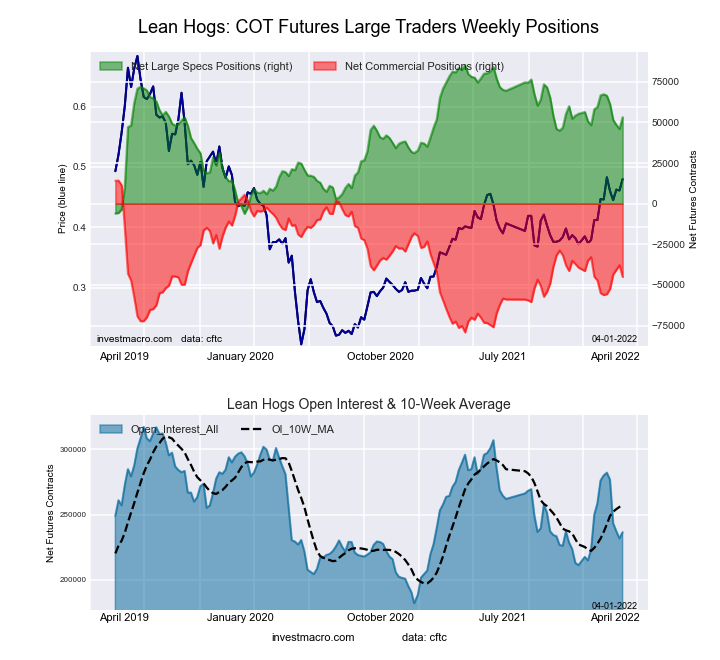
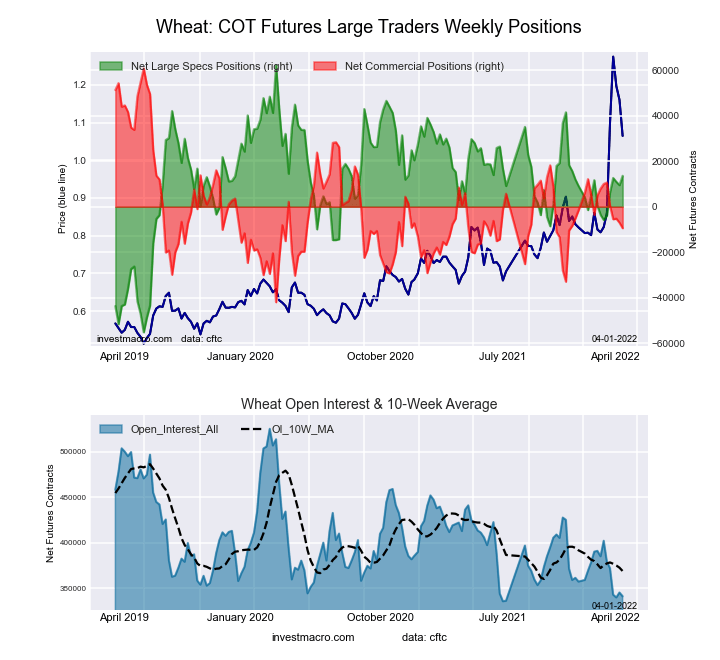
All of the soft commodities that saw higher bets this week were Sugar (5,785 contracts), Live Cattle (6,006 contracts), Lean Hogs (7,209 contracts), Cocoa (8,470 contracts) and Wheat (4,069 contracts).
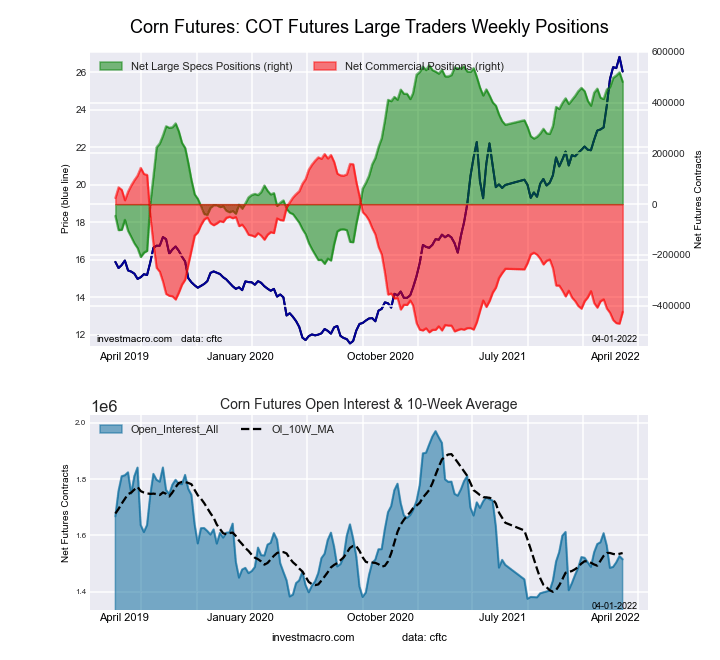
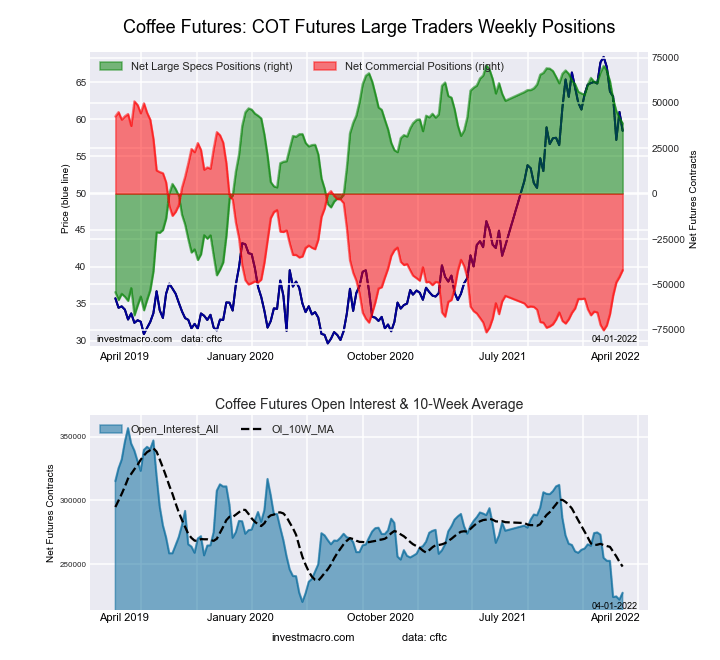
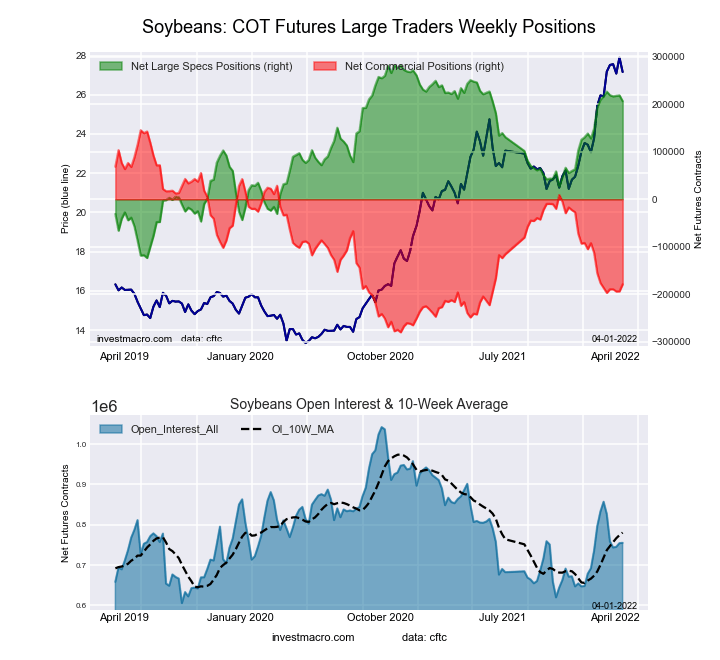
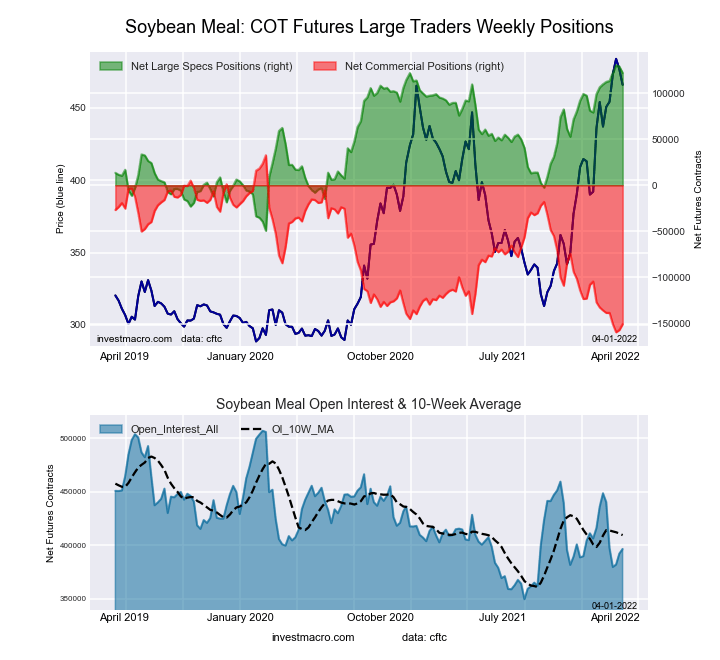
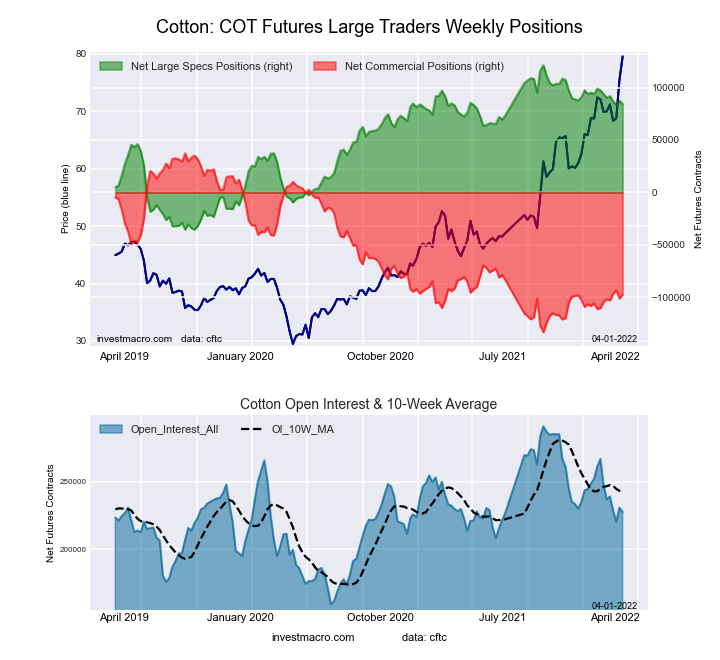
The soft commodity markets that saw lower speculator bets this week were Corn (-37,264 contracts), Coffee (-3,162 contracts), Soybeans (-12,167 contracts), Soybean Oil (-5,284 contracts), Soybean Meal (-6,999 contracts) and Cotton (-3,194 contracts).
Free Reports:
| Mar-29-2022 | OI | OI-Index | Spec-Net | Spec-Index | Com-Net | COM-Index | Smalls-Net | Smalls-Index |
|---|---|---|---|---|---|---|---|---|
| WTI Crude | 1,795,929 | 1 | 318,731 | 0 | -360,162 | 99 | 41,431 | 73 |
| Gold | 574,521 | 39 | 257,596 | 70 | -285,937 | 30 | 28,341 | 45 |
| Silver | 147,370 | 14 | 48,240 | 70 | -61,372 | 39 | 13,132 | 19 |
| Copper | 203,692 | 29 | 30,581 | 64 | -37,333 | 34 | 6,752 | 64 |
| Palladium | 6,720 | 1 | -2,011 | 10 | 1,364 | 84 | 647 | 81 |
| Platinum | 61,807 | 25 | 14,001 | 22 | -20,754 | 79 | 6,753 | 56 |
| Natural Gas | 1,100,690 | 4 | -137,411 | 37 | 92,762 | 60 | 44,649 | 92 |
| Brent | 188,542 | 30 | -25,220 | 69 | 21,609 | 29 | 3,611 | 58 |
| Heating Oil | 349,618 | 31 | 6,455 | 52 | -32,434 | 37 | 25,979 | 88 |
| Soybeans | 755,139 | 34 | 206,469 | 81 | -178,764 | 24 | -27,705 | 24 |
| Corn | 1,515,106 | 24 | 482,092 | 92 | -424,699 | 11 | -57,393 | 10 |
| Coffee | 227,547 | 6 | 38,689 | 77 | -42,092 | 27 | 3,403 | 12 |
| Sugar | 819,459 | 1 | 161,581 | 70 | -202,758 | 30 | 41,177 | 59 |
| Wheat | 341,224 | 3 | 13,559 | 59 | -9,435 | 32 | -4,124 | 91 |
This week’s current strength score (the trader positioning range over the past three years, measured from 0 to 100) shows the speculators are currently Bullish-Extreme with a score of 91.6 percent. The commercials are Bearish-Extreme with a score of 11.4 percent and the small traders (not shown in chart) are Bearish-Extreme with a score of 10.0 percent.
| CORN Futures Statistics | SPECULATORS | COMMERCIALS | SMALL TRADERS |
| – Percent of Open Interest Longs: | 36.5 | 45.6 | 8.8 |
| – Percent of Open Interest Shorts: | 4.6 | 73.7 | 12.6 |
| – Net Position: | 482,092 | -424,699 | -57,393 |
| – Gross Longs: | 552,536 | 691,549 | 133,661 |
| – Gross Shorts: | 70,444 | 1,116,248 | 191,054 |
| – Long to Short Ratio: | 7.8 to 1 | 0.6 to 1 | 0.7 to 1 |
| NET POSITION TREND: | |||
| – Strength Index Score (3 Year Range Pct): | 91.6 | 11.4 | 10.0 |
| – Strength Index Reading (3 Year Range): | Bullish-Extreme | Bearish-Extreme | Bearish-Extreme |
| NET POSITION MOVEMENT INDEX: | |||
| – 6-Week Change in Strength Index: | 8.6 | -7.1 | -10.3 |
This week’s current strength score (the trader positioning range over the past three years, measured from 0 to 100) shows the speculators are currently Bullish with a score of 69.8 percent. The commercials are Bearish with a score of 29.7 percent and the small traders (not shown in chart) are Bullish with a score of 58.8 percent.
| SUGAR Futures Statistics | SPECULATORS | COMMERCIALS | SMALL TRADERS |
| – Percent of Open Interest Longs: | 27.1 | 49.9 | 11.1 |
| – Percent of Open Interest Shorts: | 7.4 | 74.6 | 6.0 |
| – Net Position: | 161,581 | -202,758 | 41,177 |
| – Gross Longs: | 222,154 | 408,820 | 90,668 |
| – Gross Shorts: | 60,573 | 611,578 | 49,491 |
| – Long to Short Ratio: | 3.7 to 1 | 0.7 to 1 | 1.8 to 1 |
| NET POSITION TREND: | |||
| – Strength Index Score (3 Year Range Pct): | 69.8 | 29.7 | 58.8 |
| – Strength Index Reading (3 Year Range): | Bullish | Bearish | Bullish |
| NET POSITION MOVEMENT INDEX: | |||
| – 6-Week Change in Strength Index: | 17.9 | -21.3 | 31.3 |
This week’s current strength score (the trader positioning range over the past three years, measured from 0 to 100) shows the speculators are currently Bullish with a score of 76.7 percent. The commercials are Bearish with a score of 26.9 percent and the small traders (not shown in chart) are Bearish-Extreme with a score of 11.9 percent.
| COFFEE Futures Statistics | SPECULATORS | COMMERCIALS | SMALL TRADERS |
| – Percent of Open Interest Longs: | 22.4 | 53.3 | 4.3 |
| – Percent of Open Interest Shorts: | 5.4 | 71.8 | 2.8 |
| – Net Position: | 38,689 | -42,092 | 3,403 |
| – Gross Longs: | 50,991 | 121,208 | 9,798 |
| – Gross Shorts: | 12,302 | 163,300 | 6,395 |
| – Long to Short Ratio: | 4.1 to 1 | 0.7 to 1 | 1.5 to 1 |
| NET POSITION TREND: | |||
| – Strength Index Score (3 Year Range Pct): | 76.7 | 26.9 | 11.9 |
| – Strength Index Reading (3 Year Range): | Bullish | Bearish | Bearish-Extreme |
| NET POSITION MOVEMENT INDEX: | |||
| – 6-Week Change in Strength Index: | -23.0 | 26.1 | -9.7 |
This week’s current strength score (the trader positioning range over the past three years, measured from 0 to 100) shows the speculators are currently Bullish-Extreme with a score of 81.4 percent. The commercials are Bearish with a score of 23.8 percent and the small traders (not shown in chart) are Bearish with a score of 24.2 percent.
| SOYBEANS Futures Statistics | SPECULATORS | COMMERCIALS | SMALL TRADERS |
| – Percent of Open Interest Longs: | 33.6 | 46.4 | 6.9 |
| – Percent of Open Interest Shorts: | 6.3 | 70.1 | 10.6 |
| – Net Position: | 206,469 | -178,764 | -27,705 |
| – Gross Longs: | 253,726 | 350,240 | 52,406 |
| – Gross Shorts: | 47,257 | 529,004 | 80,111 |
| – Long to Short Ratio: | 5.4 to 1 | 0.7 to 1 | 0.7 to 1 |
| NET POSITION TREND: | |||
| – Strength Index Score (3 Year Range Pct): | 81.4 | 23.8 | 24.2 |
| – Strength Index Reading (3 Year Range): | Bullish-Extreme | Bearish | Bearish |
| NET POSITION MOVEMENT INDEX: | |||
| – 6-Week Change in Strength Index: | -2.5 | 1.8 | 4.4 |
This week’s current strength score (the trader positioning range over the past three years, measured from 0 to 100) shows the speculators are currently Bullish with a score of 70.9 percent. The commercials are Bearish with a score of 28.4 percent and the small traders (not shown in chart) are Bullish with a score of 71.5 percent.
| SOYBEAN OIL Futures Statistics | SPECULATORS | COMMERCIALS | SMALL TRADERS |
| – Percent of Open Interest Longs: | 30.6 | 49.1 | 9.8 |
| – Percent of Open Interest Shorts: | 5.0 | 79.3 | 5.2 |
| – Net Position: | 87,284 | -102,850 | 15,566 |
| – Gross Longs: | 104,186 | 167,198 | 33,429 |
| – Gross Shorts: | 16,902 | 270,048 | 17,863 |
| – Long to Short Ratio: | 6.2 to 1 | 0.6 to 1 | 1.9 to 1 |
| NET POSITION TREND: | |||
| – Strength Index Score (3 Year Range Pct): | 70.9 | 28.4 | 71.5 |
| – Strength Index Reading (3 Year Range): | Bullish | Bearish | Bullish |
| NET POSITION MOVEMENT INDEX: | |||
| – 6-Week Change in Strength Index: | 10.8 | -11.1 | 8.3 |
This week’s current strength score (the trader positioning range over the past three years, measured from 0 to 100) shows the speculators are currently Bullish-Extreme with a score of 95.3 percent. The commercials are Bearish-Extreme with a score of 4.6 percent and the small traders (not shown in chart) are Bullish-Extreme with a score of 85.9 percent.
| SOYBEAN MEAL Futures Statistics | SPECULATORS | COMMERCIALS | SMALL TRADERS |
| – Percent of Open Interest Longs: | 34.3 | 41.8 | 12.1 |
| – Percent of Open Interest Shorts: | 3.6 | 79.8 | 4.8 |
| – Net Position: | 121,785 | -150,719 | 28,934 |
| – Gross Longs: | 135,876 | 165,743 | 47,934 |
| – Gross Shorts: | 14,091 | 316,462 | 19,000 |
| – Long to Short Ratio: | 9.6 to 1 | 0.5 to 1 | 2.5 to 1 |
| NET POSITION TREND: | |||
| – Strength Index Score (3 Year Range Pct): | 95.3 | 4.6 | 85.9 |
| – Strength Index Reading (3 Year Range): | Bullish-Extreme | Bearish-Extreme | Bullish-Extreme |
| NET POSITION MOVEMENT INDEX: | |||
| – 6-Week Change in Strength Index: | 6.8 | -7.8 | 11.4 |
This week’s current strength score (the trader positioning range over the past three years, measured from 0 to 100) shows the speculators are currently Bearish with a score of 24.4 percent. The commercials are Bullish with a score of 73.1 percent and the small traders (not shown in chart) are Bullish with a score of 61.8 percent.
| LIVE CATTLE Futures Statistics | SPECULATORS | COMMERCIALS | SMALL TRADERS |
| – Percent of Open Interest Longs: | 35.4 | 41.7 | 10.5 |
| – Percent of Open Interest Shorts: | 18.3 | 55.4 | 13.8 |
| – Net Position: | 52,745 | -42,343 | -10,402 |
| – Gross Longs: | 109,521 | 129,222 | 32,487 |
| – Gross Shorts: | 56,776 | 171,565 | 42,889 |
| – Long to Short Ratio: | 1.9 to 1 | 0.8 to 1 | 0.8 to 1 |
| NET POSITION TREND: | |||
| – Strength Index Score (3 Year Range Pct): | 24.4 | 73.1 | 61.8 |
| – Strength Index Reading (3 Year Range): | Bearish | Bullish | Bullish |
| NET POSITION MOVEMENT INDEX: | |||
| – 6-Week Change in Strength Index: | -20.7 | 22.6 | 8.5 |
This week’s current strength score (the trader positioning range over the past three years, measured from 0 to 100) shows the speculators are currently Bullish with a score of 64.7 percent. The commercials are Bearish with a score of 40.3 percent and the small traders (not shown in chart) are Bullish with a score of 52.4 percent.
| LEAN HOGS Futures Statistics | SPECULATORS | COMMERCIALS | SMALL TRADERS |
| – Percent of Open Interest Longs: | 39.1 | 33.7 | 9.7 |
| – Percent of Open Interest Shorts: | 16.6 | 52.7 | 13.1 |
| – Net Position: | 53,194 | -45,016 | -8,178 |
| – Gross Longs: | 92,407 | 79,772 | 22,919 |
| – Gross Shorts: | 39,213 | 124,788 | 31,097 |
| – Long to Short Ratio: | 2.4 to 1 | 0.6 to 1 | 0.7 to 1 |
| NET POSITION TREND: | |||
| – Strength Index Score (3 Year Range Pct): | 64.7 | 40.3 | 52.4 |
| – Strength Index Reading (3 Year Range): | Bullish | Bearish | Bullish |
| NET POSITION MOVEMENT INDEX: | |||
| – 6-Week Change in Strength Index: | -15.4 | 13.2 | 15.0 |
This week’s current strength score (the trader positioning range over the past three years, measured from 0 to 100) shows the speculators are currently Bullish with a score of 76.3 percent. The commercials are Bearish with a score of 21.1 percent and the small traders (not shown in chart) are Bullish-Extreme with a score of 95.3 percent.
| COTTON Futures Statistics | SPECULATORS | COMMERCIALS | SMALL TRADERS |
| – Percent of Open Interest Longs: | 43.2 | 36.1 | 9.0 |
| – Percent of Open Interest Shorts: | 6.2 | 78.8 | 3.2 |
| – Net Position: | 84,160 | -97,258 | 13,098 |
| – Gross Longs: | 98,239 | 82,066 | 20,362 |
| – Gross Shorts: | 14,079 | 179,324 | 7,264 |
| – Long to Short Ratio: | 7.0 to 1 | 0.5 to 1 | 2.8 to 1 |
| NET POSITION TREND: | |||
| – Strength Index Score (3 Year Range Pct): | 76.3 | 21.1 | 95.3 |
| – Strength Index Reading (3 Year Range): | Bullish | Bearish | Bullish-Extreme |
| NET POSITION MOVEMENT INDEX: | |||
| – 6-Week Change in Strength Index: | -6.1 | 4.1 | 15.8 |
This week’s current strength score (the trader positioning range over the past three years, measured from 0 to 100) shows the speculators are currently Bullish with a score of 56.5 percent. The commercials are Bearish with a score of 38.8 percent and the small traders (not shown in chart) are Bullish-Extreme with a score of 84.9 percent.
| COCOA Futures Statistics | SPECULATORS | COMMERCIALS | SMALL TRADERS |
| – Percent of Open Interest Longs: | 30.7 | 47.4 | 7.3 |
| – Percent of Open Interest Shorts: | 14.3 | 67.5 | 3.7 |
| – Net Position: | 39,674 | -48,448 | 8,774 |
| – Gross Longs: | 74,233 | 114,490 | 17,726 |
| – Gross Shorts: | 34,559 | 162,938 | 8,952 |
| – Long to Short Ratio: | 2.1 to 1 | 0.7 to 1 | 2.0 to 1 |
| NET POSITION TREND: | |||
| – Strength Index Score (3 Year Range Pct): | 56.5 | 38.8 | 84.9 |
| – Strength Index Reading (3 Year Range): | Bullish | Bearish | Bullish-Extreme |
| NET POSITION MOVEMENT INDEX: | |||
| – 6-Week Change in Strength Index: | -9.3 | 5.2 | 40.5 |
This week’s current strength score (the trader positioning range over the past three years, measured from 0 to 100) shows the speculators are currently Bullish with a score of 58.6 percent. The commercials are Bearish with a score of 31.7 percent and the small traders (not shown in chart) are Bullish-Extreme with a score of 91.2 percent.
| WHEAT Futures Statistics | SPECULATORS | COMMERCIALS | SMALL TRADERS |
| – Percent of Open Interest Longs: | 33.1 | 40.5 | 9.1 |
| – Percent of Open Interest Shorts: | 29.1 | 43.3 | 10.3 |
| – Net Position: | 13,559 | -9,435 | -4,124 |
| – Gross Longs: | 112,940 | 138,288 | 31,061 |
| – Gross Shorts: | 99,381 | 147,723 | 35,185 |
| – Long to Short Ratio: | 1.1 to 1 | 0.9 to 1 | 0.9 to 1 |
| NET POSITION TREND: | |||
| – Strength Index Score (3 Year Range Pct): | 58.6 | 31.7 | 91.2 |
| – Strength Index Reading (3 Year Range): | Bullish | Bearish | Bullish-Extreme |
| NET POSITION MOVEMENT INDEX: | |||
| – 6-Week Change in Strength Index: | 16.5 | -18.9 | 0.2 |
Article By InvestMacro – Receive our weekly COT Reports by Email
*COT Report: The COT data, released weekly to the public each Friday, is updated through the most recent Tuesday (data is 3 days old) and shows a quick view of how large speculators or non-commercials (for-profit traders) were positioned in the futures markets.
The CFTC categorizes trader positions according to commercial hedgers (traders who use futures contracts for hedging as part of the business), non-commercials (large traders who speculate to realize trading profits) and nonreportable traders (usually small traders/speculators) as well as their open interest (contracts open in the market at time of reporting).See CFTC criteria here.
By Jeffrey Young, Georgia Institute of Technology You’ve probably heard artificial intelligence models described as…
Source: Barry Dawes (7/23/26) Barry Dawes of Martin Place Securities shares his analysis of the…
By JustMarkets The US stock indices ended Thursday’s session with a notable decline amid a…
By Analytical Department RoboForex USD/JPY soared to 163.81 on Friday, marking a new 40-year high.…
By JustMarkets The US equities ended Wednesday’s session lower amid investor caution ahead of the…
By Analytical Department RoboForex EUR/USD rose to 1.1429 on Thursday, with the US dollar continuing…
This website uses cookies.