By InvestMacro | COT | Data Tables | COT Leaders | Downloads | COT Newsletter
Here are the latest charts and statistics for the Commitment of Traders (COT) data published by the Commodities Futures Trading Commission (CFTC).
The latest COT data is updated through Tuesday March 29th and shows a quick view of how large traders (for-profit speculators and commercial entities) were positioned in the futures markets.
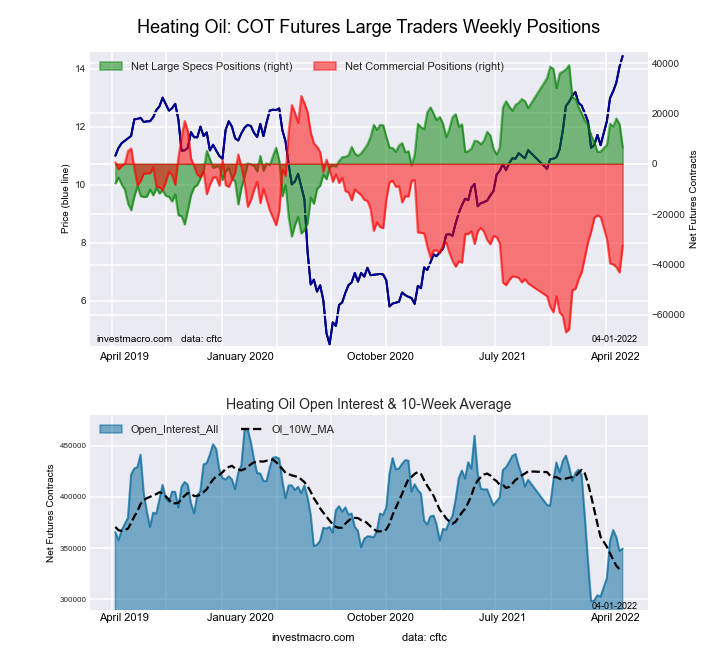
Highlighting the COT energy data is the recent decline in the Heating Oil futures bets. The speculative net position in the Heating Oil futures has dropped for two consecutive weeks and in three out of the past four weeks. The spec crude position has declined by a total of -9,420 contracts over the past four weeks and speculators have now pushed their current net positioning to the lowest level in six weeks. Heating Oil speculator positions are currently (+6,455 contracts) at the lower end of their range after averaging approximately +20,000 contracts each week over the whole of 2021. Heating Oil prices, meanwhile, have seen price surges (hitting multi-year highs) in the past few months due to the Russian invasion of Ukraine but did retrace lower this week with a decline by approximately -8.00 percent for the week at Friday’s close.
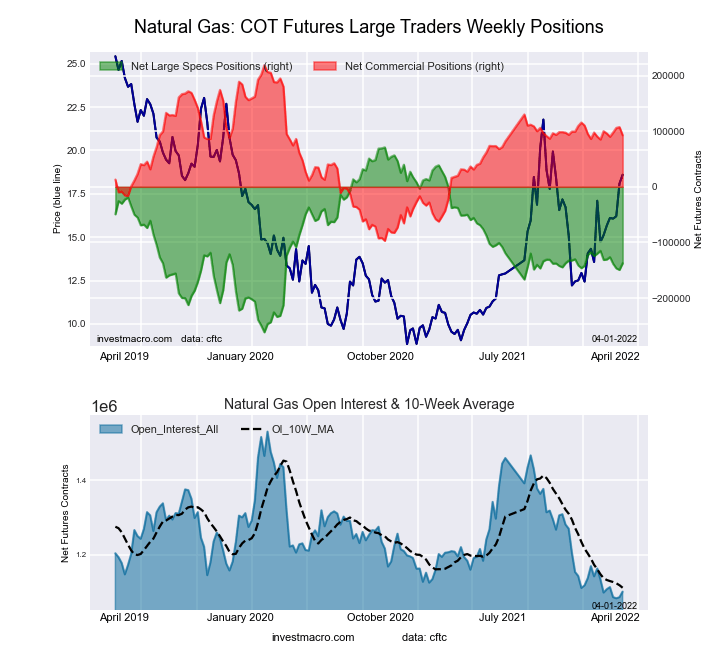
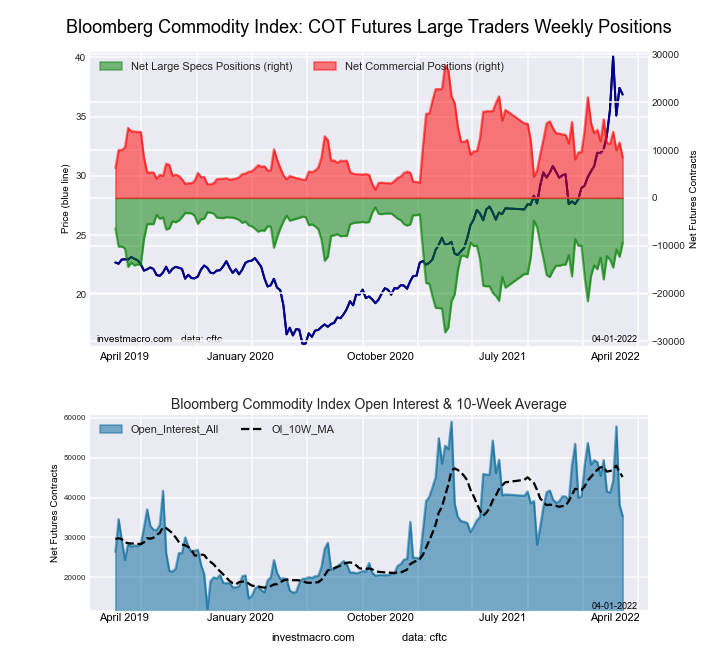
The energy markets that saw higher speculator bets this week were Natural Gas (11,926 contracts) and the Bloomberg Commodity Index (2,972 contracts).
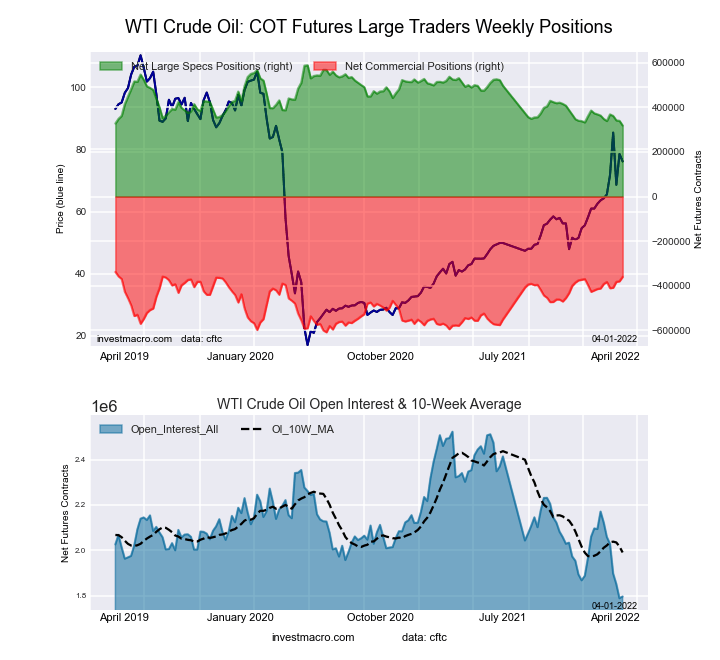
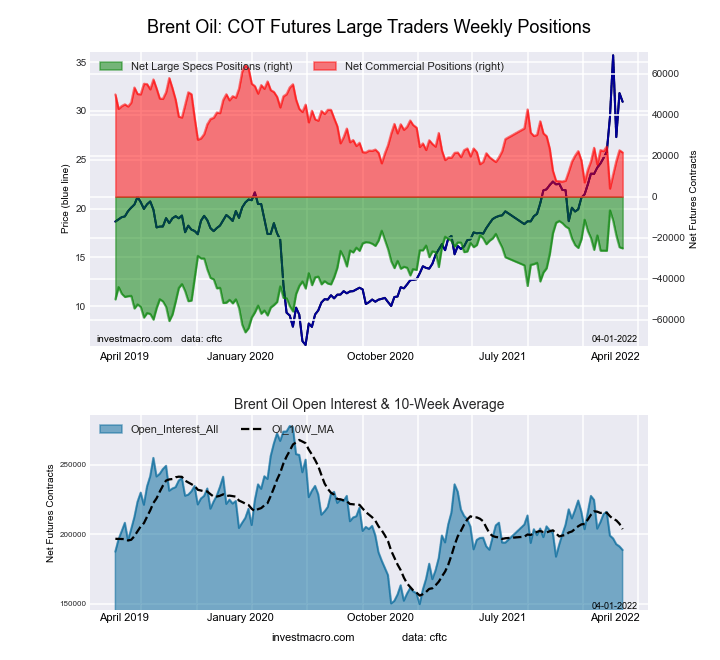
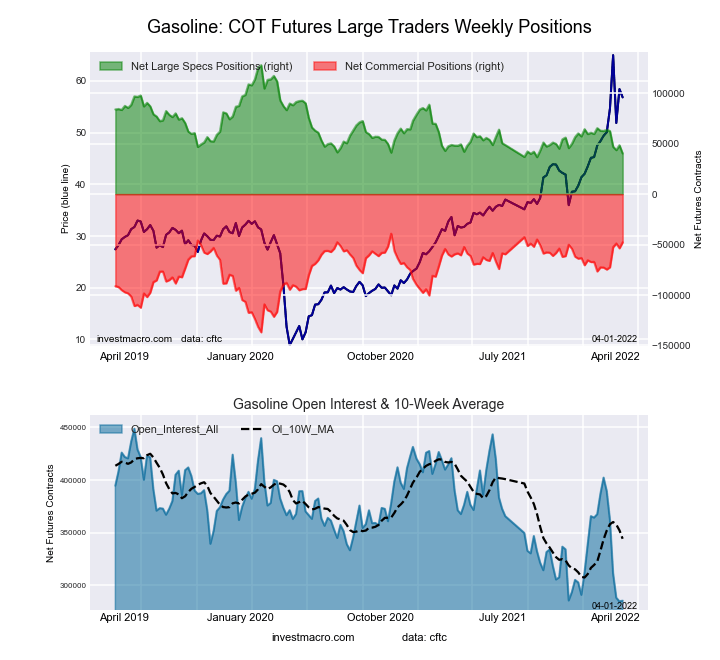
The energy markets that saw lower speculator bets this week were WTI Crude Oil (-21,238 contracts), Heating Oil (-9,228 contracts), Gasoline (-8,168 contracts) and Brent Crude Oil (-554 contracts).
Free Reports:
| Mar-29-2022 | OI | OI-Index | Spec-Net | Spec-Index | Com-Net | COM-Index | Smalls-Net | Smalls-Index |
|---|---|---|---|---|---|---|---|---|
| WTI Crude | 1,795,929 | 1 | 318,731 | 0 | -360,162 | 99 | 41,431 | 73 |
| Gold | 574,521 | 39 | 257,596 | 70 | -285,937 | 30 | 28,341 | 45 |
| Silver | 147,370 | 14 | 48,240 | 70 | -61,372 | 39 | 13,132 | 19 |
| Copper | 203,692 | 29 | 30,581 | 64 | -37,333 | 34 | 6,752 | 64 |
| Palladium | 6,720 | 1 | -2,011 | 10 | 1,364 | 84 | 647 | 81 |
| Platinum | 61,807 | 25 | 14,001 | 22 | -20,754 | 79 | 6,753 | 56 |
| Natural Gas | 1,100,690 | 4 | -137,411 | 37 | 92,762 | 60 | 44,649 | 92 |
| Brent | 188,542 | 30 | -25,220 | 69 | 21,609 | 29 | 3,611 | 58 |
| Heating Oil | 349,618 | 31 | 6,455 | 52 | -32,434 | 37 | 25,979 | 88 |
| Soybeans | 755,139 | 34 | 206,469 | 81 | -178,764 | 24 | -27,705 | 24 |
| Corn | 1,515,106 | 24 | 482,092 | 92 | -424,699 | 11 | -57,393 | 10 |
| Coffee | 227,547 | 6 | 38,689 | 77 | -42,092 | 27 | 3,403 | 12 |
| Sugar | 819,459 | 1 | 161,581 | 70 | -202,758 | 30 | 41,177 | 59 |
| Wheat | 341,224 | 3 | 13,559 | 59 | -9,435 | 32 | -4,124 | 91 |
This week’s current strength score (the trader positioning range over the past three years, measured from 0 to 100) shows the speculators are currently Bearish-Extreme with a score of 0.0 percent. The commercials are Bullish-Extreme with a score of 99.4 percent and the small traders (not shown in chart) are Bullish with a score of 73.4 percent.
| WTI Crude Oil Futures Statistics | SPECULATORS | COMMERCIALS | SMALL TRADERS |
| – Percent of Open Interest Longs: | 23.4 | 36.5 | 4.8 |
| – Percent of Open Interest Shorts: | 5.6 | 56.5 | 2.5 |
| – Net Position: | 318,731 | -360,162 | 41,431 |
| – Gross Longs: | 420,097 | 654,965 | 85,767 |
| – Gross Shorts: | 101,366 | 1,015,127 | 44,336 |
| – Long to Short Ratio: | 4.1 to 1 | 0.6 to 1 | 1.9 to 1 |
| NET POSITION TREND: | |||
| – Strength Index Score (3 Year Range Pct): | 0.0 | 99.4 | 73.4 |
| – Strength Index Reading (3 Year Range): | Bearish-Extreme | Bullish-Extreme | Bullish |
| NET POSITION MOVEMENT INDEX: | |||
| – 6-Week Change in Strength Index: | -10.8 | 12.7 | -3.5 |
This week’s current strength score (the trader positioning range over the past three years, measured from 0 to 100) shows the speculators are currently Bullish with a score of 68.9 percent. The commercials are Bearish with a score of 29.2 percent and the small traders (not shown in chart) are Bullish with a score of 58.1 percent.
| Brent Crude Oil Futures Statistics | SPECULATORS | COMMERCIALS | SMALL TRADERS |
| – Percent of Open Interest Longs: | 20.2 | 44.2 | 4.4 |
| – Percent of Open Interest Shorts: | 33.6 | 32.7 | 2.5 |
| – Net Position: | -25,220 | 21,609 | 3,611 |
| – Gross Longs: | 38,169 | 83,276 | 8,330 |
| – Gross Shorts: | 63,389 | 61,667 | 4,719 |
| – Long to Short Ratio: | 0.6 to 1 | 1.4 to 1 | 1.8 to 1 |
| NET POSITION TREND: | |||
| – Strength Index Score (3 Year Range Pct): | 68.9 | 29.2 | 58.1 |
| – Strength Index Reading (3 Year Range): | Bullish | Bearish | Bullish |
| NET POSITION MOVEMENT INDEX: | |||
| – 6-Week Change in Strength Index: | 1.9 | -1.1 | -5.9 |
This week’s current strength score (the trader positioning range over the past three years, measured from 0 to 100) shows the speculators are currently Bearish with a score of 37.3 percent. The commercials are Bullish with a score of 60.1 percent and the small traders (not shown in chart) are Bullish-Extreme with a score of 92.0 percent.
| Natural Gas Futures Statistics | SPECULATORS | COMMERCIALS | SMALL TRADERS |
| – Percent of Open Interest Longs: | 22.6 | 42.7 | 6.2 |
| – Percent of Open Interest Shorts: | 35.1 | 34.3 | 2.2 |
| – Net Position: | -137,411 | 92,762 | 44,649 |
| – Gross Longs: | 249,135 | 470,232 | 68,418 |
| – Gross Shorts: | 386,546 | 377,470 | 23,769 |
| – Long to Short Ratio: | 0.6 to 1 | 1.2 to 1 | 2.9 to 1 |
| NET POSITION TREND: | |||
| – Strength Index Score (3 Year Range Pct): | 37.3 | 60.1 | 92.0 |
| – Strength Index Reading (3 Year Range): | Bearish | Bullish | Bullish-Extreme |
| NET POSITION MOVEMENT INDEX: | |||
| – 6-Week Change in Strength Index: | -1.8 | -2.3 | 33.2 |
This week’s current strength score (the trader positioning range over the past three years, measured from 0 to 100) shows the speculators are currently Bearish-Extreme with a score of 11.0 percent. The commercials are Bullish-Extreme with a score of 89.2 percent and the small traders (not shown in chart) are Bullish with a score of 56.8 percent.
| Nasdaq Mini Futures Statistics | SPECULATORS | COMMERCIALS | SMALL TRADERS |
| – Percent of Open Interest Longs: | 26.1 | 53.0 | 7.6 |
| – Percent of Open Interest Shorts: | 12.0 | 69.7 | 4.9 |
| – Net Position: | 40,202 | -47,775 | 7,573 |
| – Gross Longs: | 74,554 | 151,056 | 21,630 |
| – Gross Shorts: | 34,352 | 198,831 | 14,057 |
| – Long to Short Ratio: | 2.2 to 1 | 0.8 to 1 | 1.5 to 1 |
| NET POSITION TREND: | |||
| – Strength Index Score (3 Year Range Pct): | 11.0 | 89.2 | 56.8 |
| – Strength Index Reading (3 Year Range): | Bearish-Extreme | Bullish-Extreme | Bullish |
| NET POSITION MOVEMENT INDEX: | |||
| – 6-Week Change in Strength Index: | -22.8 | 25.0 | -15.4 |
This week’s current strength score (the trader positioning range over the past three years, measured from 0 to 100) shows the speculators are currently Bullish with a score of 51.9 percent. The commercials are Bearish with a score of 36.7 percent and the small traders (not shown in chart) are Bullish-Extreme with a score of 88.4 percent.
| Heating Oil Futures Statistics | SPECULATORS | COMMERCIALS | SMALL TRADERS |
| – Percent of Open Interest Longs: | 17.0 | 50.8 | 14.4 |
| – Percent of Open Interest Shorts: | 15.1 | 60.1 | 6.9 |
| – Net Position: | 6,455 | -32,434 | 25,979 |
| – Gross Longs: | 59,340 | 177,626 | 50,210 |
| – Gross Shorts: | 52,885 | 210,060 | 24,231 |
| – Long to Short Ratio: | 1.1 to 1 | 0.8 to 1 | 2.1 to 1 |
| NET POSITION TREND: | |||
| – Strength Index Score (3 Year Range Pct): | 51.9 | 36.7 | 88.4 |
| – Strength Index Reading (3 Year Range): | Bullish | Bearish | Bullish-Extreme |
| NET POSITION MOVEMENT INDEX: | |||
| – 6-Week Change in Strength Index: | 4.2 | -10.3 | 23.6 |
This week’s current strength score (the trader positioning range over the past three years, measured from 0 to 100) shows the speculators are currently Bullish with a score of 71.7 percent. The commercials are Bearish with a score of 25.7 percent and the small traders (not shown in chart) are Bullish with a score of 52.6 percent.
| Bloomberg Index Futures Statistics | SPECULATORS | COMMERCIALS | SMALL TRADERS |
| – Percent of Open Interest Longs: | 70.8 | 23.8 | 2.9 |
| – Percent of Open Interest Shorts: | 97.2 | 0.0 | 0.3 |
| – Net Position: | -9,348 | 8,415 | 933 |
| – Gross Longs: | 25,002 | 8,415 | 1,022 |
| – Gross Shorts: | 34,350 | 0 | 89 |
| – Long to Short Ratio: | 0.7 to 1 | inf to 1 | 11.5 to 1 |
| NET POSITION TREND: | |||
| – Strength Index Score (3 Year Range Pct): | 71.7 | 25.7 | 52.6 |
| – Strength Index Reading (3 Year Range): | Bullish | Bearish | Bullish |
| NET POSITION MOVEMENT INDEX: | |||
| – 6-Week Change in Strength Index: | 29.4 | -30.9 | 11.7 |
Article By InvestMacro – Receive our weekly COT Reports by Email
*COT Report: The COT data, released weekly to the public each Friday, is updated through the most recent Tuesday (data is 3 days old) and shows a quick view of how large speculators or non-commercials (for-profit traders) were positioned in the futures markets.
The CFTC categorizes trader positions according to commercial hedgers (traders who use futures contracts for hedging as part of the business), non-commercials (large traders who speculate to realize trading profits) and nonreportable traders (usually small traders/speculators) as well as their open interest (contracts open in the market at time of reporting).See CFTC criteria here.
By Jeffrey Young, Georgia Institute of Technology You’ve probably heard artificial intelligence models described as…
Source: Barry Dawes (7/23/26) Barry Dawes of Martin Place Securities shares his analysis of the…
By JustMarkets The US stock indices ended Thursday’s session with a notable decline amid a…
By Analytical Department RoboForex USD/JPY soared to 163.81 on Friday, marking a new 40-year high.…
By JustMarkets The US equities ended Wednesday’s session lower amid investor caution ahead of the…
By Analytical Department RoboForex EUR/USD rose to 1.1429 on Thursday, with the US dollar continuing…
This website uses cookies.