By InvestMacro | COT | Data Tables | COT Leaders | Downloads | COT Newsletter
Here are the latest charts and statistics for the Commitment of Traders (COT) data published by the Commodities Futures Trading Commission (CFTC).
The latest COT data is updated through Tuesday February 1st and shows a quick view of how large traders (for-profit speculators and commercial entities) were positioned in the futures markets.
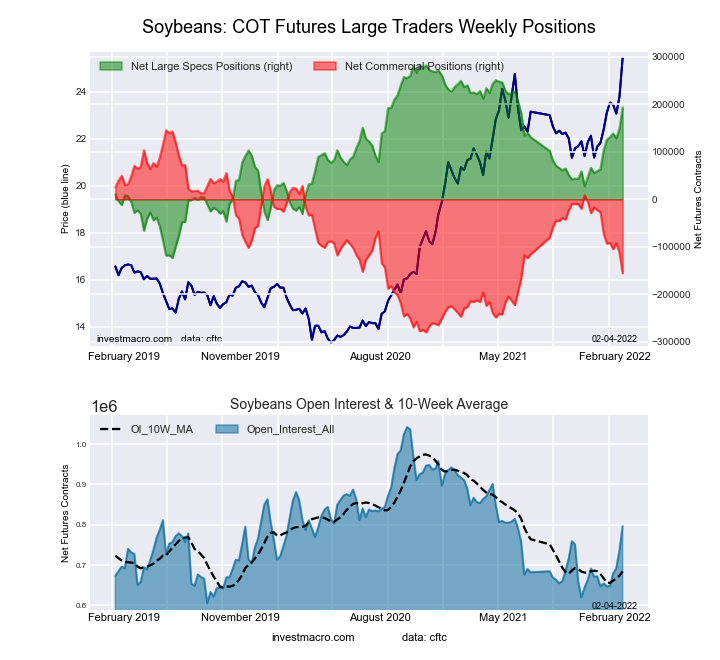
Highlighting the COT soft commodities data is the gains in Soybeans futures bets. The speculative net position in the Soybeans futures jumped this week by +44,501 contracts, the largest one-week gain in the past seventy-four weeks, dating back to September of 2020. Speculators have been boosting their Soybeans positions higher as bullish bets have risen for two straight weeks and in ten out of the past twelve weeks. The speculator standing has ascended to the highest total of the past thirty-three weeks and on the cusp of an extreme bullish reading (78.1%) for speculators (current spec level compared to past three years of data where above 80% is extreme bullish and below 20% is extreme bearish).
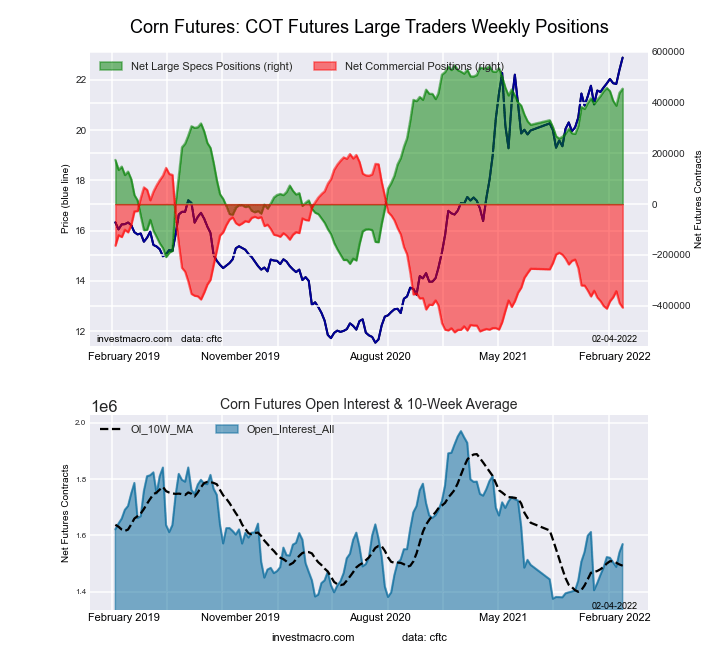
The soft commodities that saw higher bets this week were Corn (16,122 contracts), Soybeans (44,501 contracts), Soybean Oil (5,938 contracts), Soybean Meal (19,821 contracts), Live Cattle (16,867 contracts), Lean Hogs (1,475 contracts) and Cotton (5,213 contracts).
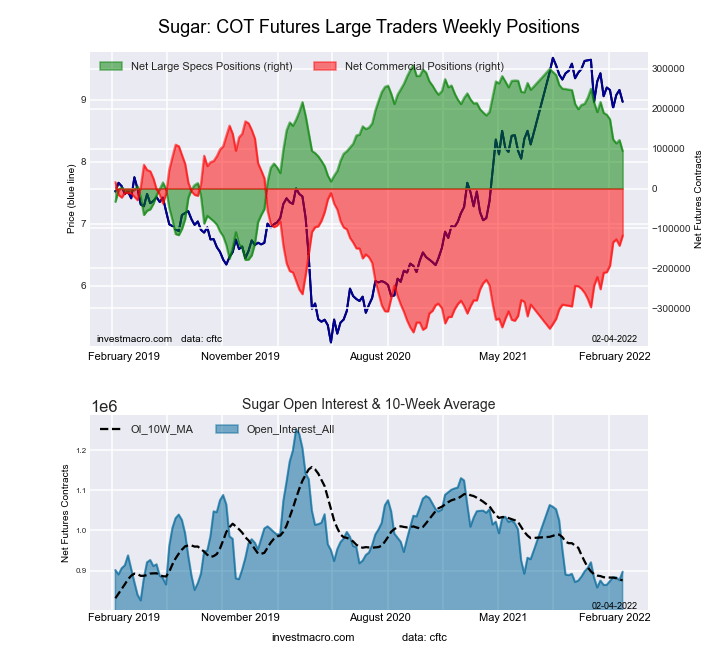
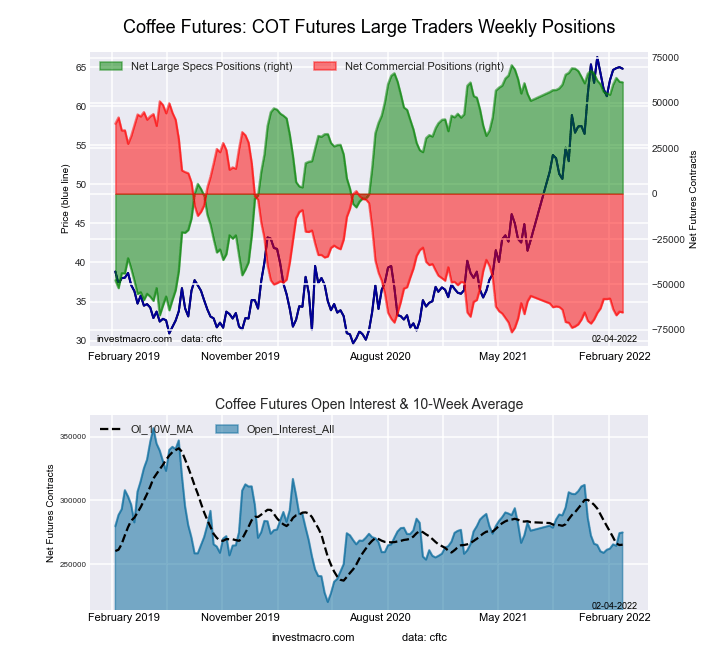
The markets with lower speculator bets were Sugar (-27,690 contracts), Coffee (-265 contracts), Cocoa (-858 contracts), and Wheat (-11,311 contracts).
Free Reports:
| Feb-01-2022 | OI | OI-Index | Spec-Net | Spec-Index | Com-Net | COM-Index | Smalls-Net | Smalls-Index |
|---|---|---|---|---|---|---|---|---|
| WTI Crude | 2,093,735 | 35 | 368,904 | 27 | -414,658 | 63 | 45,754 | 79 |
| Gold | 515,331 | 23 | 172,142 | 43 | -201,342 | 56 | 29,200 | 47 |
| Silver | 149,136 | 15 | 22,118 | 44 | -35,263 | 64 | 13,145 | 19 |
| Copper | 198,437 | 25 | 16,155 | 54 | -21,053 | 45 | 4,898 | 54 |
| Palladium | 7,853 | 6 | -992 | 15 | 965 | 83 | 27 | 46 |
| Platinum | 53,898 | 11 | 14,581 | 23 | -19,786 | 81 | 5,205 | 35 |
| Natural Gas | 1,162,813 | 12 | -120,010 | 43 | 90,241 | 59 | 29,769 | 54 |
| Brent | 203,928 | 42 | -18,920 | 86 | 15,734 | 15 | 3,186 | 52 |
| Heating Oil | 347,383 | 30 | 15,683 | 65 | -43,137 | 25 | 27,454 | 93 |
| Soybeans | 796,285 | 44 | 193,373 | 78 | -155,577 | 29 | -37,796 | 9 |
| Corn | 1,568,959 | 33 | 455,220 | 88 | -407,663 | 14 | -47,557 | 16 |
| Coffee | 274,865 | 40 | 61,378 | 93 | -65,365 | 9 | 3,987 | 16 |
| Sugar | 897,035 | 17 | 93,593 | 56 | -117,500 | 46 | 23,907 | 37 |
| Wheat | 391,162 | 29 | 350 | 47 | 5,100 | 46 | -5,450 | 76 |
This week’s current strength score (the trader positioning range over the past three years, measured from 0 to 100) shows the speculators are currently Bullish-Extreme with a score of 88.2 percent. The commercials are Bearish-Extreme with a score of 13.9 percent and the small traders (not shown in chart) are Bearish-Extreme with a score of 15.7 percent.
| CORN Futures Statistics | SPECULATORS | COMMERCIALS | SMALL TRADERS |
| – Percent of Open Interest Longs: | 34.9 | 43.3 | 9.0 |
| – Percent of Open Interest Shorts: | 5.9 | 69.3 | 12.0 |
| – Net Position: | 455,220 | -407,663 | -47,557 |
| – Gross Longs: | 547,596 | 679,215 | 140,463 |
| – Gross Shorts: | 92,376 | 1,086,878 | 188,020 |
| – Long to Short Ratio: | 5.9 to 1 | 0.6 to 1 | 0.7 to 1 |
| NET POSITION TREND: | |||
| – Strength Index Score (3 Year Range Pct): | 88.2 | 13.9 | 15.7 |
| – Strength Index Reading (3 Year Range): | Bullish-Extreme | Bearish-Extreme | Bearish-Extreme |
| NET POSITION MOVEMENT INDEX: | |||
| – 6-Week Change in Strength Index: | 1.3 | -0.9 | -2.0 |
This week’s current strength score (the trader positioning range over the past three years, measured from 0 to 100) shows the speculators are currently Bullish with a score of 55.9 percent. The commercials are Bearish with a score of 45.9 percent and the small traders (not shown in chart) are Bearish with a score of 37.4 percent.
| SUGAR Futures Statistics | SPECULATORS | COMMERCIALS | SMALL TRADERS |
| – Percent of Open Interest Longs: | 20.2 | 55.9 | 8.9 |
| – Percent of Open Interest Shorts: | 9.8 | 69.0 | 6.2 |
| – Net Position: | 93,593 | -117,500 | 23,907 |
| – Gross Longs: | 181,186 | 501,416 | 79,413 |
| – Gross Shorts: | 87,593 | 618,916 | 55,506 |
| – Long to Short Ratio: | 2.1 to 1 | 0.8 to 1 | 1.4 to 1 |
| NET POSITION TREND: | |||
| – Strength Index Score (3 Year Range Pct): | 55.9 | 45.9 | 37.4 |
| – Strength Index Reading (3 Year Range): | Bullish | Bearish | Bearish |
| NET POSITION MOVEMENT INDEX: | |||
| – 6-Week Change in Strength Index: | -19.6 | 17.7 | 2.9 |
This week’s current strength score (the trader positioning range over the past three years, measured from 0 to 100) shows the speculators are currently Bullish-Extreme with a score of 93.2 percent. The commercials are Bearish-Extreme with a score of 8.6 percent and the small traders (not shown in chart) are Bearish-Extreme with a score of 15.9 percent.
| COFFEE Futures Statistics | SPECULATORS | COMMERCIALS | SMALL TRADERS |
| – Percent of Open Interest Longs: | 27.3 | 42.7 | 4.1 |
| – Percent of Open Interest Shorts: | 5.0 | 66.5 | 2.6 |
| – Net Position: | 61,378 | -65,365 | 3,987 |
| – Gross Longs: | 75,016 | 117,397 | 11,261 |
| – Gross Shorts: | 13,638 | 182,762 | 7,274 |
| – Long to Short Ratio: | 5.5 to 1 | 0.6 to 1 | 1.5 to 1 |
| NET POSITION TREND: | |||
| – Strength Index Score (3 Year Range Pct): | 93.2 | 8.6 | 15.9 |
| – Strength Index Reading (3 Year Range): | Bullish-Extreme | Bearish-Extreme | Bearish-Extreme |
| NET POSITION MOVEMENT INDEX: | |||
| – 6-Week Change in Strength Index: | 3.8 | -5.8 | 14.8 |
This week’s current strength score (the trader positioning range over the past three years, measured from 0 to 100) shows the speculators are currently Bullish with a score of 78.1 percent. The commercials are Bearish with a score of 29.2 percent and the small traders (not shown in chart) are Bearish-Extreme with a score of 9.0 percent.
| SOYBEANS Futures Statistics | SPECULATORS | COMMERCIALS | SMALL TRADERS |
| – Percent of Open Interest Longs: | 29.6 | 47.0 | 6.4 |
| – Percent of Open Interest Shorts: | 5.3 | 66.5 | 11.1 |
| – Net Position: | 193,373 | -155,577 | -37,796 |
| – Gross Longs: | 235,972 | 374,270 | 50,921 |
| – Gross Shorts: | 42,599 | 529,847 | 88,717 |
| – Long to Short Ratio: | 5.5 to 1 | 0.7 to 1 | 0.6 to 1 |
| NET POSITION TREND: | |||
| – Strength Index Score (3 Year Range Pct): | 78.1 | 29.2 | 9.0 |
| – Strength Index Reading (3 Year Range): | Bullish | Bearish | Bearish-Extreme |
| NET POSITION MOVEMENT INDEX: | |||
| – 6-Week Change in Strength Index: | 22.3 | -19.6 | -12.1 |
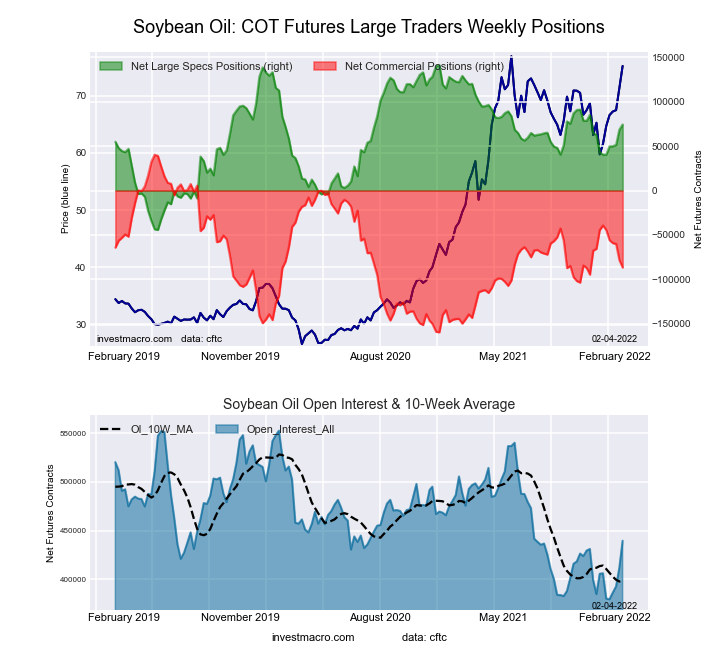
This week’s current strength score (the trader positioning range over the past three years, measured from 0 to 100) shows the speculators are currently Bullish with a score of 64.0 percent. The commercials are Bearish with a score of 36.5 percent and the small traders (not shown in chart) are Bullish with a score of 58.9 percent.
| SOYBEAN OIL Futures Statistics | SPECULATORS | COMMERCIALS | SMALL TRADERS |
| – Percent of Open Interest Longs: | 25.6 | 45.6 | 8.5 |
| – Percent of Open Interest Shorts: | 8.7 | 65.3 | 5.8 |
| – Net Position: | 74,410 | -86,588 | 12,178 |
| – Gross Longs: | 112,593 | 200,533 | 37,458 |
| – Gross Shorts: | 38,183 | 287,121 | 25,280 |
| – Long to Short Ratio: | 2.9 to 1 | 0.7 to 1 | 1.5 to 1 |
| NET POSITION TREND: | |||
| – Strength Index Score (3 Year Range Pct): | 64.0 | 36.5 | 58.9 |
| – Strength Index Reading (3 Year Range): | Bullish | Bearish | Bullish |
| NET POSITION MOVEMENT INDEX: | |||
| – 6-Week Change in Strength Index: | 18.3 | -23.7 | 49.6 |
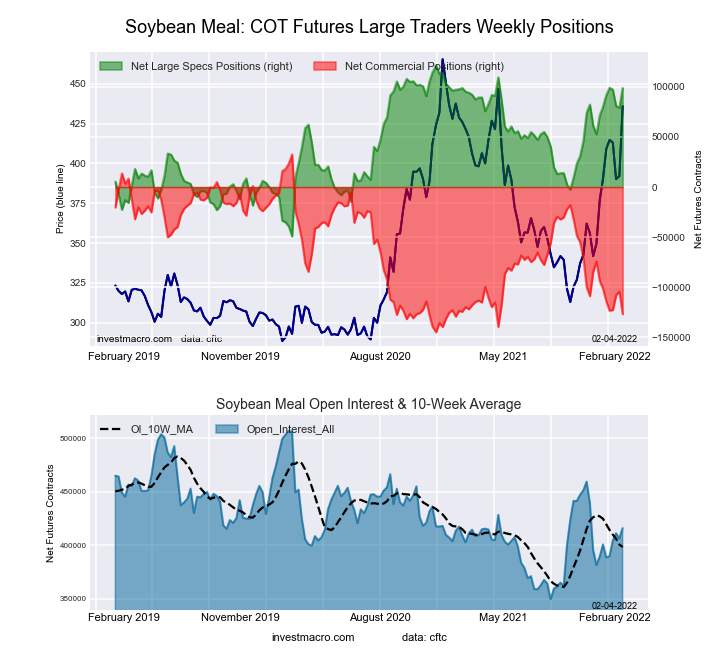
This week’s current strength score (the trader positioning range over the past three years, measured from 0 to 100) shows the speculators are currently Bullish-Extreme with a score of 86.7 percent. The commercials are Bearish-Extreme with a score of 10.2 percent and the small traders (not shown in chart) are Bullish-Extreme with a score of 83.3 percent.
| SOYBEAN MEAL Futures Statistics | SPECULATORS | COMMERCIALS | SMALL TRADERS |
| – Percent of Open Interest Longs: | 28.1 | 44.3 | 11.9 |
| – Percent of Open Interest Shorts: | 4.3 | 74.8 | 5.1 |
| – Net Position: | 98,839 | -126,965 | 28,126 |
| – Gross Longs: | 116,823 | 184,206 | 49,421 |
| – Gross Shorts: | 17,984 | 311,171 | 21,295 |
| – Long to Short Ratio: | 6.5 to 1 | 0.6 to 1 | 2.3 to 1 |
| NET POSITION TREND: | |||
| – Strength Index Score (3 Year Range Pct): | 86.7 | 10.2 | 83.3 |
| – Strength Index Reading (3 Year Range): | Bullish-Extreme | Bearish-Extreme | Bullish-Extreme |
| NET POSITION MOVEMENT INDEX: | |||
| – 6-Week Change in Strength Index: | 10.9 | -14.4 | 27.2 |
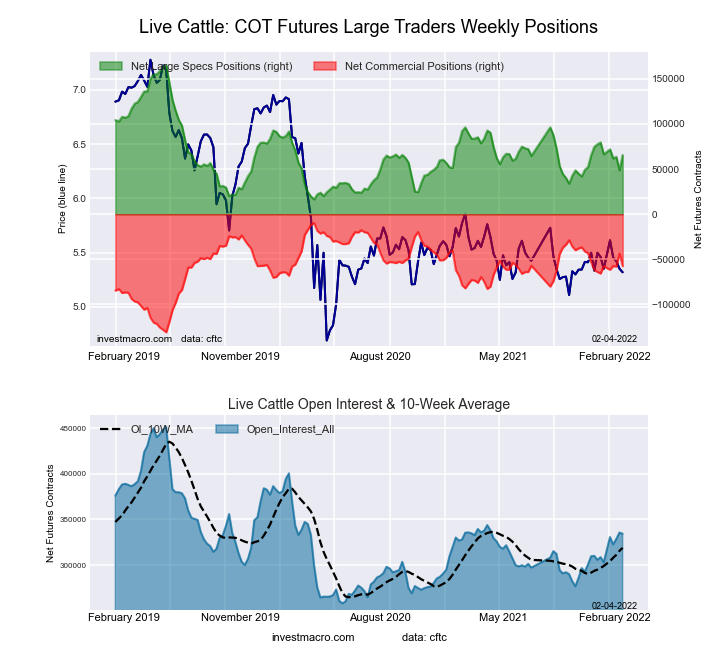
This week’s current strength score (the trader positioning range over the past three years, measured from 0 to 100) shows the speculators are currently Bearish with a score of 33.0 percent. The commercials are Bullish with a score of 60.5 percent and the small traders (not shown in chart) are Bullish with a score of 67.7 percent.
| LIVE CATTLE Futures Statistics | SPECULATORS | COMMERCIALS | SMALL TRADERS |
| – Percent of Open Interest Longs: | 35.5 | 38.1 | 10.7 |
| – Percent of Open Interest Shorts: | 15.9 | 55.3 | 13.1 |
| – Net Position: | 65,508 | -57,535 | -7,973 |
| – Gross Longs: | 118,790 | 127,335 | 35,671 |
| – Gross Shorts: | 53,282 | 184,870 | 43,644 |
| – Long to Short Ratio: | 2.2 to 1 | 0.7 to 1 | 0.8 to 1 |
| NET POSITION TREND: | |||
| – Strength Index Score (3 Year Range Pct): | 33.0 | 60.5 | 67.7 |
| – Strength Index Reading (3 Year Range): | Bearish | Bullish | Bullish |
| NET POSITION MOVEMENT INDEX: | |||
| – 6-Week Change in Strength Index: | -0.6 | 0.1 | 1.6 |
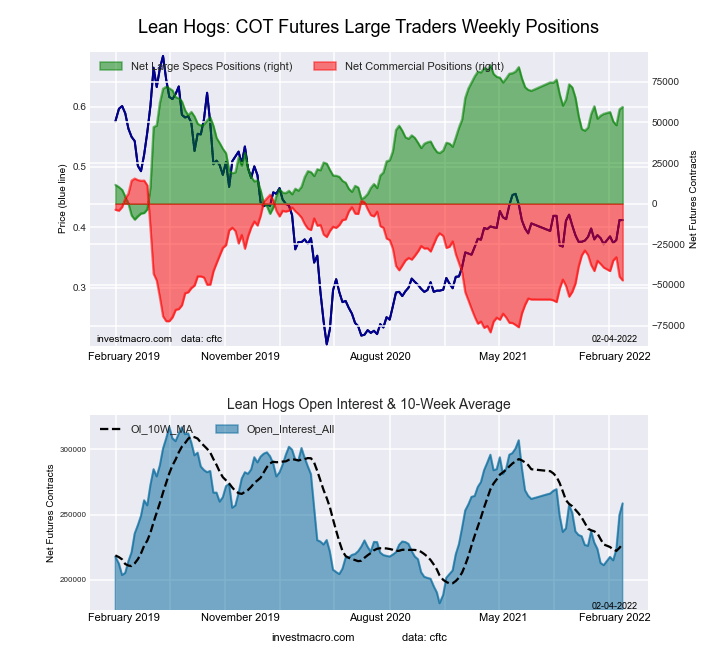
This week’s current strength score (the trader positioning range over the past three years, measured from 0 to 100) shows the speculators are currently Bullish with a score of 72.7 percent. The commercials are Bearish with a score of 33.8 percent and the small traders (not shown in chart) are Bearish with a score of 26.6 percent.
| LEAN HOGS Futures Statistics | SPECULATORS | COMMERCIALS | SMALL TRADERS |
| – Percent of Open Interest Longs: | 39.7 | 33.5 | 8.5 |
| – Percent of Open Interest Shorts: | 16.6 | 51.7 | 13.2 |
| – Net Position: | 59,521 | -47,148 | -12,373 |
| – Gross Longs: | 102,573 | 86,681 | 21,898 |
| – Gross Shorts: | 43,052 | 133,829 | 34,271 |
| – Long to Short Ratio: | 2.4 to 1 | 0.6 to 1 | 0.6 to 1 |
| NET POSITION TREND: | |||
| – Strength Index Score (3 Year Range Pct): | 72.7 | 33.8 | 26.6 |
| – Strength Index Reading (3 Year Range): | Bullish | Bearish | Bearish |
| NET POSITION MOVEMENT INDEX: | |||
| – 6-Week Change in Strength Index: | 4.4 | -8.3 | 15.6 |
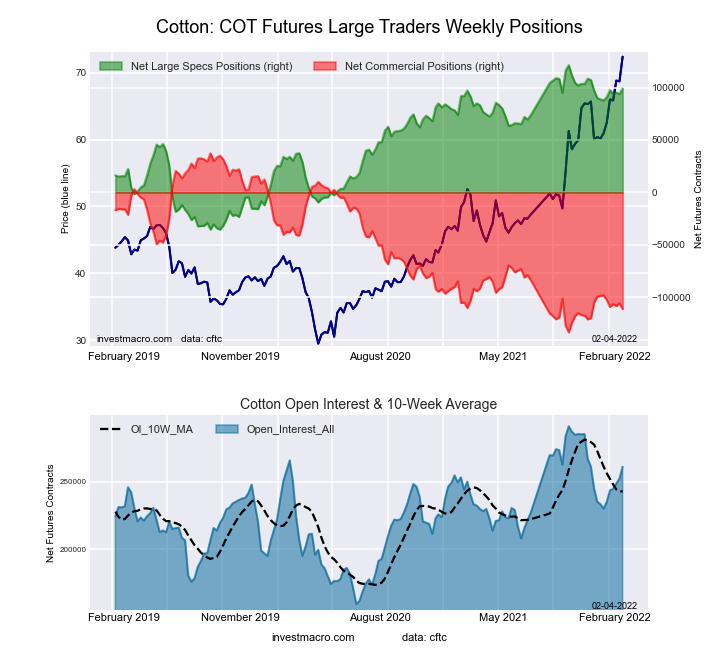
This week’s current strength score (the trader positioning range over the past three years, measured from 0 to 100) shows the speculators are currently Bullish-Extreme with a score of 85.8 percent. The commercials are Bearish-Extreme with a score of 13.0 percent and the small traders (not shown in chart) are Bullish-Extreme with a score of 89.1 percent.
| COTTON Futures Statistics | SPECULATORS | COMMERCIALS | SMALL TRADERS |
| – Percent of Open Interest Longs: | 43.6 | 33.5 | 7.8 |
| – Percent of Open Interest Shorts: | 5.7 | 76.1 | 3.2 |
| – Net Position: | 99,000 | -111,100 | 12,100 |
| – Gross Longs: | 113,867 | 87,358 | 20,428 |
| – Gross Shorts: | 14,867 | 198,458 | 8,328 |
| – Long to Short Ratio: | 7.7 to 1 | 0.4 to 1 | 2.5 to 1 |
| NET POSITION TREND: | |||
| – Strength Index Score (3 Year Range Pct): | 85.8 | 13.0 | 89.1 |
| – Strength Index Reading (3 Year Range): | Bullish-Extreme | Bearish-Extreme | Bullish-Extreme |
| NET POSITION MOVEMENT INDEX: | |||
| – 6-Week Change in Strength Index: | 7.2 | -7.6 | 10.8 |
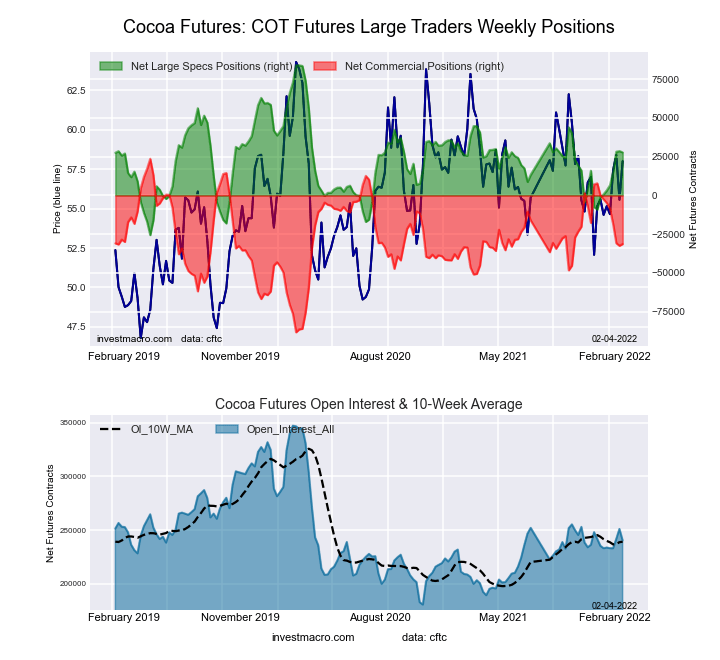
This week’s current strength score (the trader positioning range over the past three years, measured from 0 to 100) shows the speculators are currently Bearish with a score of 48.6 percent. The commercials are Bullish with a score of 50.9 percent and the small traders (not shown in chart) are Bearish with a score of 49.3 percent.
| COCOA Futures Statistics | SPECULATORS | COMMERCIALS | SMALL TRADERS |
| – Percent of Open Interest Longs: | 27.1 | 46.8 | 5.2 |
| – Percent of Open Interest Shorts: | 15.6 | 59.8 | 3.7 |
| – Net Position: | 27,762 | -31,350 | 3,588 |
| – Gross Longs: | 65,259 | 112,462 | 12,556 |
| – Gross Shorts: | 37,497 | 143,812 | 8,968 |
| – Long to Short Ratio: | 1.7 to 1 | 0.8 to 1 | 1.4 to 1 |
| NET POSITION TREND: | |||
| – Strength Index Score (3 Year Range Pct): | 48.6 | 50.9 | 49.3 |
| – Strength Index Reading (3 Year Range): | Bearish | Bullish | Bearish |
| NET POSITION MOVEMENT INDEX: | |||
| – 6-Week Change in Strength Index: | 24.7 | -25.7 | 20.0 |
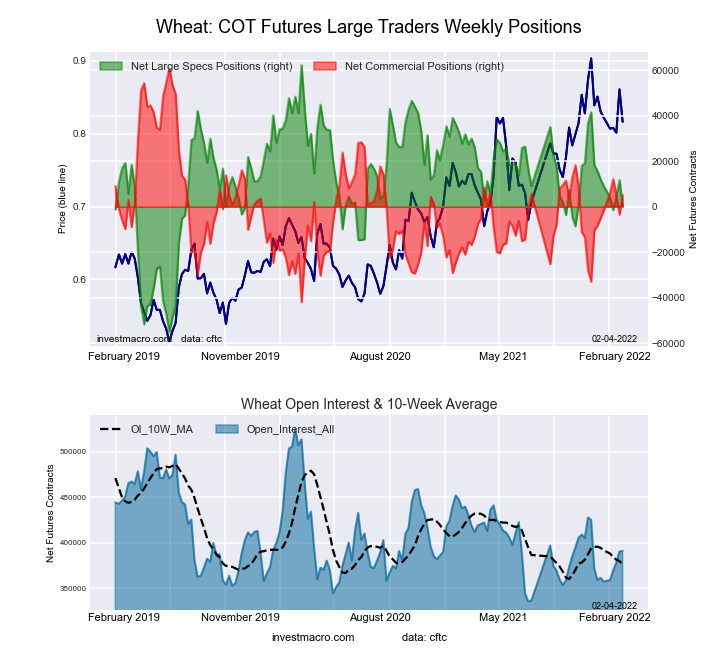
This week’s current strength score (the trader positioning range over the past three years, measured from 0 to 100) shows the speculators are currently Bearish with a score of 47.3 percent. The commercials are Bearish with a score of 45.8 percent and the small traders (not shown in chart) are Bullish with a score of 75.5 percent.
| WHEAT Futures Statistics | SPECULATORS | COMMERCIALS | SMALL TRADERS |
| – Percent of Open Interest Longs: | 27.0 | 38.3 | 8.6 |
| – Percent of Open Interest Shorts: | 26.9 | 37.0 | 10.0 |
| – Net Position: | 350 | 5,100 | -5,450 |
| – Gross Longs: | 105,427 | 149,988 | 33,576 |
| – Gross Shorts: | 105,077 | 144,888 | 39,026 |
| – Long to Short Ratio: | 1.0 to 1 | 1.0 to 1 | 0.9 to 1 |
| NET POSITION TREND: | |||
| – Strength Index Score (3 Year Range Pct): | 47.3 | 45.8 | 75.5 |
| – Strength Index Reading (3 Year Range): | Bearish | Bearish | Bullish |
| NET POSITION MOVEMENT INDEX: | |||
| – 6-Week Change in Strength Index: | -7.5 | 6.5 | 9.9 |
Article By InvestMacro – Receive our weekly COT Reports by Email
*COT Report: The COT data, released weekly to the public each Friday, is updated through the most recent Tuesday (data is 3 days old) and shows a quick view of how large speculators or non-commercials (for-profit traders) were positioned in the futures markets.
The CFTC categorizes trader positions according to commercial hedgers (traders who use futures contracts for hedging as part of the business), non-commercials (large traders who speculate to realize trading profits) and nonreportable traders (usually small traders/speculators) as well as their open interest (contracts open in the market at time of reporting).See CFTC criteria here.
By Analytical Department RoboForex Gold fell to 4,033 USD per ounce on Thursday, extending its…
By JustMarkets By the end of the day, the Dow Jones Index (US30) rose by…
By JustMarkets On Tuesday, the US stock indices finished the session in the green, supported…
By Analytical Department RoboForex GBP/USD rose to 1.3403 on Wednesday, with British politics taking centre…
By Analytical Department RoboForex USD/JPY ended Tuesday at 162.27, with the Japanese yen remaining near…
By JustMarkets On Friday, the Dow Jones Index (US30) rose by 0.29% (weekly: -0.36%). The…
This website uses cookies.