
By InvestMacro | COT | Data Tables | COT Leaders | Downloads | COT Newsletter
Here are the latest charts and statistics for the Commitment of Traders (COT) data published by the Commodities Futures Trading Commission (CFTC).
The latest COT data is updated through Tuesday February 1st and shows a quick view of how large traders (for-profit speculators and commercial entities) were positioned in the futures markets.
Highlighting the COT metals data is this week’s sharp decline in the Gold futures bets. The speculative net position in the Gold futures dropped by -48,009 contracts this week, marking the largest one-week decline in the past one-hundred and forty-six weeks, dating back to April 16th of 2019 when speculator bets fell by -49,091 contracts. The steep drop this week knocked the current speculator standing down to the lowest level since September 28th. Gold prices have been consolidating in a triangle pattern right around the major support/resistance level of $1800.
Joining Gold (-48,009 contracts) in falling this week were Silver (-10,023 contracts) and Copper (-10,326 contracts) while Platinum (789 contracts) and Palladium (996 contracts) had position rises this week.
| Feb-01-2022 | OI | OI-Index | Spec-Net | Spec-Index | Com-Net | COM-Index | Smalls-Net | Smalls-Index |
|---|---|---|---|---|---|---|---|---|
| WTI Crude | 2,093,735 | 35 | 368,904 | 27 | -414,658 | 63 | 45,754 | 79 |
| Gold | 515,331 | 23 | 172,142 | 43 | -201,342 | 56 | 29,200 | 47 |
| Silver | 149,136 | 15 | 22,118 | 44 | -35,263 | 64 | 13,145 | 19 |
| Copper | 198,437 | 25 | 16,155 | 54 | -21,053 | 45 | 4,898 | 54 |
| Palladium | 7,853 | 6 | -992 | 15 | 965 | 83 | 27 | 46 |
| Platinum | 53,898 | 11 | 14,581 | 23 | -19,786 | 81 | 5,205 | 35 |
| Natural Gas | 1,162,813 | 12 | -120,010 | 43 | 90,241 | 59 | 29,769 | 54 |
| Brent | 203,928 | 42 | -18,920 | 86 | 15,734 | 15 | 3,186 | 52 |
| Heating Oil | 347,383 | 30 | 15,683 | 65 | -43,137 | 25 | 27,454 | 93 |
| Soybeans | 796,285 | 44 | 193,373 | 78 | -155,577 | 29 | -37,796 | 9 |
| Corn | 1,568,959 | 33 | 455,220 | 88 | -407,663 | 14 | -47,557 | 16 |
| Coffee | 274,865 | 40 | 61,378 | 93 | -65,365 | 9 | 3,987 | 16 |
| Sugar | 897,035 | 17 | 93,593 | 56 | -117,500 | 46 | 23,907 | 37 |
| Wheat | 391,162 | 29 | 350 | 47 | 5,100 | 46 | -5,450 | 76 |
Free Reports:
 Sign Up for Our Stock Market Newsletter – Get updated on News, Charts & Rankings of Public Companies when you join our Stocks Newsletter
 Get our Weekly Commitment of Traders Reports - See where the biggest traders (Hedge Funds and Commercial Hedgers) are positioned in the futures markets on a weekly basis.
Gold Comex Futures:
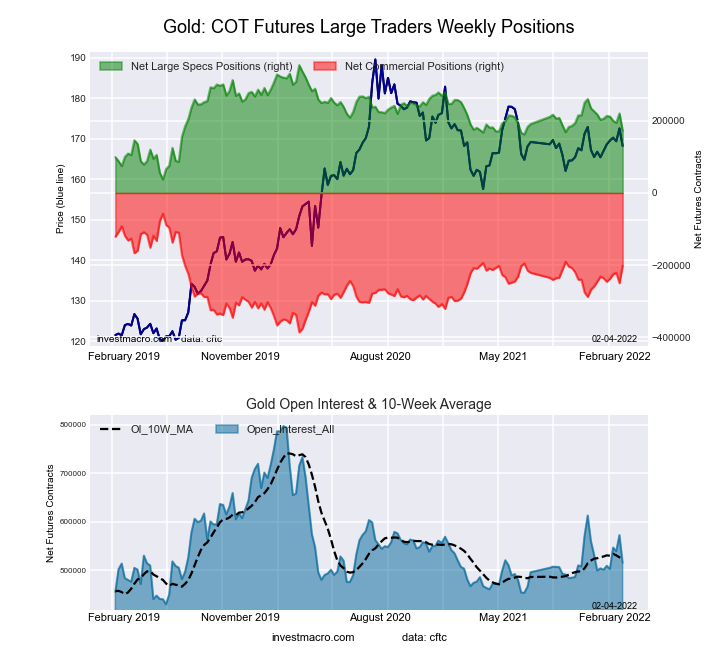 The Gold Comex Futures large speculator standing this week equaled a net position of 172,142 contracts in the data reported through Tuesday. This was a weekly decrease of -48,009 contracts from the previous week which had a total of 220,151 net contracts.
This week’s current strength score (the trader positioning range over the past three years, measured from 0 to 100) shows the speculators are currently Bearish with a score of 42.6 percent. The commercials are Bullish with a score of 56.1 percent and the small traders (not shown in chart) are Bearish with a score of 47.1 percent.
| Gold Futures Statistics | SPECULATORS | COMMERCIALS | SMALL TRADERS |
| – Percent of Open Interest Longs: | 53.6 | 24.8 | 9.1 |
| – Percent of Open Interest Shorts: | 20.2 | 63.8 | 3.4 |
| – Net Position: | 172,142 | -201,342 | 29,200 |
| – Gross Longs: | 275,994 | 127,633 | 46,819 |
| – Gross Shorts: | 103,852 | 328,975 | 17,619 |
| – Long to Short Ratio: | 2.7 to 1 | 0.4 to 1 | 2.7 to 1 |
| NET POSITION TREND: | |||
| – Strength Index Score (3 Year Range Pct): | 42.6 | 56.1 | 47.1 |
| – Strength Index Reading (3 Year Range): | Bearish | Bullish | Bearish |
| NET POSITION MOVEMENT INDEX: | |||
| – 6-Week Change in Strength Index: | -10.6 | 10.6 | -2.9 |
Silver Comex Futures:
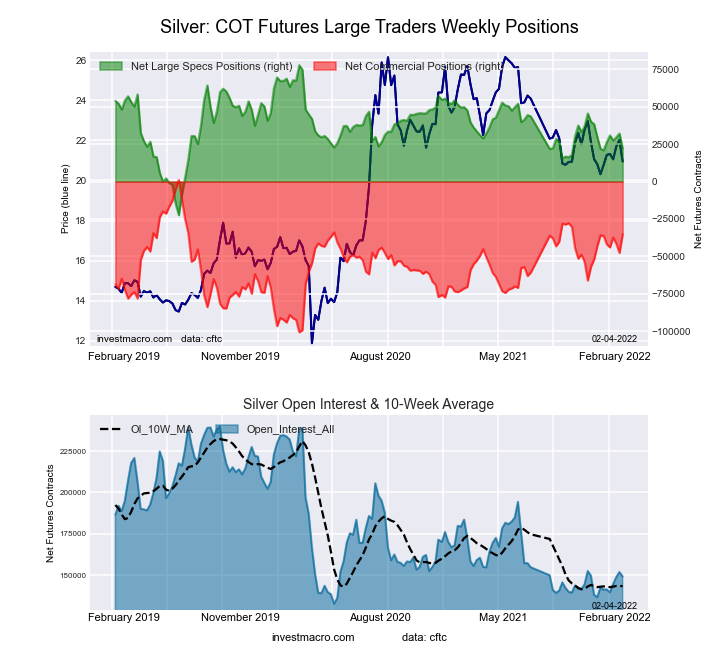 The Silver Comex Futures large speculator standing this week equaled a net position of 22,118 contracts in the data reported through Tuesday. This was a weekly decrease of -10,023 contracts from the previous week which had a total of 32,141 net contracts.
This week’s current strength score (the trader positioning range over the past three years, measured from 0 to 100) shows the speculators are currently Bearish with a score of 44.4 percent. The commercials are Bullish with a score of 64.3 percent and the small traders (not shown in chart) are Bearish-Extreme with a score of 19.4 percent.
| Silver Futures Statistics | SPECULATORS | COMMERCIALS | SMALL TRADERS |
| – Percent of Open Interest Longs: | 40.7 | 35.5 | 16.5 |
| – Percent of Open Interest Shorts: | 25.9 | 59.2 | 7.7 |
| – Net Position: | 22,118 | -35,263 | 13,145 |
| – Gross Longs: | 60,723 | 52,970 | 24,681 |
| – Gross Shorts: | 38,605 | 88,233 | 11,536 |
| – Long to Short Ratio: | 1.6 to 1 | 0.6 to 1 | 2.1 to 1 |
| NET POSITION TREND: | |||
| – Strength Index Score (3 Year Range Pct): | 44.4 | 64.3 | 19.4 |
| – Strength Index Reading (3 Year Range): | Bearish | Bullish | Bearish-Extreme |
| NET POSITION MOVEMENT INDEX: | |||
| – 6-Week Change in Strength Index: | 1.2 | 1.1 | -13.6 |
Copper Grade #1 Futures:
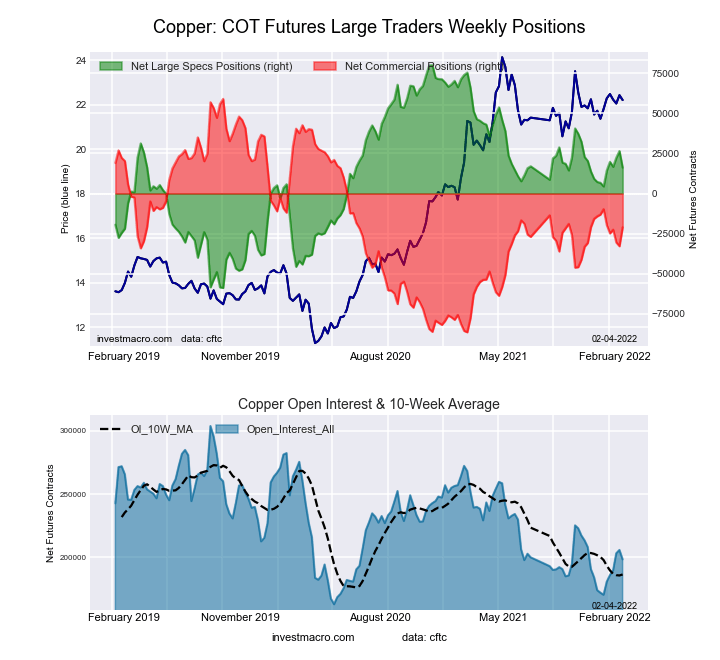 The Copper Grade #1 Futures large speculator standing this week equaled a net position of 16,155 contracts in the data reported through Tuesday. This was a weekly decrease of -10,326 contracts from the previous week which had a total of 26,481 net contracts.
This week’s current strength score (the trader positioning range over the past three years, measured from 0 to 100) shows the speculators are currently Bullish with a score of 54.0 percent. The commercials are Bearish with a score of 45.0 percent and the small traders (not shown in chart) are Bullish with a score of 53.6 percent.
| Copper Futures Statistics | SPECULATORS | COMMERCIALS | SMALL TRADERS |
| – Percent of Open Interest Longs: | 34.8 | 42.6 | 8.3 |
| – Percent of Open Interest Shorts: | 26.6 | 53.2 | 5.9 |
| – Net Position: | 16,155 | -21,053 | 4,898 |
| – Gross Longs: | 68,984 | 84,446 | 16,522 |
| – Gross Shorts: | 52,829 | 105,499 | 11,624 |
| – Long to Short Ratio: | 1.3 to 1 | 0.8 to 1 | 1.4 to 1 |
| NET POSITION TREND: | |||
| – Strength Index Score (3 Year Range Pct): | 54.0 | 45.0 | 53.6 |
| – Strength Index Reading (3 Year Range): | Bullish | Bearish | Bullish |
| NET POSITION MOVEMENT INDEX: | |||
| – 6-Week Change in Strength Index: | 8.4 | -7.7 | -2.6 |
Platinum Futures:
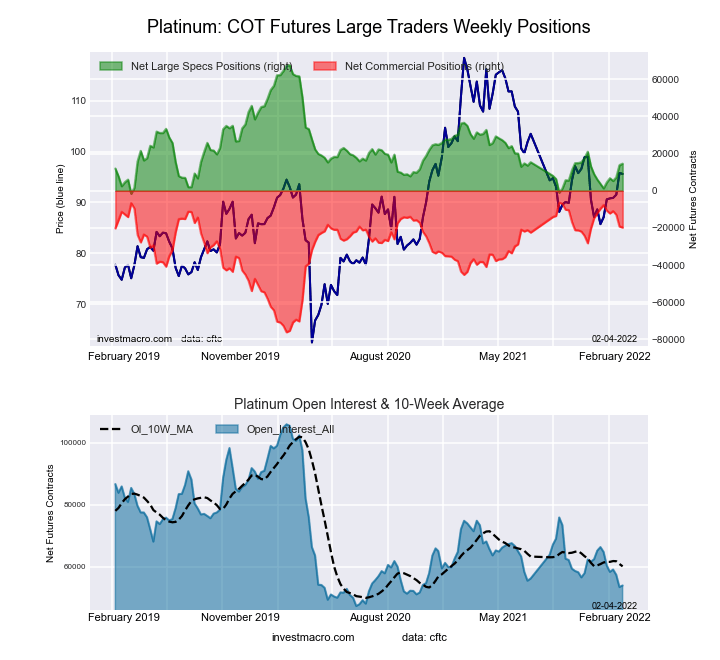 The Platinum Futures large speculator standing this week equaled a net position of 14,581 contracts in the data reported through Tuesday. This was a weekly increase of 789 contracts from the previous week which had a total of 13,792 net contracts.
This week’s current strength score (the trader positioning range over the past three years, measured from 0 to 100) shows the speculators are currently Bearish with a score of 23.4 percent. The commercials are Bullish-Extreme with a score of 80.7 percent and the small traders (not shown in chart) are Bearish with a score of 34.6 percent.
| Platinum Futures Statistics | SPECULATORS | COMMERCIALS | SMALL TRADERS |
| – Percent of Open Interest Longs: | 52.3 | 30.2 | 14.9 |
| – Percent of Open Interest Shorts: | 25.2 | 66.9 | 5.2 |
| – Net Position: | 14,581 | -19,786 | 5,205 |
| – Gross Longs: | 28,171 | 16,293 | 8,031 |
| – Gross Shorts: | 13,590 | 36,079 | 2,826 |
| – Long to Short Ratio: | 2.1 to 1 | 0.5 to 1 | 2.8 to 1 |
| NET POSITION TREND: | |||
| – Strength Index Score (3 Year Range Pct): | 23.4 | 80.7 | 34.6 |
| – Strength Index Reading (3 Year Range): | Bearish | Bullish-Extreme | Bearish |
| NET POSITION MOVEMENT INDEX: | |||
| – 6-Week Change in Strength Index: | 19.2 | -17.3 | -17.4 |
Palladium Futures:
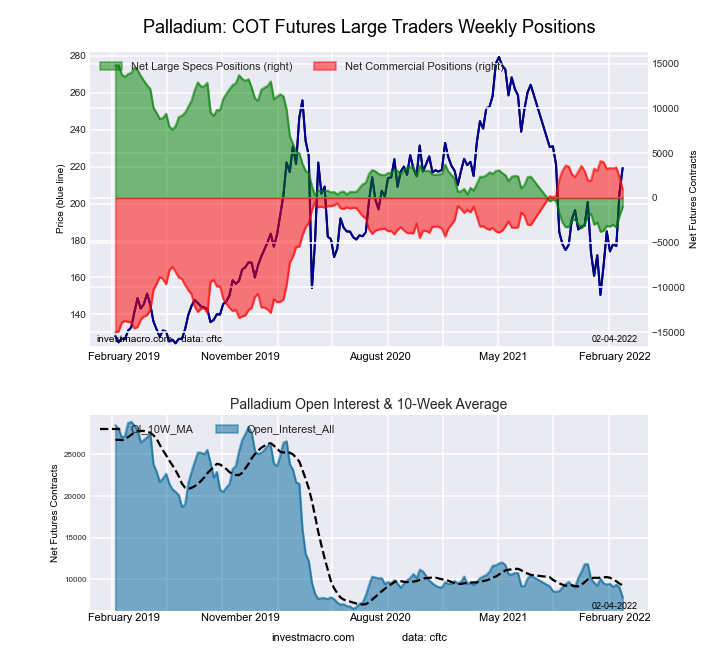 The Palladium Futures large speculator standing this week equaled a net position of -992 contracts in the data reported through Tuesday. This was a weekly gain of 996 contracts from the previous week which had a total of -1,988 net contracts.
This week’s current strength score (the trader positioning range over the past three years, measured from 0 to 100) shows the speculators are currently Bearish-Extreme with a score of 15.2 percent. The commercials are Bullish-Extreme with a score of 83.1 percent and the small traders (not shown in chart) are Bearish with a score of 46.2 percent.
| Palladium Futures Statistics | SPECULATORS | COMMERCIALS | SMALL TRADERS |
| – Percent of Open Interest Longs: | 27.7 | 50.2 | 16.4 |
| – Percent of Open Interest Shorts: | 40.3 | 37.9 | 16.1 |
| – Net Position: | -992 | 965 | 27 |
| – Gross Longs: | 2,172 | 3,943 | 1,291 |
| – Gross Shorts: | 3,164 | 2,978 | 1,264 |
| – Long to Short Ratio: | 0.7 to 1 | 1.3 to 1 | 1.0 to 1 |
| NET POSITION TREND: | |||
| – Strength Index Score (3 Year Range Pct): | 15.2 | 83.1 | 46.2 |
| – Strength Index Reading (3 Year Range): | Bearish-Extreme | Bullish-Extreme | Bearish |
| NET POSITION MOVEMENT INDEX: | |||
| – 6-Week Change in Strength Index: | 14.5 | -16.2 | 22.0 |
Article By InvestMacro – Receive our weekly COT Reports by Email
*COT Report: The COT data, released weekly to the public each Friday, is updated through the most recent Tuesday (data is 3 days old) and shows a quick view of how large speculators or non-commercials (for-profit traders) were positioned in the futures markets.
The CFTC categorizes trader positions according to commercial hedgers (traders who use futures contracts for hedging as part of the business), non-commercials (large traders who speculate to realize trading profits) and nonreportable traders (usually small traders/speculators) as well as their open interest (contracts open in the market at time of reporting).See CFTC criteria here.

- The Bank of Canada kept its interest rate unchanged. Platinum prices reached a three‑week high Jul 16, 2026
- Stock indices rose after the release of US inflation data. China’s GDP slowed sharply Jul 15, 2026
- GBP/USD Awaits Political News: What Will Happen Next Jul 15, 2026
- USD/JPY Holds at Highs: Pressure Lingers on Yen Jul 14, 2026
- Oil prices jumped 4% amid a new wave of escalation between the US and Iran Jul 13, 2026
- EUR/USD: US Inflation Will Determine Everything Jul 13, 2026
- COT Metals Charts: Weekly Speculator Bets see small gains for Silver & Gold Jul 12, 2026
- COT Bonds Charts: Speculator Bets led by SOFR 3-Months & 2-Year Bonds Jul 12, 2026
- COT Energy Charts: Weekly Speculator Changes led by Brent Oil Jul 12, 2026
- COT Soft Commodities Charts: Weekly Speculator Changes led by Sugar, Corn & Soybeans Jul 12, 2026