
By InvestMacro | COT | Data Tables | COT Leaders | Downloads | COT Newsletter
Here are the latest charts and statistics for the Commitment of Traders (COT) data published by the Commodities Futures Trading Commission (CFTC).
The latest COT data is updated through Tuesday February 1st 2022 and shows a quick view of how large traders (for-profit speculators and commercial entities) were positioned in the futures markets.
Highlighting the COT energy data is the increase in the RBOB Gasoline futures bets. The speculative net position in the Gasoline futures rose this week for the second time in three weeks and for the eighth time in the past twelve weeks. This bullishness has pushed speculator bets to the highest level in approximately one year, dating back to February 9th of 2021. The RBOB Gasoline futures price has also been on a strong uptrend with prices hitting their highest levels since 2014 this week.
Joining Gasoline (5,747 contracts) in gaining this week were Brent Crude Oil (7,016 contracts) and Natural Gas (4,525 contracts) while WTI Crude Oil (-4,511 contracts), Heating Oil (-2,317 contracts) and the Bloomberg Commodity Index (-798 contracts) had lower bets on the week.
| Feb-01-2022 | OI | OI-Index | Spec-Net | Spec-Index | Com-Net | COM-Index | Smalls-Net | Smalls-Index |
|---|---|---|---|---|---|---|---|---|
| WTI Crude | 2,093,735 | 35 | 368,904 | 27 | -414,658 | 63 | 45,754 | 79 |
| Gold | 515,331 | 23 | 172,142 | 43 | -201,342 | 56 | 29,200 | 47 |
| Silver | 149,136 | 15 | 22,118 | 44 | -35,263 | 64 | 13,145 | 19 |
| Copper | 198,437 | 25 | 16,155 | 54 | -21,053 | 45 | 4,898 | 54 |
| Palladium | 7,853 | 6 | -992 | 15 | 965 | 83 | 27 | 46 |
| Platinum | 53,898 | 11 | 14,581 | 23 | -19,786 | 81 | 5,205 | 35 |
| Natural Gas | 1,162,813 | 12 | -120,010 | 43 | 90,241 | 59 | 29,769 | 54 |
| Brent | 203,928 | 42 | -18,920 | 86 | 15,734 | 15 | 3,186 | 52 |
| Heating Oil | 347,383 | 30 | 15,683 | 65 | -43,137 | 25 | 27,454 | 93 |
| Soybeans | 796,285 | 44 | 193,373 | 78 | -155,577 | 29 | -37,796 | 9 |
| Corn | 1,568,959 | 33 | 455,220 | 88 | -407,663 | 14 | -47,557 | 16 |
| Coffee | 274,865 | 40 | 61,378 | 93 | -65,365 | 9 | 3,987 | 16 |
| Sugar | 897,035 | 17 | 93,593 | 56 | -117,500 | 46 | 23,907 | 37 |
| Wheat | 391,162 | 29 | 350 | 47 | 5,100 | 46 | -5,450 | 76 |
Free Reports:
 Get our Weekly Commitment of Traders Reports - See where the biggest traders (Hedge Funds and Commercial Hedgers) are positioned in the futures markets on a weekly basis.
 Sign Up for Our Stock Market Newsletter – Get updated on News, Charts & Rankings of Public Companies when you join our Stocks Newsletter
WTI Crude Oil Futures:
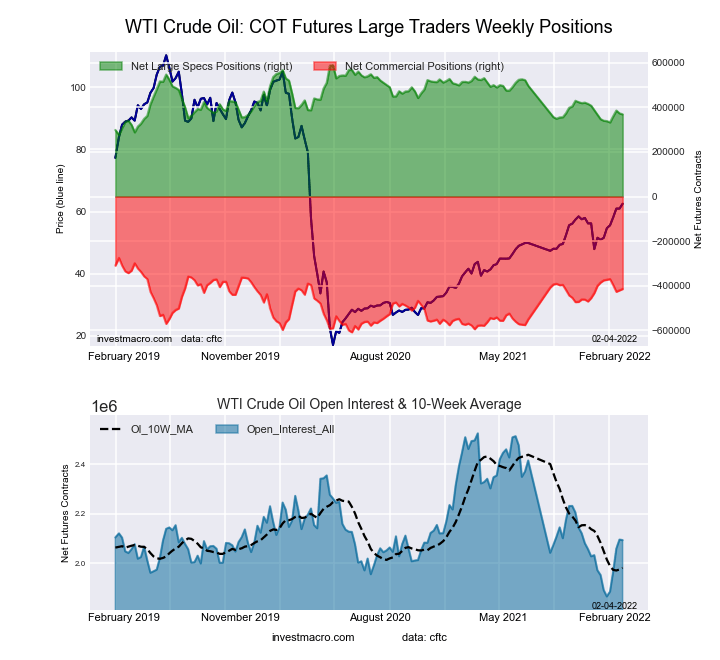 The WTI Crude Oil Futures large speculator standing this week recorded a net position of 368,904 contracts in the data reported through Tuesday. This was a weekly decrease of -4,511 contracts from the previous week which had a total of 373,415 net contracts.
This week’s current strength score (the trader positioning range over the past three years, measured from 0 to 100) shows the speculators are currently Bearish with a score of 26.8 percent. The commercials are Bullish with a score of 62.6 percent and the small traders (not shown in chart) are Bullish with a score of 79.5 percent.
| WTI Crude Oil Futures Statistics | SPECULATORS | COMMERCIALS | SMALL TRADERS |
| – Percent of Open Interest Longs: | 23.3 | 34.4 | 4.8 |
| – Percent of Open Interest Shorts: | 5.7 | 54.2 | 2.6 |
| – Net Position: | 368,904 | -414,658 | 45,754 |
| – Gross Longs: | 487,606 | 719,202 | 99,747 |
| – Gross Shorts: | 118,702 | 1,133,860 | 53,993 |
| – Long to Short Ratio: | 4.1 to 1 | 0.6 to 1 | 1.8 to 1 |
| NET POSITION TREND: | |||
| – Strength Index Score (3 Year Range Pct): | 26.8 | 62.6 | 79.5 |
| – Strength Index Reading (3 Year Range): | Bearish | Bullish | Bullish |
| NET POSITION MOVEMENT INDEX: | |||
| – 6-Week Change in Strength Index: | 9.5 | -12.5 | 14.4 |
Brent Crude Oil Futures:
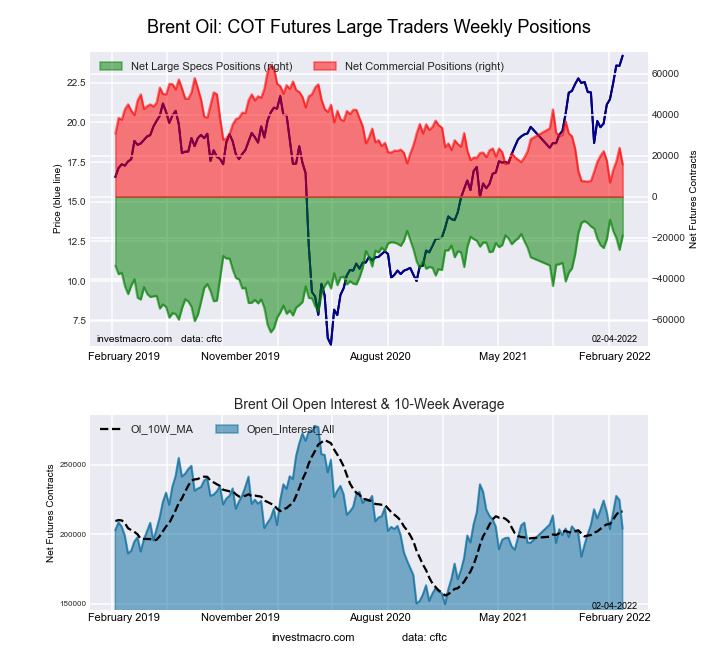 The Brent Crude Oil Futures large speculator standing this week recorded a net position of -18,920 contracts in the data reported through Tuesday. This was a weekly rise of 7,016 contracts from the previous week which had a total of -25,936 net contracts.
This week’s current strength score (the trader positioning range over the past three years, measured from 0 to 100) shows the speculators are currently Bullish-Extreme with a score of 86.1 percent. The commercials are Bearish-Extreme with a score of 15.3 percent and the small traders (not shown in chart) are Bullish with a score of 52.3 percent.
| Brent Crude Oil Futures Statistics | SPECULATORS | COMMERCIALS | SMALL TRADERS |
| – Percent of Open Interest Longs: | 18.9 | 45.3 | 4.2 |
| – Percent of Open Interest Shorts: | 28.1 | 37.6 | 2.7 |
| – Net Position: | -18,920 | 15,734 | 3,186 |
| – Gross Longs: | 38,465 | 92,453 | 8,604 |
| – Gross Shorts: | 57,385 | 76,719 | 5,418 |
| – Long to Short Ratio: | 0.7 to 1 | 1.2 to 1 | 1.6 to 1 |
| NET POSITION TREND: | |||
| – Strength Index Score (3 Year Range Pct): | 86.1 | 15.3 | 52.3 |
| – Strength Index Reading (3 Year Range): | Bullish-Extreme | Bearish-Extreme | Bullish |
| NET POSITION MOVEMENT INDEX: | |||
| – 6-Week Change in Strength Index: | 11.1 | -11.3 | 5.5 |
Natural Gas Futures:
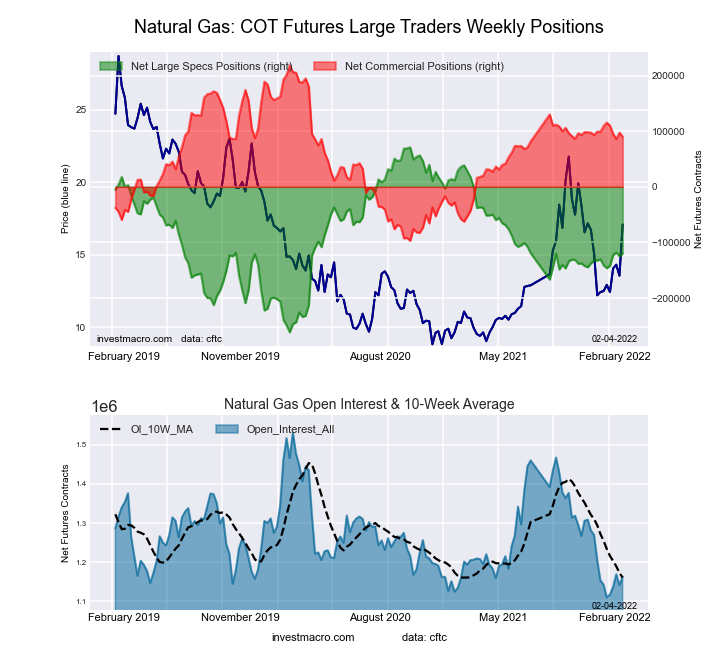 The Natural Gas Futures large speculator standing this week recorded a net position of -120,010 contracts in the data reported through Tuesday. This was a weekly lift of 4,525 contracts from the previous week which had a total of -124,535 net contracts.
This week’s current strength score (the trader positioning range over the past three years, measured from 0 to 100) shows the speculators are currently Bearish with a score of 42.6 percent. The commercials are Bullish with a score of 59.3 percent and the small traders (not shown in chart) are Bullish with a score of 54.4 percent.
| Natural Gas Futures Statistics | SPECULATORS | COMMERCIALS | SMALL TRADERS |
| – Percent of Open Interest Longs: | 20.9 | 40.9 | 4.8 |
| – Percent of Open Interest Shorts: | 31.2 | 33.2 | 2.2 |
| – Net Position: | -120,010 | 90,241 | 29,769 |
| – Gross Longs: | 242,699 | 475,989 | 55,775 |
| – Gross Shorts: | 362,709 | 385,748 | 26,006 |
| – Long to Short Ratio: | 0.7 to 1 | 1.2 to 1 | 2.1 to 1 |
| NET POSITION TREND: | |||
| – Strength Index Score (3 Year Range Pct): | 42.6 | 59.3 | 54.4 |
| – Strength Index Reading (3 Year Range): | Bearish | Bullish | Bullish |
| NET POSITION MOVEMENT INDEX: | |||
| – 6-Week Change in Strength Index: | 6.4 | -6.1 | -4.8 |
Gasoline Blendstock Futures:
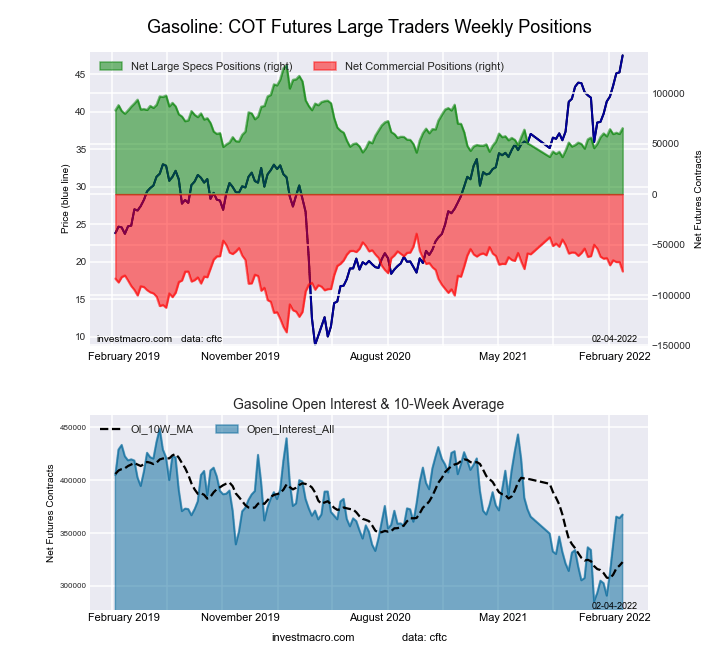 The Gasoline Blendstock Futures large speculator standing this week recorded a net position of 65,352 contracts in the data reported through Tuesday. This was a weekly advance of 5,747 contracts from the previous week which had a total of 59,605 net contracts.
This week’s current strength score (the trader positioning range over the past three years, measured from 0 to 100) shows the speculators are currently Bearish with a score of 36.6 percent. The commercials are Bullish with a score of 60.4 percent and the small traders (not shown in chart) are Bullish with a score of 78.7 percent.
| Nasdaq Mini Futures Statistics | SPECULATORS | COMMERCIALS | SMALL TRADERS |
| – Percent of Open Interest Longs: | 29.6 | 47.2 | 6.8 |
| – Percent of Open Interest Shorts: | 11.8 | 68.0 | 3.7 |
| – Net Position: | 65,352 | -76,584 | 11,232 |
| – Gross Longs: | 108,823 | 173,465 | 24,970 |
| – Gross Shorts: | 43,471 | 250,049 | 13,738 |
| – Long to Short Ratio: | 2.5 to 1 | 0.7 to 1 | 1.8 to 1 |
| NET POSITION TREND: | |||
| – Strength Index Score (3 Year Range Pct): | 36.6 | 60.4 | 78.7 |
| – Strength Index Reading (3 Year Range): | Bearish | Bullish | Bullish |
| NET POSITION MOVEMENT INDEX: | |||
| – 6-Week Change in Strength Index: | 5.3 | -12.7 | 44.7 |
#2 Heating Oil NY-Harbor Futures:
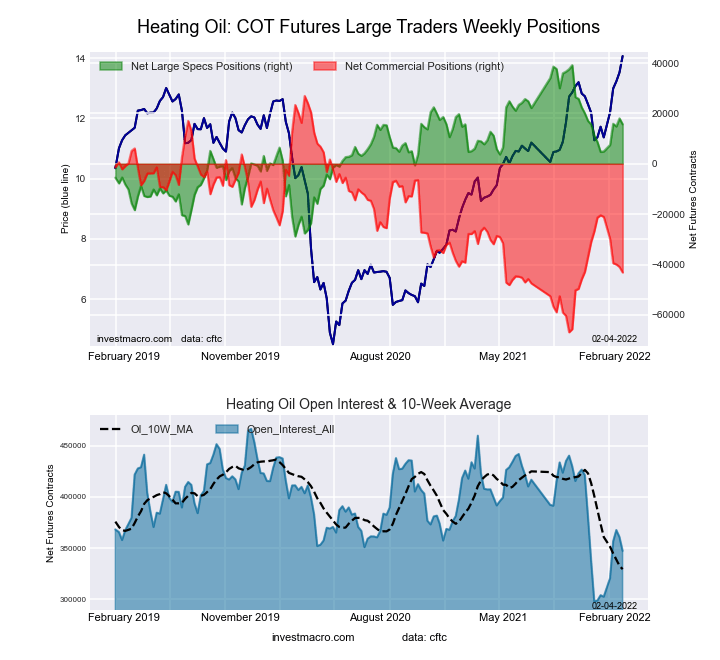 The #2 Heating Oil NY-Harbor Futures large speculator standing this week recorded a net position of 15,683 contracts in the data reported through Tuesday. This was a weekly fall of -2,317 contracts from the previous week which had a total of 18,000 net contracts.
This week’s current strength score (the trader positioning range over the past three years, measured from 0 to 100) shows the speculators are currently Bullish with a score of 65.5 percent. The commercials are Bearish with a score of 25.3 percent and the small traders (not shown in chart) are Bullish-Extreme with a score of 93.5 percent.
| Heating Oil Futures Statistics | SPECULATORS | COMMERCIALS | SMALL TRADERS |
| – Percent of Open Interest Longs: | 18.7 | 47.9 | 14.7 |
| – Percent of Open Interest Shorts: | 14.1 | 60.4 | 6.8 |
| – Net Position: | 15,683 | -43,137 | 27,454 |
| – Gross Longs: | 64,794 | 166,544 | 51,101 |
| – Gross Shorts: | 49,111 | 209,681 | 23,647 |
| – Long to Short Ratio: | 1.3 to 1 | 0.8 to 1 | 2.2 to 1 |
| NET POSITION TREND: | |||
| – Strength Index Score (3 Year Range Pct): | 65.5 | 25.3 | 93.5 |
| – Strength Index Reading (3 Year Range): | Bullish | Bearish | Bullish-Extreme |
| NET POSITION MOVEMENT INDEX: | |||
| – 6-Week Change in Strength Index: | 15.9 | -23.5 | 39.1 |
Bloomberg Commodity Index Futures:
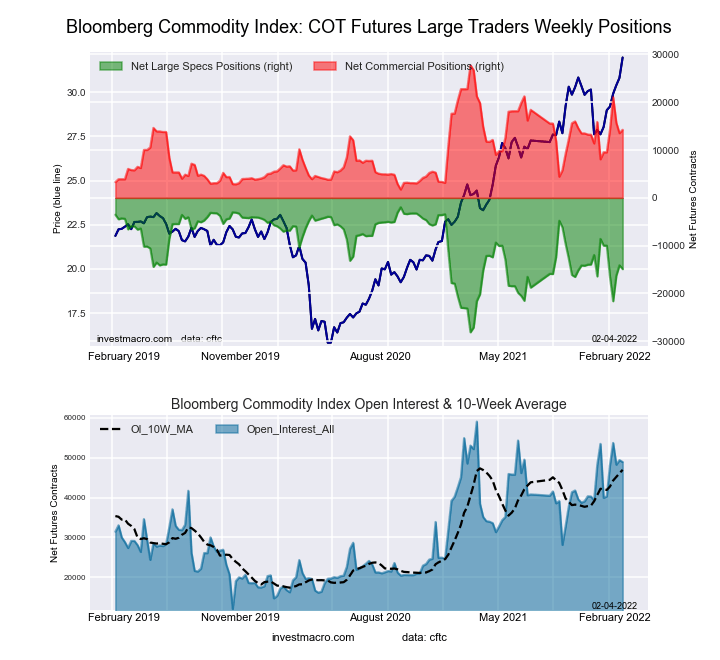 The Bloomberg Commodity Index Futures large speculator standing this week recorded a net position of -14,898 contracts in the data reported through Tuesday. This was a weekly decrease of -798 contracts from the previous week which had a total of -14,100 net contracts.
This week’s current strength score (the trader positioning range over the past three years, measured from 0 to 100) shows the speculators are currently Bullish with a score of 50.5 percent. The commercials are Bearish with a score of 48.1 percent and the small traders (not shown in chart) are Bearish with a score of 43.0 percent.
| Bloomberg Index Futures Statistics | SPECULATORS | COMMERCIALS | SMALL TRADERS |
| – Percent of Open Interest Longs: | 66.0 | 30.3 | 1.4 |
| – Percent of Open Interest Shorts: | 96.4 | 1.2 | 0.1 |
| – Net Position: | -14,898 | 14,237 | 661 |
| – Gross Longs: | 32,278 | 14,837 | 690 |
| – Gross Shorts: | 47,176 | 600 | 29 |
| – Long to Short Ratio: | 0.7 to 1 | 24.7 to 1 | 23.8 to 1 |
| NET POSITION TREND: | |||
| – Strength Index Score (3 Year Range Pct): | 50.5 | 48.1 | 43.0 |
| – Strength Index Reading (3 Year Range): | Bullish | Bearish | Bearish |
| NET POSITION MOVEMENT INDEX: | |||
| – 6-Week Change in Strength Index: | -18.8 | 18.1 | 7.6 |
Article By InvestMacro – Receive our weekly COT Reports by Email
*COT Report: The COT data, released weekly to the public each Friday, is updated through the most recent Tuesday (data is 3 days old) and shows a quick view of how large speculators or non-commercials (for-profit traders) were positioned in the futures markets.
The CFTC categorizes trader positions according to commercial hedgers (traders who use futures contracts for hedging as part of the business), non-commercials (large traders who speculate to realize trading profits) and nonreportable traders (usually small traders/speculators) as well as their open interest (contracts open in the market at time of reporting).See CFTC criteria here.

- The Bank of Canada kept its interest rate unchanged. Platinum prices reached a three‑week high Jul 16, 2026
- Stock indices rose after the release of US inflation data. China’s GDP slowed sharply Jul 15, 2026
- GBP/USD Awaits Political News: What Will Happen Next Jul 15, 2026
- USD/JPY Holds at Highs: Pressure Lingers on Yen Jul 14, 2026
- Oil prices jumped 4% amid a new wave of escalation between the US and Iran Jul 13, 2026
- EUR/USD: US Inflation Will Determine Everything Jul 13, 2026
- COT Metals Charts: Weekly Speculator Bets see small gains for Silver & Gold Jul 12, 2026
- COT Bonds Charts: Speculator Bets led by SOFR 3-Months & 2-Year Bonds Jul 12, 2026
- COT Energy Charts: Weekly Speculator Changes led by Brent Oil Jul 12, 2026
- COT Soft Commodities Charts: Weekly Speculator Changes led by Sugar, Corn & Soybeans Jul 12, 2026