
By InvestMacro | COT | Data Tables | COT Leaders | Downloads | COT Newsletter
Here are the latest charts and statistics for the Commitment of Traders (COT) data published by the Commodities Futures Trading Commission (CFTC).
The latest COT data is updated through Tuesday February 1st and shows a quick view of how large traders (for-profit speculators and commercial entities) were positioned in the futures markets.
Highlighting the COT bonds data is the continued rise in the 2-Year Bond futures bets. Speculative positions rose this week following two weekly decreases and this week’s gain brings the current standing to the highest level in the past four weeks. Overall, the 2-Year bond speculator bets have now been in bullish territory for ten consecutive weeks which marks the longest streak since the fall of 2016 when bullish bets also ran off a ten-week streak. The bullishness has pushed the 2-Year into an extreme bullish speculator strength reading of 91.9 percent (current speculator standing compared to past three years, above 80 is bullish extreme, below 20 is bearish extreme). Despite the speculator sentiment, the 2-Year price has been falling sharply (in tandem with other US bonds) as the US Federal Reserve is getting ready to raise their benchmark interest rate, most likely in the March Fed meeting.
Joining the 2-Year Bond (15,597 contracts) in gaining this week are Eurodollar (11,828 contracts), Long US Bond (27,547 contracts), 5-Year (19,933 contracts), Ultra US Bond (9,652 contracts) while decreasing bets for the week were seen in 10-Year (-10,219 contracts), Ultra 10-Year (-16,826 contracts) and the Fed Funds (-16,837 contracts).
| Feb-01-2022 | OI | OI-Index | Spec-Net | Spec-Index | Com-Net | COM-Index | Smalls-Net | Smalls-Index |
|---|---|---|---|---|---|---|---|---|
| Eurodollar | 11,123,574 | 47 | -2,109,476 | 0 | 2,550,374 | 100 | -440,898 | 7 |
| FedFunds | 1,705,691 | 52 | 32,600 | 44 | -9,177 | 59 | -23,423 | 4 |
| 2-Year | 2,270,248 | 19 | 47,474 | 92 | 53,949 | 32 | -101,423 | 0 |
| Long T-Bond | 1,195,554 | 48 | -36,548 | 80 | 57,497 | 38 | -20,949 | 36 |
| 10-Year | 3,932,501 | 60 | -274,875 | 30 | 563,801 | 92 | -288,926 | 11 |
| 5-Year | 4,019,069 | 49 | -120,524 | 61 | 406,878 | 67 | -286,354 | 2 |
Free Reports:
 Get our Weekly Commitment of Traders Reports - See where the biggest traders (Hedge Funds and Commercial Hedgers) are positioned in the futures markets on a weekly basis.
 Download Our Metatrader 4 Indicators – Put Our Free MetaTrader 4 Custom Indicators on your charts when you join our Weekly Newsletter
3-Month Eurodollars Futures:
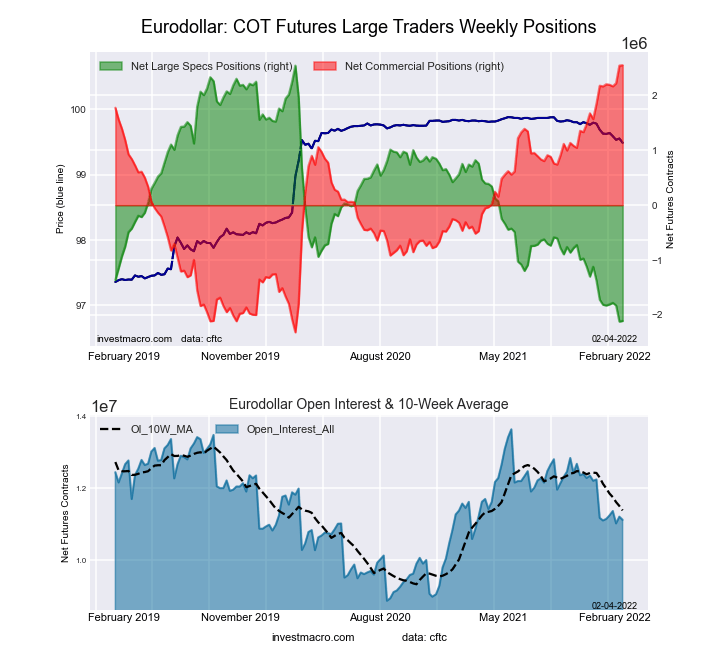 The 3-Month Eurodollars large speculator standing this week reached a net position of -2,109,476 contracts in the data reported through Tuesday. This was a weekly boost of 11,828 contracts from the previous week which had a total of -2,121,304 net contracts.
This week’s current strength score (the trader positioning range over the past three years, measured from 0 to 100) shows the speculators are currently Bearish-Extreme with a score of 0.3 percent. The commercials are Bullish-Extreme with a score of 100.0 percent and the small traders (not shown in chart) are Bearish-Extreme with a score of 7.4 percent.
| 3-Month Eurodollars Statistics | SPECULATORS | COMMERCIALS | SMALL TRADERS |
| – Percent of Open Interest Longs: | 6.0 | 75.1 | 4.1 |
| – Percent of Open Interest Shorts: | 24.9 | 52.2 | 8.0 |
| – Net Position: | -2,109,476 | 2,550,374 | -440,898 |
| – Gross Longs: | 665,466 | 8,353,027 | 453,692 |
| – Gross Shorts: | 2,774,942 | 5,802,653 | 894,590 |
| – Long to Short Ratio: | 0.2 to 1 | 1.4 to 1 | 0.5 to 1 |
| NET POSITION TREND: | |||
| – Strength Index Score (3 Year Range Pct): | 0.3 | 100.0 | 7.4 |
| – Strength Index Reading (3 Year Range): | Bearish-Extreme | Bullish-Extreme | Bearish-Extreme |
| NET POSITION MOVEMENT INDEX: | |||
| – 6-Week Change in Strength Index: | -6.3 | 7.9 | -20.1 |
30-Day Federal Funds Futures:
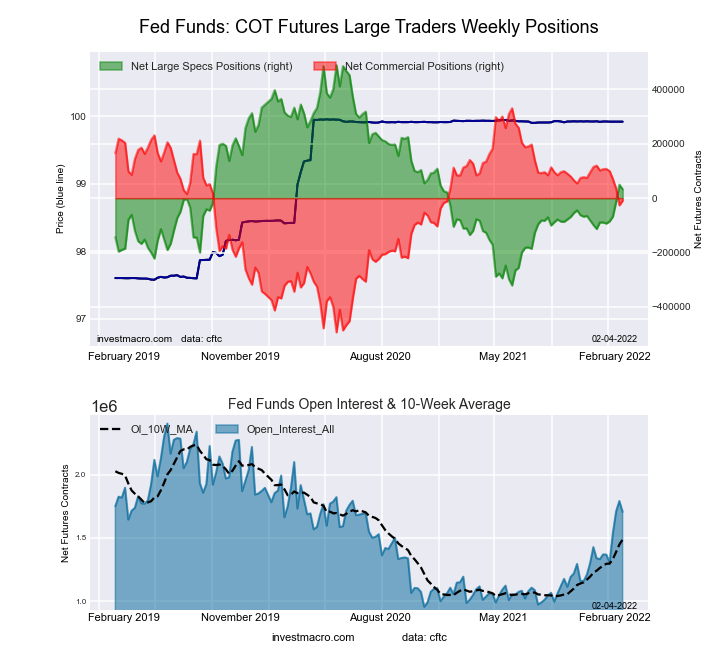 The 30-Day Federal Funds large speculator standing this week reached a net position of 32,600 contracts in the data reported through Tuesday. This was a weekly lowering of -16,837 contracts from the previous week which had a total of 49,437 net contracts.
This week’s current strength score (the trader positioning range over the past three years, measured from 0 to 100) shows the speculators are currently Bearish with a score of 43.6 percent. The commercials are Bullish with a score of 58.8 percent and the small traders (not shown in chart) are Bearish-Extreme with a score of 3.9 percent.
| 30-Day Federal Funds Statistics | SPECULATORS | COMMERCIALS | SMALL TRADERS |
| – Percent of Open Interest Longs: | 9.5 | 73.5 | 1.0 |
| – Percent of Open Interest Shorts: | 7.6 | 74.0 | 2.4 |
| – Net Position: | 32,600 | -9,177 | -23,423 |
| – Gross Longs: | 161,828 | 1,253,476 | 17,450 |
| – Gross Shorts: | 129,228 | 1,262,653 | 40,873 |
| – Long to Short Ratio: | 1.3 to 1 | 1.0 to 1 | 0.4 to 1 |
| NET POSITION TREND: | |||
| – Strength Index Score (3 Year Range Pct): | 43.6 | 58.8 | 3.9 |
| – Strength Index Reading (3 Year Range): | Bearish | Bullish | Bearish-Extreme |
| NET POSITION MOVEMENT INDEX: | |||
| – 6-Week Change in Strength Index: | 15.1 | -14.1 | -15.3 |
2-Year Treasury Note Futures:
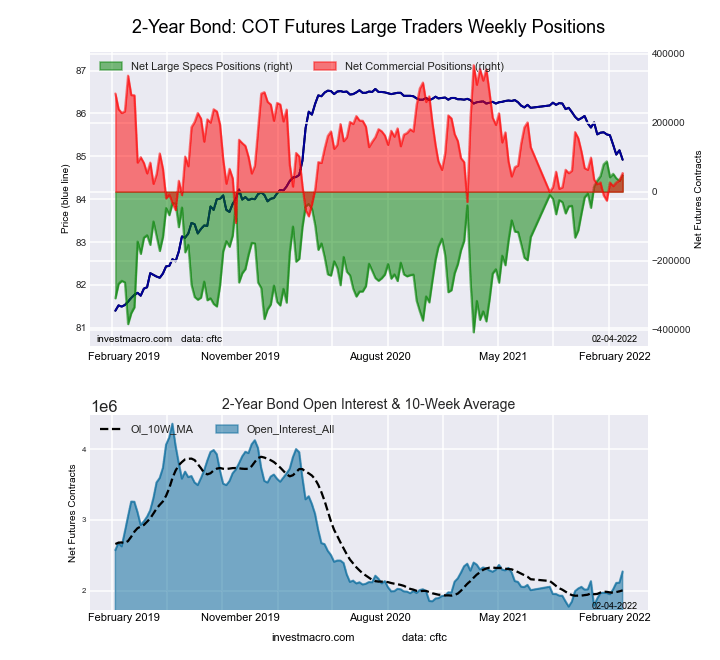 The 2-Year Treasury Note large speculator standing this week reached a net position of 47,474 contracts in the data reported through Tuesday. This was a weekly lift of 15,597 contracts from the previous week which had a total of 31,877 net contracts.
This week’s current strength score (the trader positioning range over the past three years, measured from 0 to 100) shows the speculators are currently Bullish-Extreme with a score of 91.9 percent. The commercials are Bearish with a score of 31.6 percent and the small traders (not shown in chart) are Bearish-Extreme with a score of 0.0 percent.
| 2-Year Treasury Note Statistics | SPECULATORS | COMMERCIALS | SMALL TRADERS |
| – Percent of Open Interest Longs: | 21.2 | 68.5 | 5.3 |
| – Percent of Open Interest Shorts: | 19.2 | 66.1 | 9.8 |
| – Net Position: | 47,474 | 53,949 | -101,423 |
| – Gross Longs: | 482,369 | 1,554,103 | 121,006 |
| – Gross Shorts: | 434,895 | 1,500,154 | 222,429 |
| – Long to Short Ratio: | 1.1 to 1 | 1.0 to 1 | 0.5 to 1 |
| NET POSITION TREND: | |||
| – Strength Index Score (3 Year Range Pct): | 91.9 | 31.6 | 0.0 |
| – Strength Index Reading (3 Year Range): | Bullish-Extreme | Bearish | Bearish-Extreme |
| NET POSITION MOVEMENT INDEX: | |||
| – 6-Week Change in Strength Index: | -6.4 | 14.1 | -14.4 |
5-Year Treasury Note Futures:
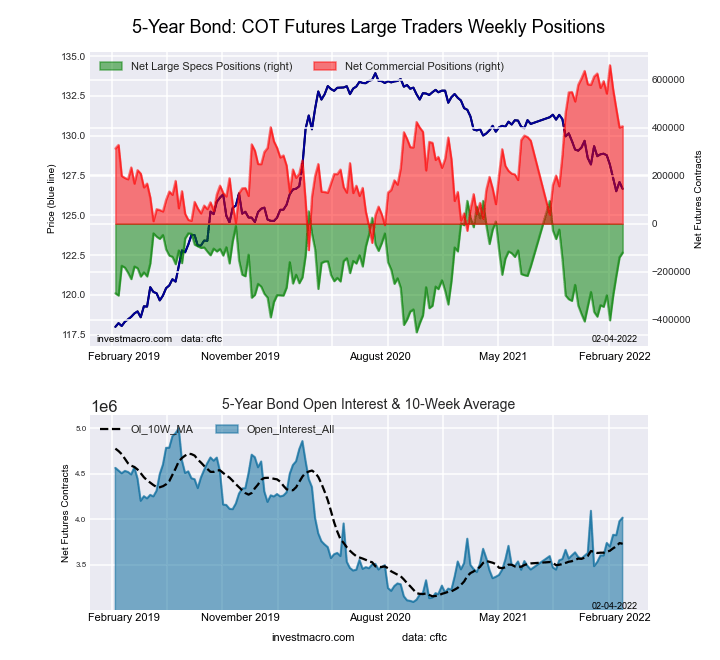 The 5-Year Treasury Note large speculator standing this week reached a net position of -120,524 contracts in the data reported through Tuesday. This was a weekly increase of 19,933 contracts from the previous week which had a total of -140,457 net contracts.
This week’s current strength score (the trader positioning range over the past three years, measured from 0 to 100) shows the speculators are currently Bullish with a score of 60.6 percent. The commercials are Bullish with a score of 67.0 percent and the small traders (not shown in chart) are Bearish-Extreme with a score of 2.5 percent.
| 5-Year Treasury Note Statistics | SPECULATORS | COMMERCIALS | SMALL TRADERS |
| – Percent of Open Interest Longs: | 11.8 | 78.8 | 6.3 |
| – Percent of Open Interest Shorts: | 14.8 | 68.7 | 13.4 |
| – Net Position: | -120,524 | 406,878 | -286,354 |
| – Gross Longs: | 474,899 | 3,168,640 | 252,758 |
| – Gross Shorts: | 595,423 | 2,761,762 | 539,112 |
| – Long to Short Ratio: | 0.8 to 1 | 1.1 to 1 | 0.5 to 1 |
| NET POSITION TREND: | |||
| – Strength Index Score (3 Year Range Pct): | 60.6 | 67.0 | 2.5 |
| – Strength Index Reading (3 Year Range): | Bullish | Bullish | Bearish-Extreme |
| NET POSITION MOVEMENT INDEX: | |||
| – 6-Week Change in Strength Index: | 41.2 | -24.4 | -10.3 |
10-Year Treasury Note Futures:
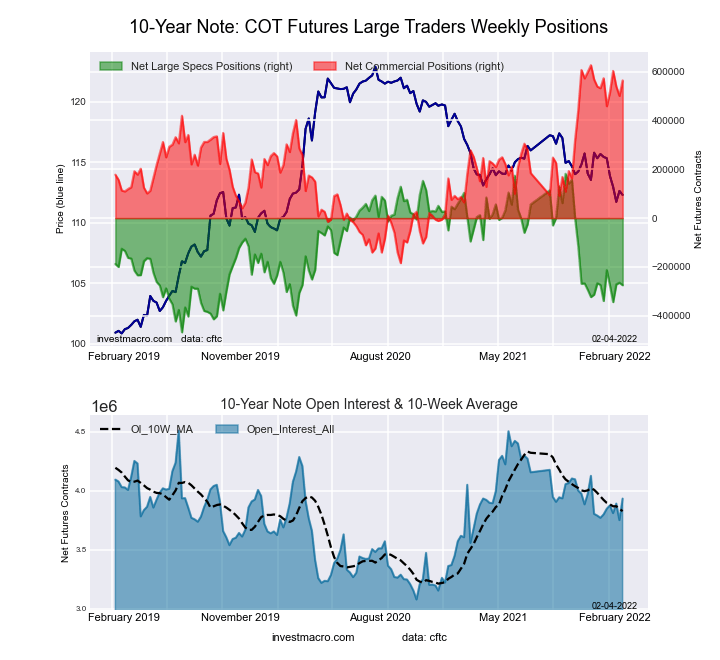 The 10-Year Treasury Note large speculator standing this week reached a net position of -274,875 contracts in the data reported through Tuesday. This was a weekly decline of -10,219 contracts from the previous week which had a total of -264,656 net contracts.
This week’s current strength score (the trader positioning range over the past three years, measured from 0 to 100) shows the speculators are currently Bearish with a score of 29.7 percent. The commercials are Bullish-Extreme with a score of 92.3 percent and the small traders (not shown in chart) are Bearish-Extreme with a score of 11.4 percent.
| 10-Year Treasury Note Statistics | SPECULATORS | COMMERCIALS | SMALL TRADERS |
| – Percent of Open Interest Longs: | 11.5 | 77.1 | 7.5 |
| – Percent of Open Interest Shorts: | 18.5 | 62.8 | 14.9 |
| – Net Position: | -274,875 | 563,801 | -288,926 |
| – Gross Longs: | 450,760 | 3,033,059 | 296,745 |
| – Gross Shorts: | 725,635 | 2,469,258 | 585,671 |
| – Long to Short Ratio: | 0.6 to 1 | 1.2 to 1 | 0.5 to 1 |
| NET POSITION TREND: | |||
| – Strength Index Score (3 Year Range Pct): | 29.7 | 92.3 | 11.4 |
| – Strength Index Reading (3 Year Range): | Bearish | Bullish-Extreme | Bearish-Extreme |
| NET POSITION MOVEMENT INDEX: | |||
| – 6-Week Change in Strength Index: | 9.9 | -1.1 | -12.9 |
Ultra 10-Year Notes Futures:
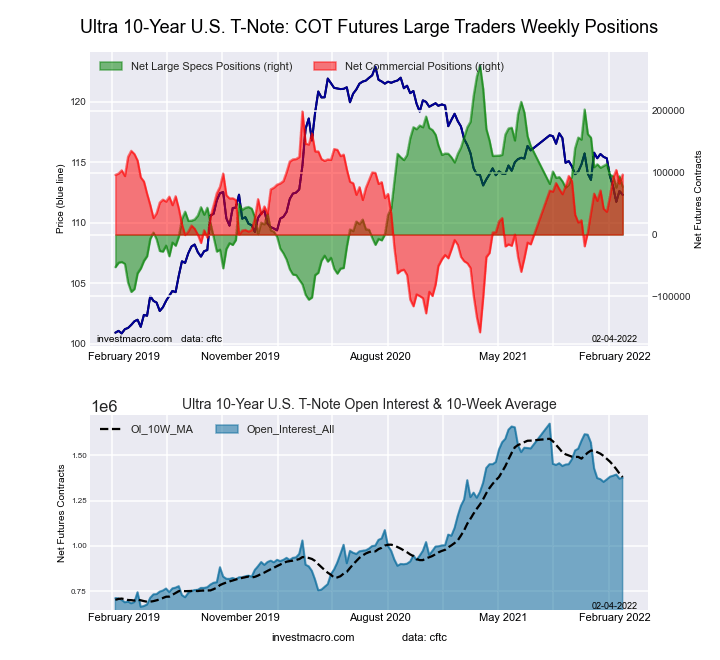 The Ultra 10-Year Notes large speculator standing this week reached a net position of 77,506 contracts in the data reported through Tuesday. This was a weekly lowering of -16,826 contracts from the previous week which had a total of 94,332 net contracts.
This week’s current strength score (the trader positioning range over the past three years, measured from 0 to 100) shows the speculators are currently Bearish with a score of 48.2 percent. The commercials are Bullish with a score of 71.5 percent and the small traders (not shown in chart) are Bearish-Extreme with a score of 10.5 percent.
| Ultra 10-Year Notes Statistics | SPECULATORS | COMMERCIALS | SMALL TRADERS |
| – Percent of Open Interest Longs: | 19.3 | 71.3 | 8.0 |
| – Percent of Open Interest Shorts: | 13.7 | 64.2 | 20.6 |
| – Net Position: | 77,506 | 97,031 | -174,537 |
| – Gross Longs: | 265,490 | 980,592 | 109,597 |
| – Gross Shorts: | 187,984 | 883,561 | 284,134 |
| – Long to Short Ratio: | 1.4 to 1 | 1.1 to 1 | 0.4 to 1 |
| NET POSITION TREND: | |||
| – Strength Index Score (3 Year Range Pct): | 48.2 | 71.5 | 10.5 |
| – Strength Index Reading (3 Year Range): | Bearish | Bullish | Bearish-Extreme |
| NET POSITION MOVEMENT INDEX: | |||
| – 6-Week Change in Strength Index: | -8.8 | 15.5 | -13.2 |
US Treasury Bonds Futures:
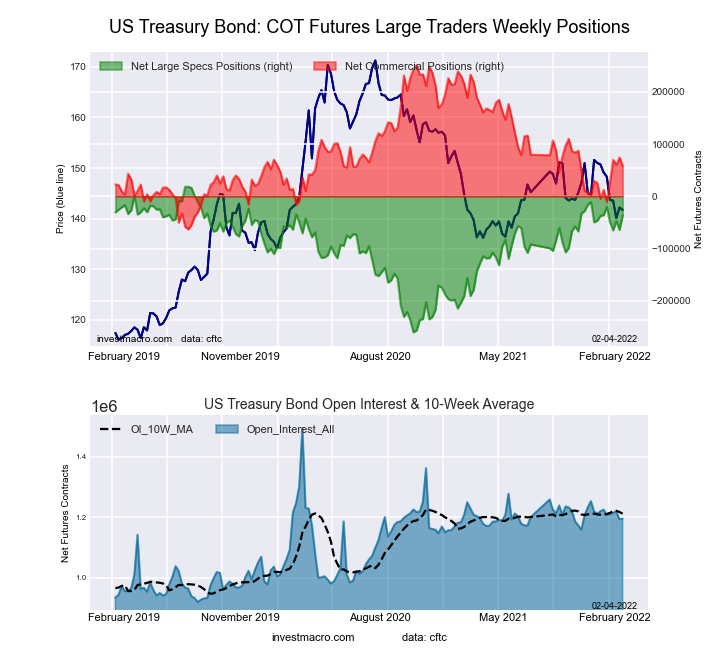 The US Treasury Bonds large speculator standing this week reached a net position of -36,548 contracts in the data reported through Tuesday. This was a weekly boost of 27,547 contracts from the previous week which had a total of -64,095 net contracts.
This week’s current strength score (the trader positioning range over the past three years, measured from 0 to 100) shows the speculators are currently Bullish-Extreme with a score of 80.3 percent. The commercials are Bearish with a score of 38.4 percent and the small traders (not shown in chart) are Bearish with a score of 36.0 percent.
| US Treasury Bonds Statistics | SPECULATORS | COMMERCIALS | SMALL TRADERS |
| – Percent of Open Interest Longs: | 9.7 | 74.5 | 13.9 |
| – Percent of Open Interest Shorts: | 12.8 | 69.7 | 15.7 |
| – Net Position: | -36,548 | 57,497 | -20,949 |
| – Gross Longs: | 116,194 | 890,253 | 166,280 |
| – Gross Shorts: | 152,742 | 832,756 | 187,229 |
| – Long to Short Ratio: | 0.8 to 1 | 1.1 to 1 | 0.9 to 1 |
| NET POSITION TREND: | |||
| – Strength Index Score (3 Year Range Pct): | 80.3 | 38.4 | 36.0 |
| – Strength Index Reading (3 Year Range): | Bullish-Extreme | Bearish | Bearish |
| NET POSITION MOVEMENT INDEX: | |||
| – 6-Week Change in Strength Index: | -0.2 | 14.5 | -35.7 |
Ultra US Treasury Bonds Futures:
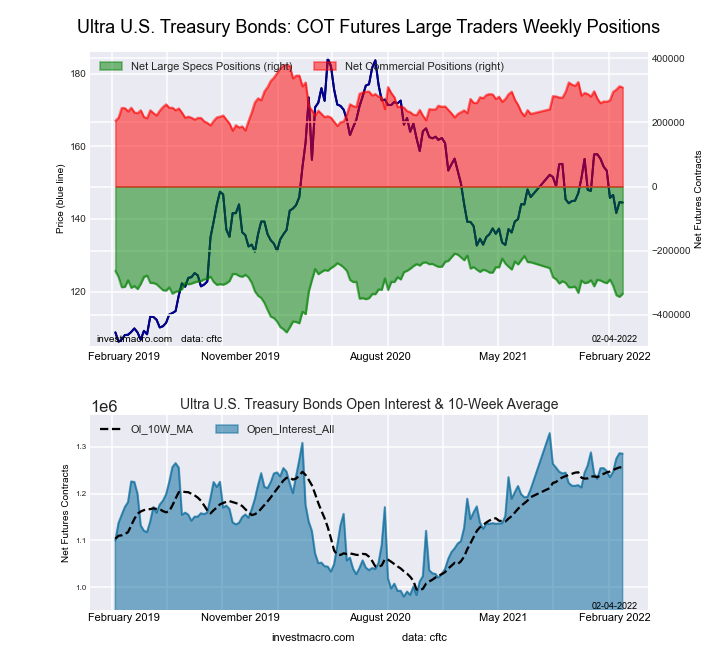 The Ultra US Treasury Bonds large speculator standing this week reached a net position of -333,593 contracts in the data reported through Tuesday. This was a weekly increase of 9,652 contracts from the previous week which had a total of -343,245 net contracts.
This week’s current strength score (the trader positioning range over the past three years, measured from 0 to 100) shows the speculators are currently Bearish with a score of 49.1 percent. The commercials are Bullish with a score of 66.0 percent and the small traders (not shown in chart) are Bearish with a score of 46.2 percent.
| Ultra US Treasury Bonds Statistics | SPECULATORS | COMMERCIALS | SMALL TRADERS |
| – Percent of Open Interest Longs: | 5.5 | 81.8 | 11.8 |
| – Percent of Open Interest Shorts: | 31.5 | 57.8 | 9.9 |
| – Net Position: | -333,593 | 308,562 | 25,031 |
| – Gross Longs: | 71,243 | 1,051,201 | 152,226 |
| – Gross Shorts: | 404,836 | 742,639 | 127,195 |
| – Long to Short Ratio: | 0.2 to 1 | 1.4 to 1 | 1.2 to 1 |
| NET POSITION TREND: | |||
| – Strength Index Score (3 Year Range Pct): | 49.1 | 66.0 | 46.2 |
| – Strength Index Reading (3 Year Range): | Bearish | Bullish | Bearish |
| NET POSITION MOVEMENT INDEX: | |||
| – 6-Week Change in Strength Index: | -14.7 | 21.4 | -5.4 |
Article By InvestMacro – Receive our weekly COT Reports by Email
*COT Report: The COT data, released weekly to the public each Friday, is updated through the most recent Tuesday (data is 3 days old) and shows a quick view of how large speculators or non-commercials (for-profit traders) were positioned in the futures markets.
The CFTC categorizes trader positions according to commercial hedgers (traders who use futures contracts for hedging as part of the business), non-commercials (large traders who speculate to realize trading profits) and nonreportable traders (usually small traders/speculators) as well as their open interest (contracts open in the market at time of reporting).See CFTC criteria here.

- The Bank of Canada kept its interest rate unchanged. Platinum prices reached a three‑week high Jul 16, 2026
- Stock indices rose after the release of US inflation data. China’s GDP slowed sharply Jul 15, 2026
- GBP/USD Awaits Political News: What Will Happen Next Jul 15, 2026
- USD/JPY Holds at Highs: Pressure Lingers on Yen Jul 14, 2026
- Oil prices jumped 4% amid a new wave of escalation between the US and Iran Jul 13, 2026
- EUR/USD: US Inflation Will Determine Everything Jul 13, 2026
- COT Metals Charts: Weekly Speculator Bets see small gains for Silver & Gold Jul 12, 2026
- COT Bonds Charts: Speculator Bets led by SOFR 3-Months & 2-Year Bonds Jul 12, 2026
- COT Energy Charts: Weekly Speculator Changes led by Brent Oil Jul 12, 2026
- COT Soft Commodities Charts: Weekly Speculator Changes led by Sugar, Corn & Soybeans Jul 12, 2026