By InvestMacro | COT | Data Tables | COT Leaders | Downloads | COT Newsletter
Here are the latest charts and statistics for the Commitment of Traders (COT) data published by the Commodities Futures Trading Commission (CFTC).
The latest COT data is updated through Tuesday February 15th and shows a quick view of how large traders (for-profit speculators and commercial entities) were positioned in the futures markets.
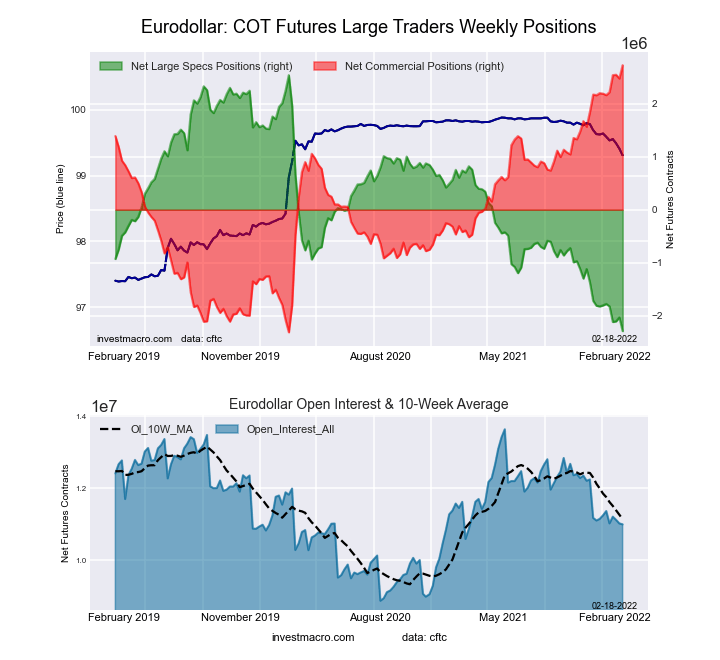
Highlighting the COT bonds data is the continued rise in the Eurodollar bearish bets. The speculative position in the Eurodollar futures has been dropping sharply with higher bearish bets since flipping over from bullish to bearish in May of 2021. The Eurodollar futures are the largest futures market with open interest normally over 10 million contracts each week and are used to make a bet on short-term interest rates (3-month Libor). A decline in Eurodollar futures shows an increase in (deposit) interest rates while an increase in Eurodollar futures shows the opposite. In times of stress (Great Financial Crisis, Covid Crisis), Eurodollar futures have surged higher and in times of normalization, Eurodollar futures usually trend downward. The speculators Eurodollar positioning has been on a downtrend and is currently at the most bearish level of the past one hundred and sixty-six weeks, dating back to December 11th of 2018.
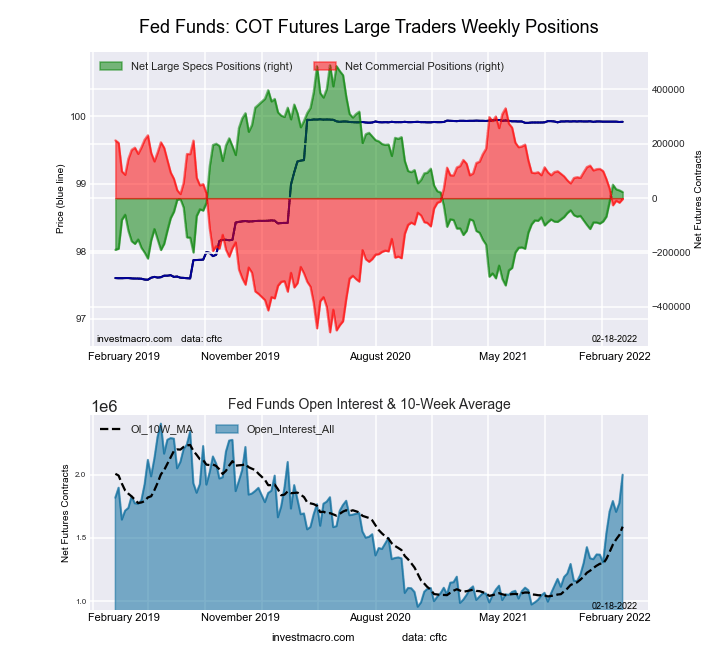
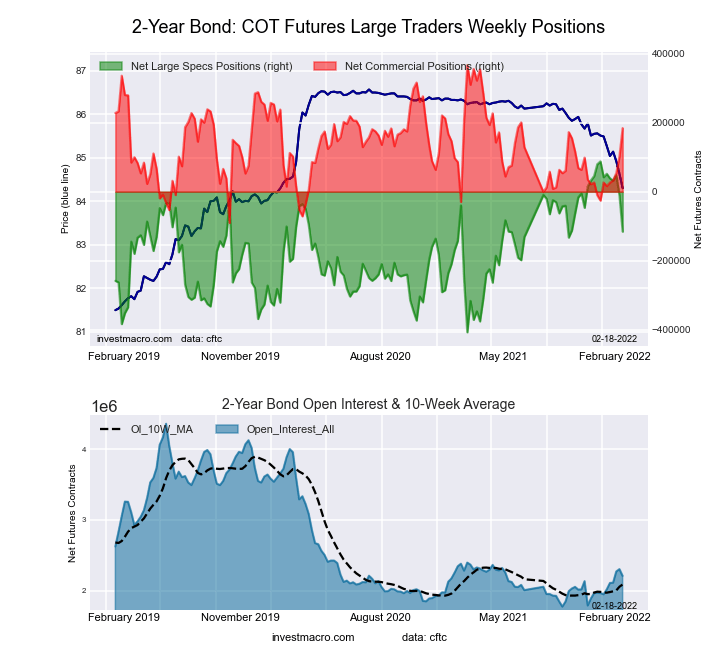
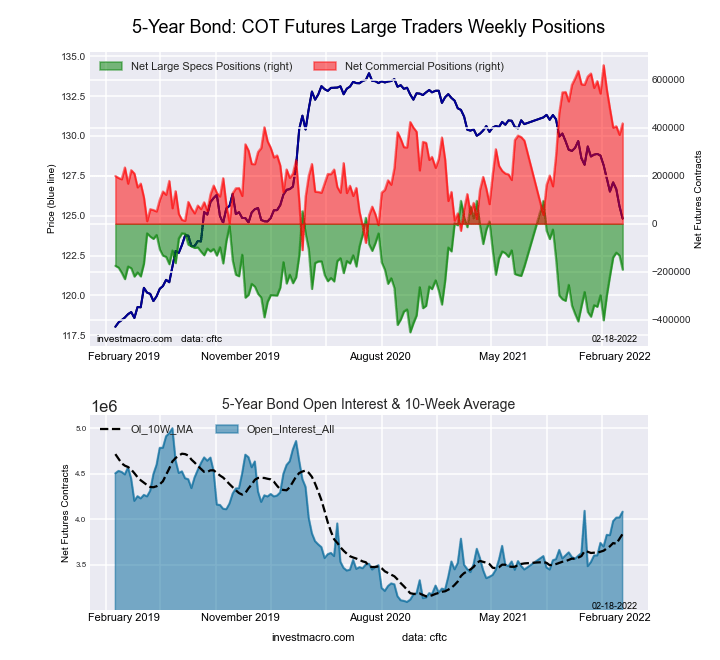
Joining the Eurodollar (-256,945 contracts) in falling this week were the 2-Year Bond (-104,328 contracts), Ultra 10-Year (-30,140 contracts), Fed Funds (-6,129 contracts), 5-Year Bond (-59,036 contracts) and the Ultra US Bond (-14,287 contracts) while increasing bets for the week were seen in the 10-Year Bond (27,847 contracts) and the Long US Bond (8,180 contracts).
| Feb-15-2022 | OI | OI-Index | Spec-Net | Spec-Index | Com-Net | COM-Index | Smalls-Net | Smalls-Index |
|---|---|---|---|---|---|---|---|---|
| Eurodollar | 10,998,807 | 45 | -2,293,237 | 0 | 2,731,451 | 100 | -438,214 | 8 |
| FedFunds | 1,999,560 | 72 | 22,521 | 42 | -3,214 | 59 | -19,307 | 14 |
| 2-Year | 2,207,292 | 17 | -115,758 | 59 | 184,249 | 60 | -68,491 | 15 |
| Long T-Bond | 1,239,190 | 56 | -24,845 | 84 | 42,910 | 34 | -18,065 | 38 |
| 10-Year | 4,123,745 | 73 | -174,063 | 45 | 436,449 | 77 | -262,386 | 18 |
| 5-Year | 4,084,291 | 52 | -191,415 | 48 | 418,890 | 69 | -227,475 | 19 |
Free Reports:
This week’s current strength score (the trader positioning range over the past three years, measured from 0 to 100) shows the speculators are currently Bearish-Extreme with a score of 0.0 percent. The commercials are Bullish-Extreme with a score of 100.0 percent and the small traders (not shown in chart) are Bearish-Extreme with a score of 8.0 percent.
| 3-Month Eurodollars Statistics | SPECULATORS | COMMERCIALS | SMALL TRADERS |
| – Percent of Open Interest Longs: | 4.6 | 75.3 | 3.9 |
| – Percent of Open Interest Shorts: | 25.5 | 50.5 | 7.9 |
| – Net Position: | -2,293,237 | 2,731,451 | -438,214 |
| – Gross Longs: | 510,859 | 8,287,260 | 430,172 |
| – Gross Shorts: | 2,804,096 | 5,555,809 | 868,386 |
| – Long to Short Ratio: | 0.2 to 1 | 1.5 to 1 | 0.5 to 1 |
| NET POSITION TREND: | |||
| – Strength Index Score (3 Year Range Pct): | 0.0 | 100.0 | 8.0 |
| – Strength Index Reading (3 Year Range): | Bearish-Extreme | Bullish-Extreme | Bearish-Extreme |
| NET POSITION MOVEMENT INDEX: | |||
| – 6-Week Change in Strength Index: | -10.0 | 10.7 | -11.9 |
This week’s current strength score (the trader positioning range over the past three years, measured from 0 to 100) shows the speculators are currently Bearish with a score of 42.4 percent. The commercials are Bullish with a score of 59.5 percent and the small traders (not shown in chart) are Bearish-Extreme with a score of 13.9 percent.
| 30-Day Federal Funds Statistics | SPECULATORS | COMMERCIALS | SMALL TRADERS |
| – Percent of Open Interest Longs: | 9.7 | 75.2 | 1.5 |
| – Percent of Open Interest Shorts: | 8.6 | 75.3 | 2.4 |
| – Net Position: | 22,521 | -3,214 | -19,307 |
| – Gross Longs: | 193,542 | 1,503,220 | 29,243 |
| – Gross Shorts: | 171,021 | 1,506,434 | 48,550 |
| – Long to Short Ratio: | 1.1 to 1 | 1.0 to 1 | 0.6 to 1 |
| NET POSITION TREND: | |||
| – Strength Index Score (3 Year Range Pct): | 42.4 | 59.5 | 13.9 |
| – Strength Index Reading (3 Year Range): | Bearish | Bullish | Bearish-Extreme |
| NET POSITION MOVEMENT INDEX: | |||
| – 6-Week Change in Strength Index: | 13.3 | -12.5 | -12.6 |
This week’s current strength score (the trader positioning range over the past three years, measured from 0 to 100) shows the speculators are currently Bullish with a score of 58.9 percent. The commercials are Bullish with a score of 60.1 percent and the small traders (not shown in chart) are Bearish-Extreme with a score of 14.6 percent.
| 2-Year Treasury Note Statistics | SPECULATORS | COMMERCIALS | SMALL TRADERS |
| – Percent of Open Interest Longs: | 13.1 | 77.7 | 6.4 |
| – Percent of Open Interest Shorts: | 18.4 | 69.4 | 9.6 |
| – Net Position: | -115,758 | 184,249 | -68,491 |
| – Gross Longs: | 289,318 | 1,715,204 | 142,310 |
| – Gross Shorts: | 405,076 | 1,530,955 | 210,801 |
| – Long to Short Ratio: | 0.7 to 1 | 1.1 to 1 | 0.7 to 1 |
| NET POSITION TREND: | |||
| – Strength Index Score (3 Year Range Pct): | 58.9 | 60.1 | 14.6 |
| – Strength Index Reading (3 Year Range): | Bullish | Bullish | Bearish-Extreme |
| NET POSITION MOVEMENT INDEX: | |||
| – 6-Week Change in Strength Index: | -31.9 | 34.4 | 0.2 |
This week’s current strength score (the trader positioning range over the past three years, measured from 0 to 100) shows the speculators are currently Bearish with a score of 47.7 percent. The commercials are Bullish with a score of 68.5 percent and the small traders (not shown in chart) are Bearish-Extreme with a score of 18.6 percent.
| 5-Year Treasury Note Statistics | SPECULATORS | COMMERCIALS | SMALL TRADERS |
| – Percent of Open Interest Longs: | 10.7 | 79.5 | 6.6 |
| – Percent of Open Interest Shorts: | 15.4 | 69.2 | 12.1 |
| – Net Position: | -191,415 | 418,890 | -227,475 |
| – Gross Longs: | 436,662 | 3,244,990 | 267,923 |
| – Gross Shorts: | 628,077 | 2,826,100 | 495,398 |
| – Long to Short Ratio: | 0.7 to 1 | 1.1 to 1 | 0.5 to 1 |
| NET POSITION TREND: | |||
| – Strength Index Score (3 Year Range Pct): | 47.7 | 68.5 | 18.6 |
| – Strength Index Reading (3 Year Range): | Bearish | Bullish | Bearish-Extreme |
| NET POSITION MOVEMENT INDEX: | |||
| – 6-Week Change in Strength Index: | 38.6 | -31.5 | 8.6 |
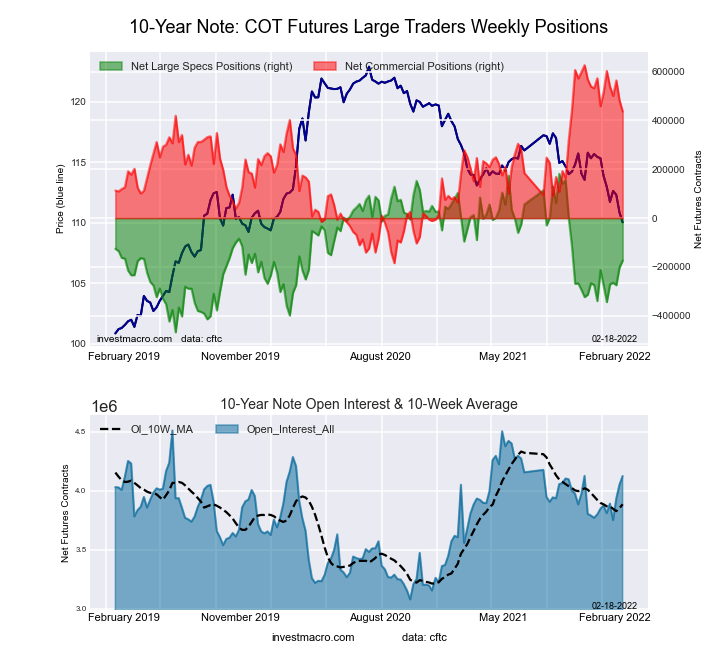
This week’s current strength score (the trader positioning range over the past three years, measured from 0 to 100) shows the speculators are currently Bearish with a score of 45.3 percent. The commercials are Bullish with a score of 76.6 percent and the small traders (not shown in chart) are Bearish-Extreme with a score of 17.6 percent.
| 10-Year Treasury Note Statistics | SPECULATORS | COMMERCIALS | SMALL TRADERS |
| – Percent of Open Interest Longs: | 13.8 | 73.7 | 7.6 |
| – Percent of Open Interest Shorts: | 18.0 | 63.1 | 14.0 |
| – Net Position: | -174,063 | 436,449 | -262,386 |
| – Gross Longs: | 569,973 | 3,038,412 | 314,742 |
| – Gross Shorts: | 744,036 | 2,601,963 | 577,128 |
| – Long to Short Ratio: | 0.8 to 1 | 1.2 to 1 | 0.5 to 1 |
| NET POSITION TREND: | |||
| – Strength Index Score (3 Year Range Pct): | 45.3 | 76.6 | 17.6 |
| – Strength Index Reading (3 Year Range): | Bearish | Bullish | Bearish-Extreme |
| NET POSITION MOVEMENT INDEX: | |||
| – 6-Week Change in Strength Index: | 15.9 | -9.8 | -5.4 |
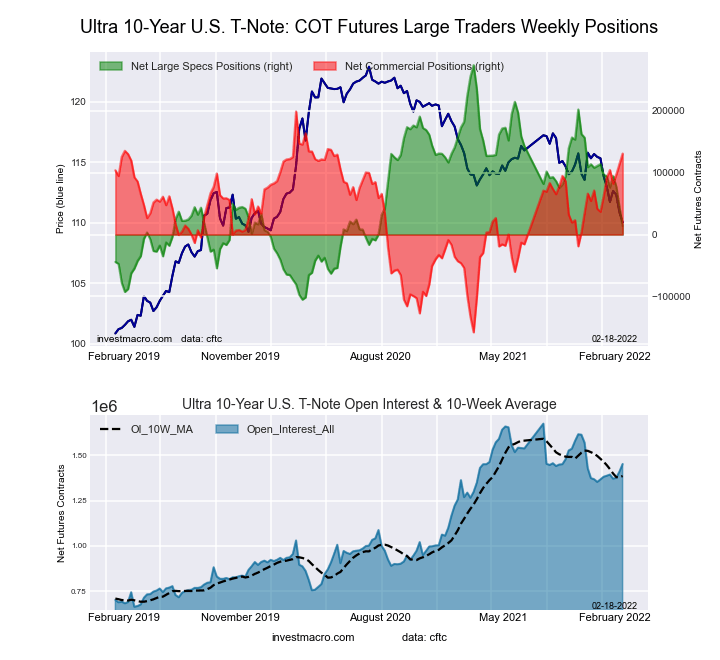
This week’s current strength score (the trader positioning range over the past three years, measured from 0 to 100) shows the speculators are currently Bearish with a score of 31.4 percent. The commercials are Bullish-Extreme with a score of 80.9 percent and the small traders (not shown in chart) are Bearish with a score of 28.4 percent.
| Ultra 10-Year Notes Statistics | SPECULATORS | COMMERCIALS | SMALL TRADERS |
| – Percent of Open Interest Longs: | 14.8 | 73.5 | 8.4 |
| – Percent of Open Interest Shorts: | 13.9 | 64.5 | 18.4 |
| – Net Position: | 13,871 | 130,856 | -144,727 |
| – Gross Longs: | 215,580 | 1,067,199 | 122,654 |
| – Gross Shorts: | 201,709 | 936,343 | 267,381 |
| – Long to Short Ratio: | 1.1 to 1 | 1.1 to 1 | 0.5 to 1 |
| NET POSITION TREND: | |||
| – Strength Index Score (3 Year Range Pct): | 31.4 | 80.9 | 28.4 |
| – Strength Index Reading (3 Year Range): | Bearish | Bullish-Extreme | Bearish |
| NET POSITION MOVEMENT INDEX: | |||
| – 6-Week Change in Strength Index: | -21.8 | 19.4 | 8.0 |
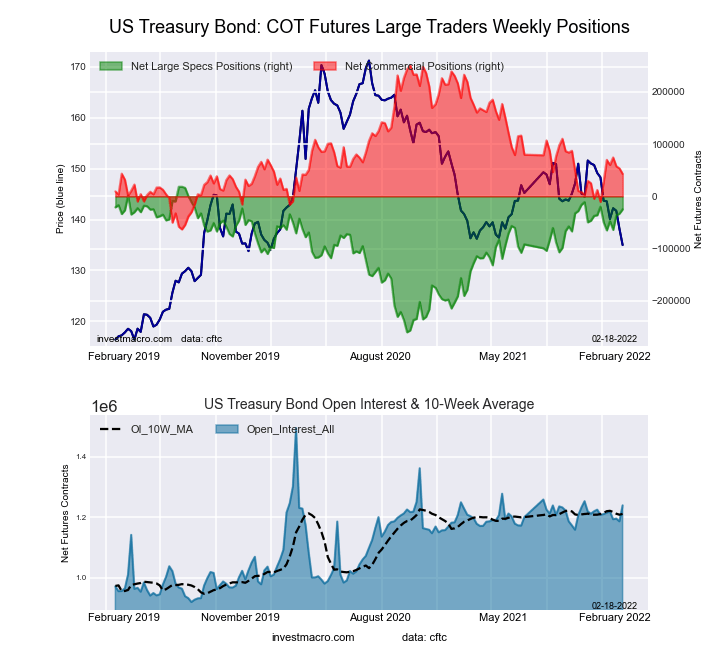
This week’s current strength score (the trader positioning range over the past three years, measured from 0 to 100) shows the speculators are currently Bullish-Extreme with a score of 84.5 percent. The commercials are Bearish with a score of 33.8 percent and the small traders (not shown in chart) are Bearish with a score of 38.2 percent.
| US Treasury Bonds Statistics | SPECULATORS | COMMERCIALS | SMALL TRADERS |
| – Percent of Open Interest Longs: | 10.7 | 72.9 | 13.7 |
| – Percent of Open Interest Shorts: | 12.7 | 69.4 | 15.1 |
| – Net Position: | -24,845 | 42,910 | -18,065 |
| – Gross Longs: | 133,138 | 902,892 | 169,162 |
| – Gross Shorts: | 157,983 | 859,982 | 187,227 |
| – Long to Short Ratio: | 0.8 to 1 | 1.0 to 1 | 0.9 to 1 |
| NET POSITION TREND: | |||
| – Strength Index Score (3 Year Range Pct): | 84.5 | 33.8 | 38.2 |
| – Strength Index Reading (3 Year Range): | Bullish-Extreme | Bearish | Bearish |
| NET POSITION MOVEMENT INDEX: | |||
| – 6-Week Change in Strength Index: | 8.9 | 5.0 | -32.0 |
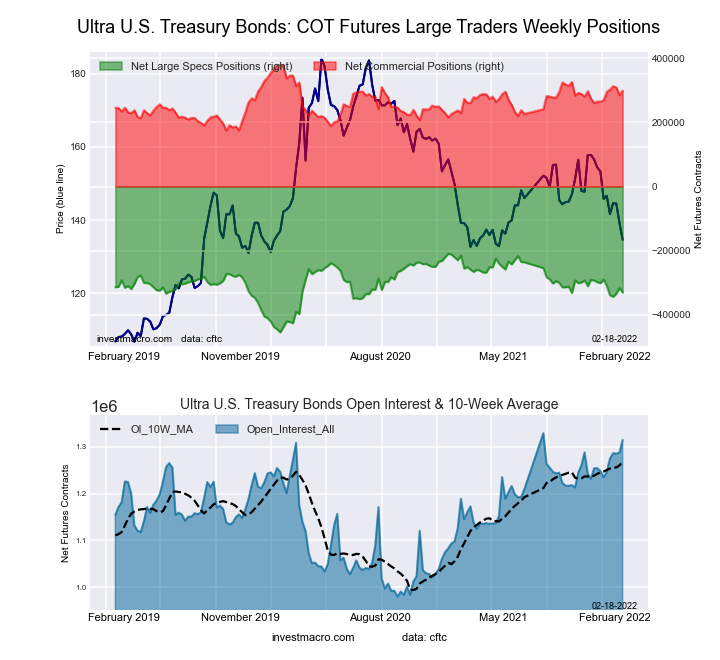
This week’s current strength score (the trader positioning range over the past three years, measured from 0 to 100) shows the speculators are currently Bullish with a score of 50.5 percent. The commercials are Bullish with a score of 61.1 percent and the small traders (not shown in chart) are Bullish with a score of 50.9 percent.
| Ultra US Treasury Bonds Statistics | SPECULATORS | COMMERCIALS | SMALL TRADERS |
| – Percent of Open Interest Longs: | 5.5 | 81.1 | 11.9 |
| – Percent of Open Interest Shorts: | 30.6 | 58.4 | 9.5 |
| – Net Position: | -330,139 | 298,631 | 31,508 |
| – Gross Longs: | 72,504 | 1,065,871 | 156,998 |
| – Gross Shorts: | 402,643 | 767,240 | 125,490 |
| – Long to Short Ratio: | 0.2 to 1 | 1.4 to 1 | 1.3 to 1 |
| NET POSITION TREND: | |||
| – Strength Index Score (3 Year Range Pct): | 50.5 | 61.1 | 50.9 |
| – Strength Index Reading (3 Year Range): | Bullish | Bullish | Bullish |
| NET POSITION MOVEMENT INDEX: | |||
| – 6-Week Change in Strength Index: | -16.5 | 14.6 | 7.7 |
Article By InvestMacro – Receive our weekly COT Reports by Email
*COT Report: The COT data, released weekly to the public each Friday, is updated through the most recent Tuesday (data is 3 days old) and shows a quick view of how large speculators or non-commercials (for-profit traders) were positioned in the futures markets.
The CFTC categorizes trader positions according to commercial hedgers (traders who use futures contracts for hedging as part of the business), non-commercials (large traders who speculate to realize trading profits) and nonreportable traders (usually small traders/speculators) as well as their open interest (contracts open in the market at time of reporting).See CFTC criteria here.
By Jeffrey Young, Georgia Institute of Technology You’ve probably heard artificial intelligence models described as…
Source: Barry Dawes (7/23/26) Barry Dawes of Martin Place Securities shares his analysis of the…
By JustMarkets The US stock indices ended Thursday’s session with a notable decline amid a…
By Analytical Department RoboForex USD/JPY soared to 163.81 on Friday, marking a new 40-year high.…
By JustMarkets The US equities ended Wednesday’s session lower amid investor caution ahead of the…
By Analytical Department RoboForex EUR/USD rose to 1.1429 on Thursday, with the US dollar continuing…
This website uses cookies.