Here are the latest charts and statistics for the Commitment of Traders (COT) data published by the Commodities Futures Trading Commission (CFTC).
The latest COT data is updated through Tuesday November 30th 2021 and shows a quick view of how large traders (for-profit speculators and commercial entities) were positioned in the futures markets.
Highlighting this week’s COT soft commodities data was the strong decrease for many of the soft commodities speculator positions. This week saw speculators cut back on bets for Sugar (-34,631 contracts), Cocoa (-23,422 contracts), Wheat (-23,195 contracts), Corn (-22,177 contracts) and Soybean Meal (-21,150 contracts).
Most of the soft commodities have been seeing strong bullish sentiment on the part of the speculators and this week’s drop marked their largest declines in some time. Corn fell by largest amount in the past twelve weeks while Sugar saw the biggest shortfall of the past six weeks. Wheat speculator bets fell this week by most in the past one-hundred and forty-four weeks, dating back to March of 2019.
The only two soft commodities that saw higher speculator positions this week were live cattle and lean hogs.
| Nov-30-2021 | OI | OI-Index | Spec-Net | Spec-Index | Com-Net | COM-Index | Smalls-Net | Smalls-Index |
|---|---|---|---|---|---|---|---|---|
| WTI Crude | 2,033,286 | 14 | 387,234 | 35 | -432,885 | 53 | 45,651 | 79 |
| Gold | 531,868 | 33 | 225,860 | 60 | -258,603 | 39 | 32,743 | 57 |
| Silver | 138,003 | 5 | 38,434 | 61 | -52,009 | 48 | 13,575 | 19 |
| Copper | 184,214 | 15 | 9,191 | 49 | -15,763 | 49 | 6,572 | 63 |
| Palladium | 9,621 | 14 | -2,973 | 2 | 3,277 | 98 | -304 | 27 |
| Platinum | 62,385 | 26 | 8,948 | 15 | -14,696 | 88 | 5,748 | 42 |
| Natural Gas | 1,269,879 | 36 | -132,678 | 39 | 93,560 | 60 | 39,118 | 78 |
| Brent | 217,781 | 53 | -15,494 | 93 | 12,212 | 8 | 3,282 | 54 |
| Heating Oil | 298,300 | 0 | 11,225 | 59 | -26,834 | 43 | 15,609 | 52 |
| Soybeans | 671,433 | 15 | 55,317 | 44 | -16,980 | 62 | -38,337 | 8 |
| Corn | 1,405,105 | 5 | 394,912 | 80 | -341,094 | 23 | -53,818 | 12 |
| Coffee | 266,001 | 33 | 66,025 | 97 | -69,144 | 6 | 3,119 | 10 |
| Sugar | 882,199 | 15 | 214,995 | 81 | -242,927 | 22 | 27,932 | 42 |
| Wheat | 371,575 | 19 | 18,294 | 63 | -10,430 | 31 | -7,864 | 64 |
Free Reports:
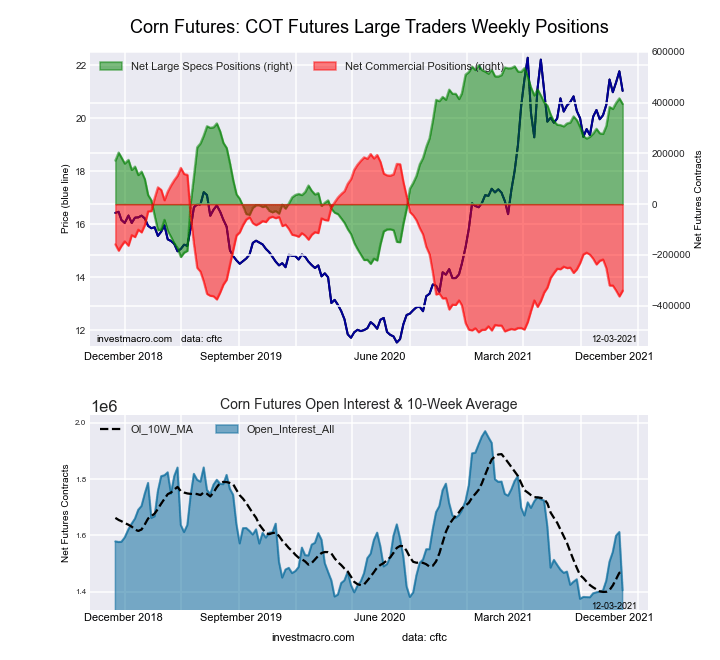
This week’s current strength score (the trader positioning range over the past three years, measured from 0 to 100) shows the speculators are currently Bullish-Extreme with a score of 80.5 percent. The commercials are Bearish with a score of 23.3 percent and the small traders (not shown in chart) are Bearish-Extreme with a score of 12.1 percent.
| CORN Futures Statistics | SPECULATORS | COMMERCIALS | SMALL TRADERS |
| – Percent of Open Interest Longs: | 33.8 | 46.1 | 8.8 |
| – Percent of Open Interest Shorts: | 5.7 | 70.4 | 12.6 |
| – Net Position: | 394,912 | -341,094 | -53,818 |
| – Gross Longs: | 474,354 | 647,620 | 123,204 |
| – Gross Shorts: | 79,442 | 988,714 | 177,022 |
| – Long to Short Ratio: | 6.0 to 1 | 0.7 to 1 | 0.7 to 1 |
| NET POSITION TREND: | |||
| – COT Index Score (3 Year Range Pct): | 80.5 | 23.3 | 12.1 |
| – COT Index Reading (3 Year Range): | Bullish-Extreme | Bearish | Bearish-Extreme |
| NET POSITION MOVEMENT INDEX: | |||
| – 6-Week Change in Strength Index: | 15.1 | -17.5 | 2.9 |
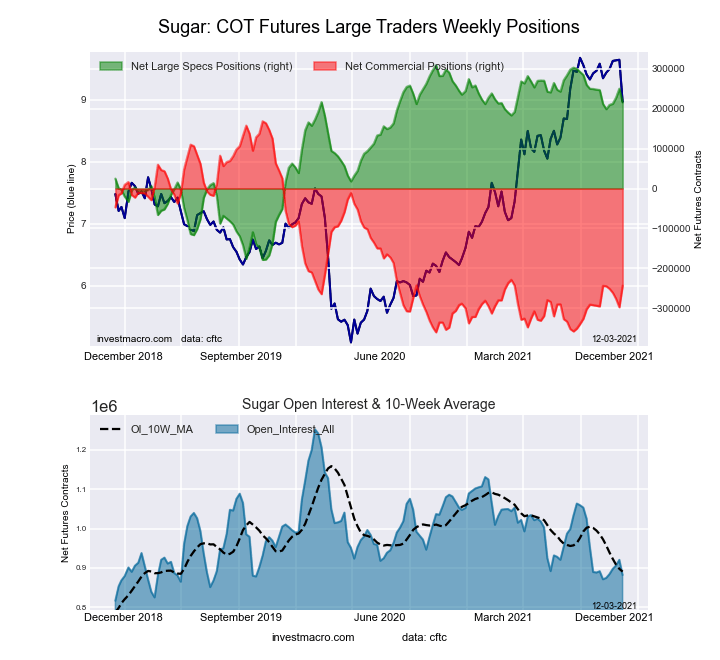
This week’s current strength score (the trader positioning range over the past three years, measured from 0 to 100) shows the speculators are currently Bullish-Extreme with a score of 80.8 percent. The commercials are Bearish with a score of 22.1 percent and the small traders (not shown in chart) are Bearish with a score of 42.4 percent.
| SUGAR Futures Statistics | SPECULATORS | COMMERCIALS | SMALL TRADERS |
| – Percent of Open Interest Longs: | 31.1 | 45.6 | 9.2 |
| – Percent of Open Interest Shorts: | 6.7 | 73.1 | 6.0 |
| – Net Position: | 214,995 | -242,927 | 27,932 |
| – Gross Longs: | 274,020 | 402,372 | 81,292 |
| – Gross Shorts: | 59,025 | 645,299 | 53,360 |
| – Long to Short Ratio: | 4.6 to 1 | 0.6 to 1 | 1.5 to 1 |
| NET POSITION TREND: | |||
| – COT Index Score (3 Year Range Pct): | 80.8 | 22.1 | 42.4 |
| – COT Index Reading (3 Year Range): | Bullish-Extreme | Bearish | Bearish |
| NET POSITION MOVEMENT INDEX: | |||
| – 6-Week Change in Strength Index: | 0.7 | 0.1 | -5.0 |
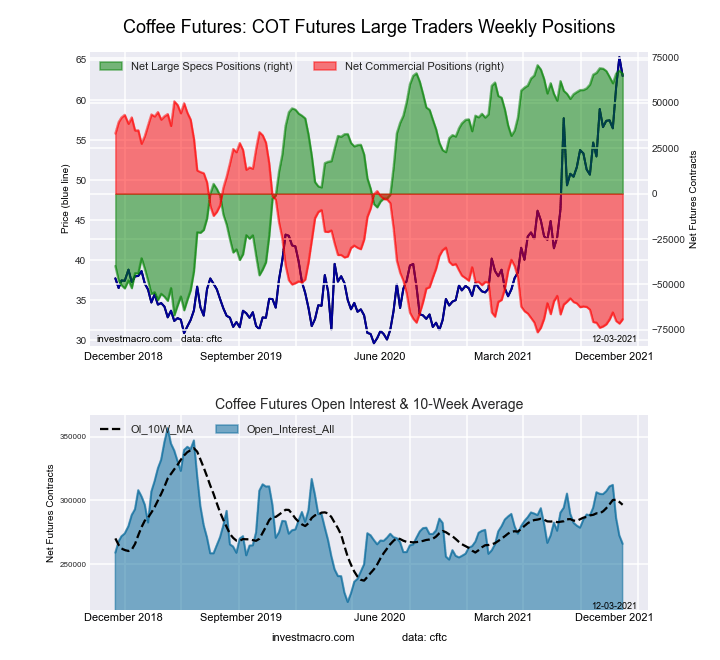
This week’s current strength score (the trader positioning range over the past three years, measured from 0 to 100) shows the speculators are currently Bullish-Extreme with a score of 96.6 percent. The commercials are Bearish-Extreme with a score of 5.6 percent and the small traders (not shown in chart) are Bearish-Extreme with a score of 9.9 percent.
| COFFEE Futures Statistics | SPECULATORS | COMMERCIALS | SMALL TRADERS |
| – Percent of Open Interest Longs: | 29.8 | 45.2 | 3.8 |
| – Percent of Open Interest Shorts: | 5.0 | 71.2 | 2.6 |
| – Net Position: | 66,025 | -69,144 | 3,119 |
| – Gross Longs: | 79,225 | 120,230 | 9,983 |
| – Gross Shorts: | 13,200 | 189,374 | 6,864 |
| – Long to Short Ratio: | 6.0 to 1 | 0.6 to 1 | 1.5 to 1 |
| NET POSITION TREND: | |||
| – COT Index Score (3 Year Range Pct): | 96.6 | 5.6 | 9.9 |
| – COT Index Reading (3 Year Range): | Bullish-Extreme | Bearish-Extreme | Bearish-Extreme |
| NET POSITION MOVEMENT INDEX: | |||
| – 6-Week Change in Strength Index: | -2.1 | 3.1 | -7.6 |
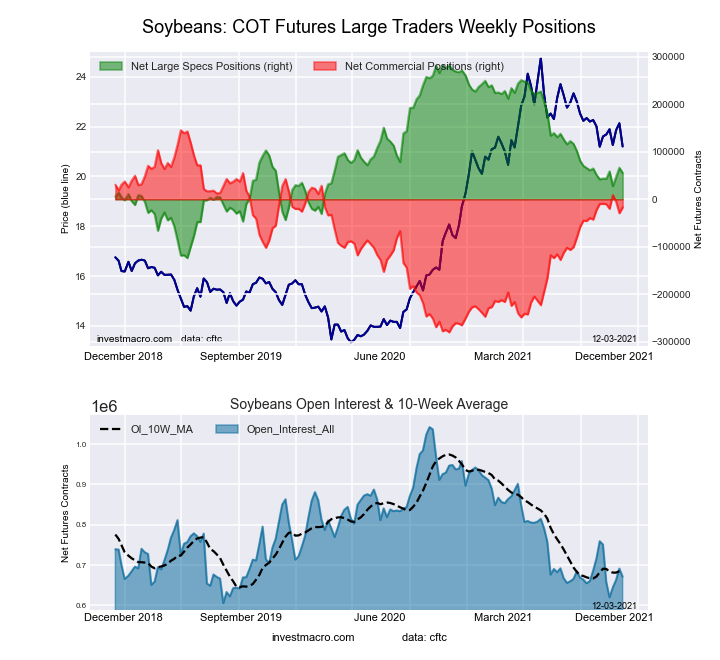
This week’s current strength score (the trader positioning range over the past three years, measured from 0 to 100) shows the speculators are currently Bearish with a score of 44.1 percent. The commercials are Bullish with a score of 61.8 percent and the small traders (not shown in chart) are Bearish-Extreme with a score of 8.1 percent.
| SOYBEANS Futures Statistics | SPECULATORS | COMMERCIALS | SMALL TRADERS |
| – Percent of Open Interest Longs: | 19.3 | 58.5 | 6.8 |
| – Percent of Open Interest Shorts: | 11.1 | 61.0 | 12.5 |
| – Net Position: | 55,317 | -16,980 | -38,337 |
| – Gross Longs: | 129,653 | 392,778 | 45,663 |
| – Gross Shorts: | 74,336 | 409,758 | 84,000 |
| – Long to Short Ratio: | 1.7 to 1 | 1.0 to 1 | 0.5 to 1 |
| NET POSITION TREND: | |||
| – COT Index Score (3 Year Range Pct): | 44.1 | 61.8 | 8.1 |
| – COT Index Reading (3 Year Range): | Bearish | Bullish | Bearish-Extreme |
| NET POSITION MOVEMENT INDEX: | |||
| – 6-Week Change in Strength Index: | 2.9 | -1.7 | -7.3 |
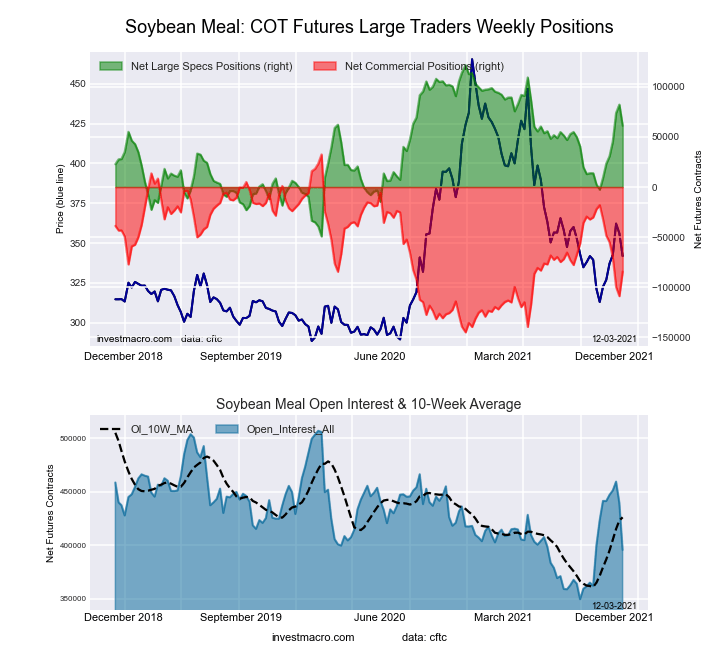
This week’s current strength score (the trader positioning range over the past three years, measured from 0 to 100) shows the speculators are currently Bullish with a score of 64.6 percent. The commercials are Bearish with a score of 34.1 percent and the small traders (not shown in chart) are Bullish with a score of 63.9 percent.
| SOYBEAN MEAL Futures Statistics | SPECULATORS | COMMERCIALS | SMALL TRADERS |
| – Percent of Open Interest Longs: | 22.3 | 48.7 | 12.1 |
| – Percent of Open Interest Shorts: | 6.9 | 70.0 | 6.2 |
| – Net Position: | 61,121 | -84,386 | 23,265 |
| – Gross Longs: | 88,336 | 192,665 | 47,820 |
| – Gross Shorts: | 27,215 | 277,051 | 24,555 |
| – Long to Short Ratio: | 3.2 to 1 | 0.7 to 1 | 1.9 to 1 |
| NET POSITION TREND: | |||
| – COT Index Score (3 Year Range Pct): | 64.6 | 34.1 | 63.9 |
| – COT Index Reading (3 Year Range): | Bullish | Bearish | Bullish |
| NET POSITION MOVEMENT INDEX: | |||
| – 6-Week Change in Strength Index: | 30.4 | -29.4 | 0.8 |
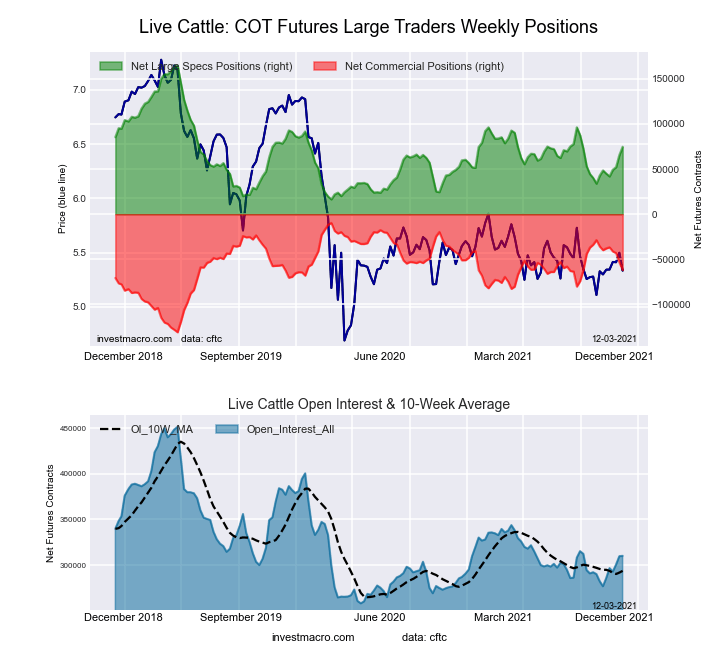
This week’s current strength score (the trader positioning range over the past three years, measured from 0 to 100) shows the speculators are currently Bearish with a score of 39.1 percent. The commercials are Bullish with a score of 57.0 percent and the small traders (not shown in chart) are Bullish with a score of 55.8 percent.
| LIVE CATTLE Futures Statistics | SPECULATORS | COMMERCIALS | SMALL TRADERS |
| – Percent of Open Interest Longs: | 39.1 | 38.0 | 9.0 |
| – Percent of Open Interest Shorts: | 15.0 | 57.9 | 13.1 |
| – Net Position: | 74,654 | -61,828 | -12,826 |
| – Gross Longs: | 121,310 | 117,809 | 27,865 |
| – Gross Shorts: | 46,656 | 179,637 | 40,691 |
| – Long to Short Ratio: | 2.6 to 1 | 0.7 to 1 | 0.7 to 1 |
| NET POSITION TREND: | |||
| – COT Index Score (3 Year Range Pct): | 39.1 | 57.0 | 55.8 |
| – COT Index Reading (3 Year Range): | Bearish | Bullish | Bullish |
| NET POSITION MOVEMENT INDEX: | |||
| – 6-Week Change in Strength Index: | 17.6 | -18.2 | -10.2 |
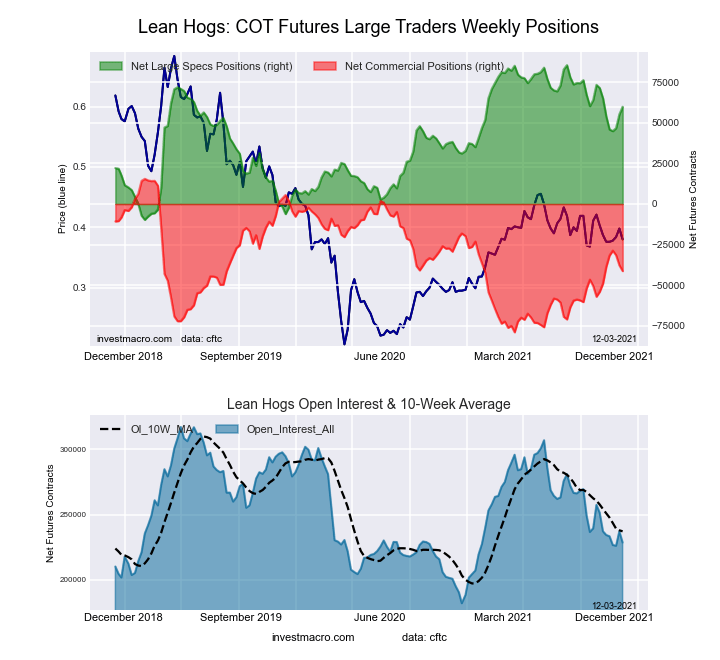
This week’s current strength score (the trader positioning range over the past three years, measured from 0 to 100) shows the speculators are currently Bullish with a score of 73.1 percent. The commercials are Bearish with a score of 39.9 percent and the small traders (not shown in chart) are Bearish-Extreme with a score of 0.0 percent.
| LEAN HOGS Futures Statistics | SPECULATORS | COMMERCIALS | SMALL TRADERS |
| – Percent of Open Interest Longs: | 42.9 | 32.8 | 6.7 |
| – Percent of Open Interest Shorts: | 16.7 | 50.9 | 14.8 |
| – Net Position: | 59,949 | -41,359 | -18,590 |
| – Gross Longs: | 98,149 | 75,048 | 15,217 |
| – Gross Shorts: | 38,200 | 116,407 | 33,807 |
| – Long to Short Ratio: | 2.6 to 1 | 0.6 to 1 | 0.5 to 1 |
| NET POSITION TREND: | |||
| – COT Index Score (3 Year Range Pct): | 73.1 | 39.9 | 0.0 |
| – COT Index Reading (3 Year Range): | Bullish | Bearish | Bearish-Extreme |
| NET POSITION MOVEMENT INDEX: | |||
| – 6-Week Change in Strength Index: | -5.5 | 8.1 | -10.6 |
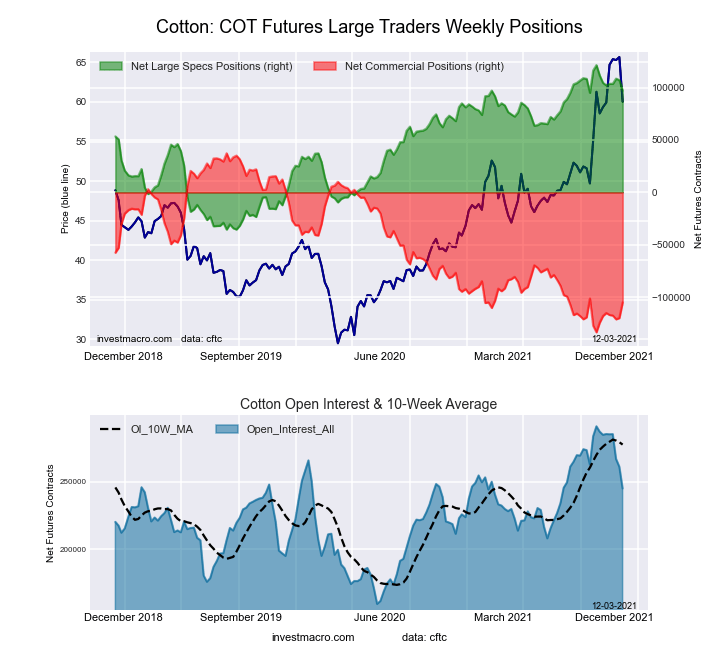
This week’s current strength score (the trader positioning range over the past three years, measured from 0 to 100) shows the speculators are currently Bullish-Extreme with a score of 84.5 percent. The commercials are Bearish-Extreme with a score of 16.7 percent and the small traders (not shown in chart) are Bullish with a score of 62.8 percent.
| COTTON Futures Statistics | SPECULATORS | COMMERCIALS | SMALL TRADERS |
| – Percent of Open Interest Longs: | 45.4 | 36.6 | 6.5 |
| – Percent of Open Interest Shorts: | 5.8 | 79.4 | 3.3 |
| – Net Position: | 96,995 | -104,883 | 7,888 |
| – Gross Longs: | 111,082 | 89,513 | 15,879 |
| – Gross Shorts: | 14,087 | 194,396 | 7,991 |
| – Long to Short Ratio: | 7.9 to 1 | 0.5 to 1 | 2.0 to 1 |
| NET POSITION TREND: | |||
| – COT Index Score (3 Year Range Pct): | 84.5 | 16.7 | 62.8 |
| – COT Index Reading (3 Year Range): | Bullish-Extreme | Bearish-Extreme | Bullish |
| NET POSITION MOVEMENT INDEX: | |||
| – 6-Week Change in Strength Index: | -4.7 | 7.6 | -34.1 |
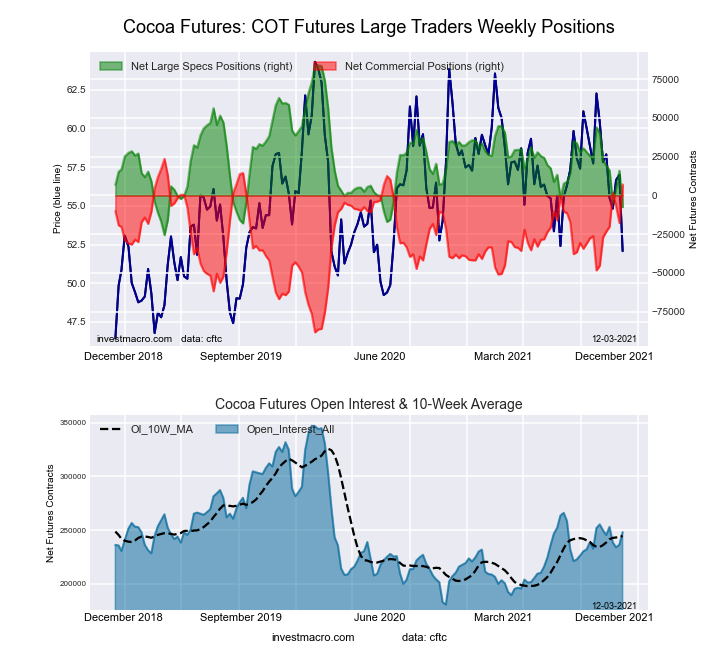
This week’s current strength score (the trader positioning range over the past three years, measured from 0 to 100) shows the speculators are currently Bearish-Extreme with a score of 16.5 percent. The commercials are Bullish-Extreme with a score of 85.3 percent and the small traders (not shown in chart) are Bearish-Extreme with a score of 12.5 percent.
| COCOA Futures Statistics | SPECULATORS | COMMERCIALS | SMALL TRADERS |
| – Percent of Open Interest Longs: | 25.0 | 55.0 | 4.7 |
| – Percent of Open Interest Shorts: | 28.1 | 52.1 | 4.5 |
| – Net Position: | -7,497 | 7,141 | 356 |
| – Gross Longs: | 62,102 | 136,428 | 11,601 |
| – Gross Shorts: | 69,599 | 129,287 | 11,245 |
| – Long to Short Ratio: | 0.9 to 1 | 1.1 to 1 | 1.0 to 1 |
| NET POSITION TREND: | |||
| – COT Index Score (3 Year Range Pct): | 16.5 | 85.3 | 12.5 |
| – COT Index Reading (3 Year Range): | Bearish-Extreme | Bullish-Extreme | Bearish-Extreme |
| NET POSITION MOVEMENT INDEX: | |||
| – 6-Week Change in Strength Index: | -27.7 | 30.6 | -44.4 |
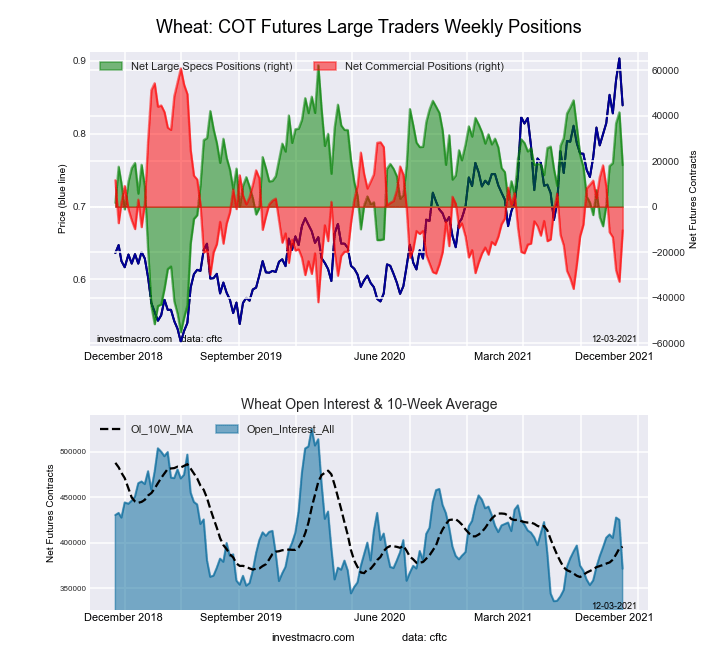
This week’s current strength score (the trader positioning range over the past three years, measured from 0 to 100) shows the speculators are currently Bullish with a score of 62.6 percent. The commercials are Bearish with a score of 30.7 percent and the small traders (not shown in chart) are Bullish with a score of 64.0 percent.
| WHEAT Futures Statistics | SPECULATORS | COMMERCIALS | SMALL TRADERS |
| – Percent of Open Interest Longs: | 31.2 | 35.5 | 8.5 |
| – Percent of Open Interest Shorts: | 26.3 | 38.3 | 10.6 |
| – Net Position: | 18,294 | -10,430 | -7,864 |
| – Gross Longs: | 115,857 | 132,061 | 31,535 |
| – Gross Shorts: | 97,563 | 142,491 | 39,399 |
| – Long to Short Ratio: | 1.2 to 1 | 0.9 to 1 | 0.8 to 1 |
| NET POSITION TREND: | |||
| – COT Index Score (3 Year Range Pct): | 62.6 | 30.7 | 64.0 |
| – COT Index Reading (3 Year Range): | Bullish | Bearish | Bullish |
| NET POSITION MOVEMENT INDEX: | |||
| – 6-Week Change in Strength Index: | 22.9 | -27.9 | 8.4 |
Article By InvestMacro – Receive our weekly COT Reports by Email
*COT Report: The COT data, released weekly to the public each Friday, is updated through the most recent Tuesday (data is 3 days old) and shows a quick view of how large speculators or non-commercials (for-profit traders) were positioned in the futures markets.
The CFTC categorizes trader positions according to commercial hedgers (traders who use futures contracts for hedging as part of the business), non-commercials (large traders who speculate to realize trading profits) and nonreportable traders (usually small traders/speculators) as well as their open interest (contracts open in the market at time of reporting).See CFTC criteria here.
By Analytical Department RoboForex Gold fell to 4,033 USD per ounce on Thursday, extending its…
By JustMarkets By the end of the day, the Dow Jones Index (US30) rose by…
By JustMarkets On Tuesday, the US stock indices finished the session in the green, supported…
By Analytical Department RoboForex GBP/USD rose to 1.3403 on Wednesday, with British politics taking centre…
By Analytical Department RoboForex USD/JPY ended Tuesday at 162.27, with the Japanese yen remaining near…
By JustMarkets On Friday, the Dow Jones Index (US30) rose by 0.29% (weekly: -0.36%). The…
This website uses cookies.