Here are the latest charts and statistics for the Commitment of Traders (COT) data published by the Commodities Futures Trading Commission (CFTC).
The latest COT data is updated through Tuesday November 30th 2021 and shows a quick view of how large traders (for-profit speculators and commercial entities) were positioned in the futures markets.
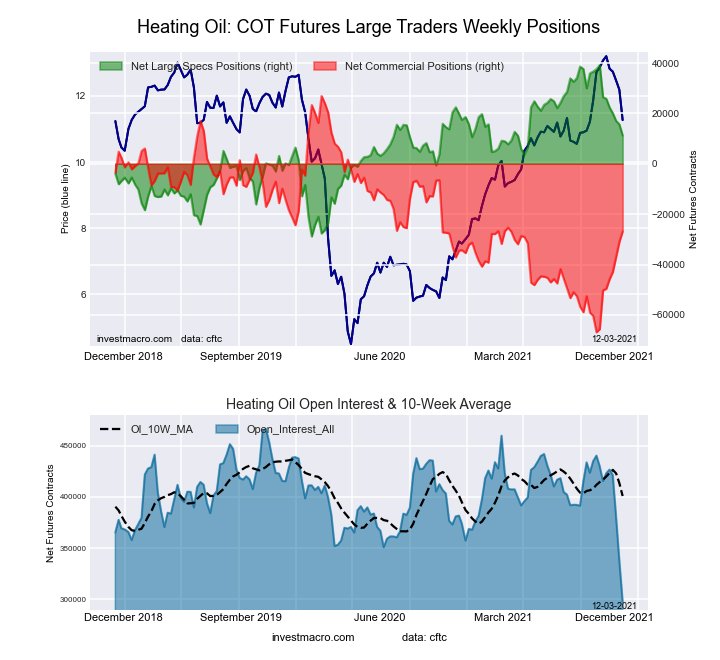
Highlighting this week’s COT energy data is the heating oil speculator bets that fell for a seventh consecutive week. Speculator positions in heating oil have fallen by a total of -27,912 contracts over these past seven weeks and have declined sharply since reaching a multi-year bullish high in October. The heating oil speculator positioning has been bullish throughout the year and climbed to the multi-year high on October 12th with a total of 39,137 contracts. This was the most bullish standing in the past one hundred and fifty-six weeks, dating back all the way to October 16th of 2018. Since then, heating oil bets have streaked lower to the least bullish speculative level since May 11th at a total of just 11,225 contracts.
| Nov-30-2021 | OI | OI-Index | Spec-Net | Spec-Index | Com-Net | COM-Index | Smalls-Net | Smalls-Index |
|---|---|---|---|---|---|---|---|---|
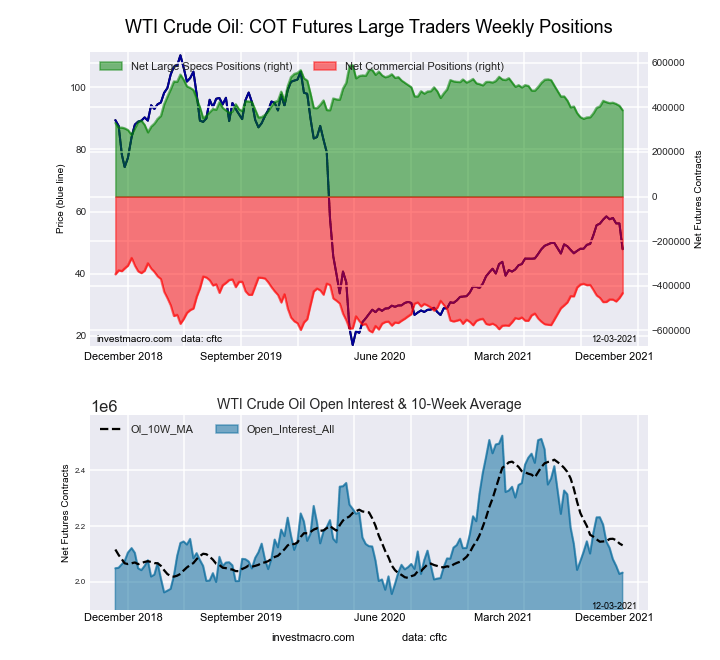
| WTI Crude | 2,033,286 | 14 | 387,234 | 35 | -432,885 | 53 | 45,651 | 79 |
| Gold | 531,868 | 33 | 225,860 | 60 | -258,603 | 39 | 32,743 | 57 |
| Silver | 138,003 | 5 | 38,434 | 61 | -52,009 | 48 | 13,575 | 19 |
| Copper | 184,214 | 15 | 9,191 | 49 | -15,763 | 49 | 6,572 | 63 |
| Palladium | 9,621 | 14 | -2,973 | 2 | 3,277 | 98 | -304 | 27 |
| Platinum | 62,385 | 26 | 8,948 | 15 | -14,696 | 88 | 5,748 | 42 |
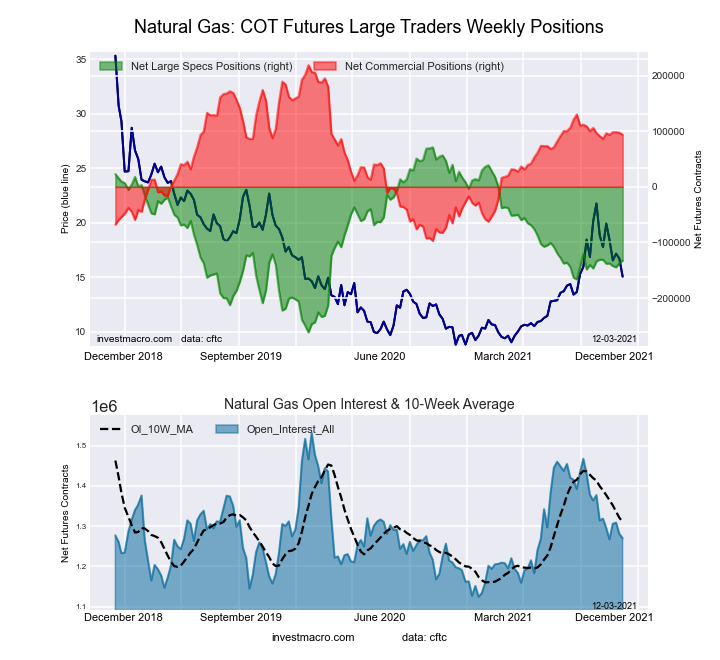
| Natural Gas | 1,269,879 | 36 | -132,678 | 39 | 93,560 | 60 | 39,118 | 78 |
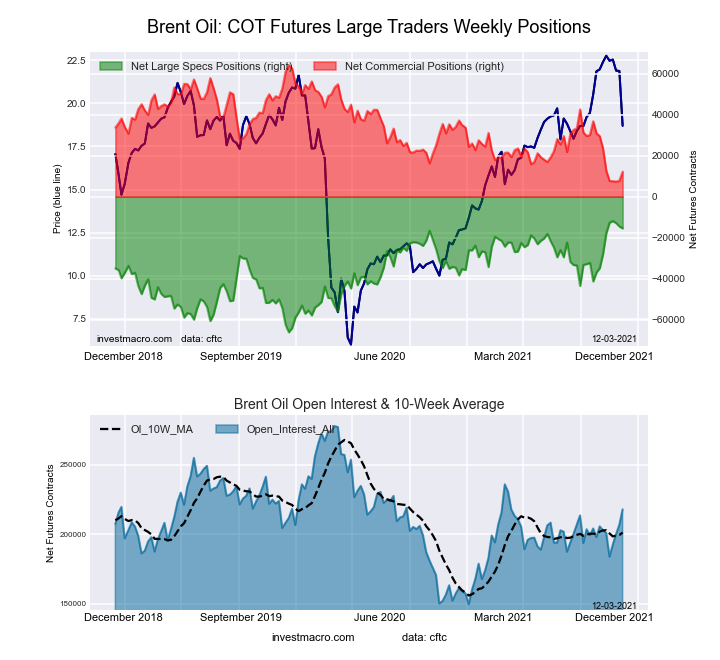
| Brent | 217,781 | 53 | -15,494 | 93 | 12,212 | 8 | 3,282 | 54 |
| Heating Oil | 298,300 | 0 | 11,225 | 59 | -26,834 | 43 | 15,609 | 52 |
| Soybeans | 671,433 | 15 | 55,317 | 44 | -16,980 | 62 | -38,337 | 8 |
| Corn | 1,405,105 | 5 | 394,912 | 80 | -341,094 | 23 | -53,818 | 12 |
| Coffee | 266,001 | 33 | 66,025 | 97 | -69,144 | 6 | 3,119 | 10 |
| Sugar | 882,199 | 15 | 214,995 | 81 | -242,927 | 22 | 27,932 | 42 |
| Wheat | 371,575 | 19 | 18,294 | 63 | -10,430 | 31 | -7,864 | 64 |
This week’s current strength score (the trader positioning range over the past three years, measured from 0 to 100) shows the speculators are currently Bearish with a score of 35.2 percent. The commercials are Bullish with a score of 52.7 percent and the small traders (not shown in chart) are Bullish with a score of 79.4 percent.
Free Reports:
| WTI Crude Oil Futures Statistics | SPECULATORS | COMMERCIALS | SMALL TRADERS |
| – Percent of Open Interest Longs: | 25.2 | 34.9 | 5.6 |
| – Percent of Open Interest Shorts: | 6.1 | 56.2 | 3.4 |
| – Net Position: | 387,234 | -432,885 | 45,651 |
| – Gross Longs: | 511,862 | 710,000 | 114,548 |
| – Gross Shorts: | 124,628 | 1,142,885 | 68,897 |
| – Long to Short Ratio: | 4.1 to 1 | 0.6 to 1 | 1.7 to 1 |
| NET POSITION TREND: | |||
| – COT Index Score (3 Year Range Pct): | 35.2 | 52.7 | 79.4 |
| – COT Index Reading (3 Year Range): | Bearish | Bullish | Bullish |
| NET POSITION MOVEMENT INDEX: | |||
| – 6-Week Change in Strength Index: | -13.6 | 12.1 | 2.9 |
This week’s current strength score (the trader positioning range over the past three years, measured from 0 to 100) shows the speculators are currently Bullish-Extreme with a score of 93.3 percent. The commercials are Bearish-Extreme with a score of 8.5 percent and the small traders (not shown in chart) are Bullish with a score of 53.7 percent.
| Brent Crude Oil Futures Statistics | SPECULATORS | COMMERCIALS | SMALL TRADERS |
| – Percent of Open Interest Longs: | 20.3 | 43.3 | 3.5 |
| – Percent of Open Interest Shorts: | 27.4 | 37.7 | 2.0 |
| – Net Position: | -15,494 | 12,212 | 3,282 |
| – Gross Longs: | 44,183 | 94,392 | 7,626 |
| – Gross Shorts: | 59,677 | 82,180 | 4,344 |
| – Long to Short Ratio: | 0.7 to 1 | 1.1 to 1 | 1.8 to 1 |
| NET POSITION TREND: | |||
| – COT Index Score (3 Year Range Pct): | 93.3 | 8.5 | 53.7 |
| – COT Index Reading (3 Year Range): | Bullish-Extreme | Bearish-Extreme | Bullish |
| NET POSITION MOVEMENT INDEX: | |||
| – 6-Week Change in Strength Index: | 23.0 | -19.7 | -17.9 |
This week’s current strength score (the trader positioning range over the past three years, measured from 0 to 100) shows the speculators are currently Bearish with a score of 38.8 percent. The commercials are Bullish with a score of 60.4 percent and the small traders (not shown in chart) are Bullish with a score of 78.0 percent.
| Natural Gas Futures Statistics | SPECULATORS | COMMERCIALS | SMALL TRADERS |
| – Percent of Open Interest Longs: | 19.4 | 43.2 | 4.8 |
| – Percent of Open Interest Shorts: | 29.9 | 35.8 | 1.7 |
| – Net Position: | -132,678 | 93,560 | 39,118 |
| – Gross Longs: | 246,559 | 548,661 | 60,357 |
| – Gross Shorts: | 379,237 | 455,101 | 21,239 |
| – Long to Short Ratio: | 0.7 to 1 | 1.2 to 1 | 2.8 to 1 |
| NET POSITION TREND: | |||
| – COT Index Score (3 Year Range Pct): | 38.8 | 60.4 | 78.0 |
| – COT Index Reading (3 Year Range): | Bearish | Bullish | Bullish |
| NET POSITION MOVEMENT INDEX: | |||
| – 6-Week Change in Strength Index: | -0.5 | 2.2 | -13.6 |
This week’s current strength score (the trader positioning range over the past three years, measured from 0 to 100) shows the speculators are currently Bearish-Extreme with a score of 16.5 percent. The commercials are Bullish-Extreme with a score of 86.9 percent and the small traders (not shown in chart) are Bearish with a score of 38.7 percent.
| Nasdaq Mini Futures Statistics | SPECULATORS | COMMERCIALS | SMALL TRADERS |
| – Percent of Open Interest Longs: | 32.5 | 46.9 | 6.4 |
| – Percent of Open Interest Shorts: | 16.5 | 64.5 | 4.8 |
| – Net Position: | 45,614 | -50,163 | 4,549 |
| – Gross Longs: | 92,808 | 133,858 | 18,336 |
| – Gross Shorts: | 47,194 | 184,021 | 13,787 |
| – Long to Short Ratio: | 2.0 to 1 | 0.7 to 1 | 1.3 to 1 |
| NET POSITION TREND: | |||
| – COT Index Score (3 Year Range Pct): | 16.5 | 86.9 | 38.7 |
| – COT Index Reading (3 Year Range): | Bearish-Extreme | Bullish-Extreme | Bearish |
| NET POSITION MOVEMENT INDEX: | |||
| – 6-Week Change in Strength Index: | -3.1 | 7.9 | -28.9 |
This week’s current strength score (the trader positioning range over the past three years, measured from 0 to 100) shows the speculators are currently Bullish with a score of 58.9 percent. The commercials are Bearish with a score of 42.7 percent and the small traders (not shown in chart) are Bullish with a score of 52.4 percent.
| Heating Oil Futures Statistics | SPECULATORS | COMMERCIALS | SMALL TRADERS |
| – Percent of Open Interest Longs: | 14.0 | 49.1 | 13.5 |
| – Percent of Open Interest Shorts: | 10.3 | 58.1 | 8.3 |
| – Net Position: | 11,225 | -26,834 | 15,609 |
| – Gross Longs: | 41,864 | 146,392 | 40,262 |
| – Gross Shorts: | 30,639 | 173,226 | 24,653 |
| – Long to Short Ratio: | 1.4 to 1 | 0.8 to 1 | 1.6 to 1 |
| NET POSITION TREND: | |||
| – COT Index Score (3 Year Range Pct): | 58.9 | 42.7 | 52.4 |
| – COT Index Reading (3 Year Range): | Bullish | Bearish | Bullish |
| NET POSITION MOVEMENT INDEX: | |||
| – 6-Week Change in Strength Index: | -22.4 | 25.0 | -28.4 |
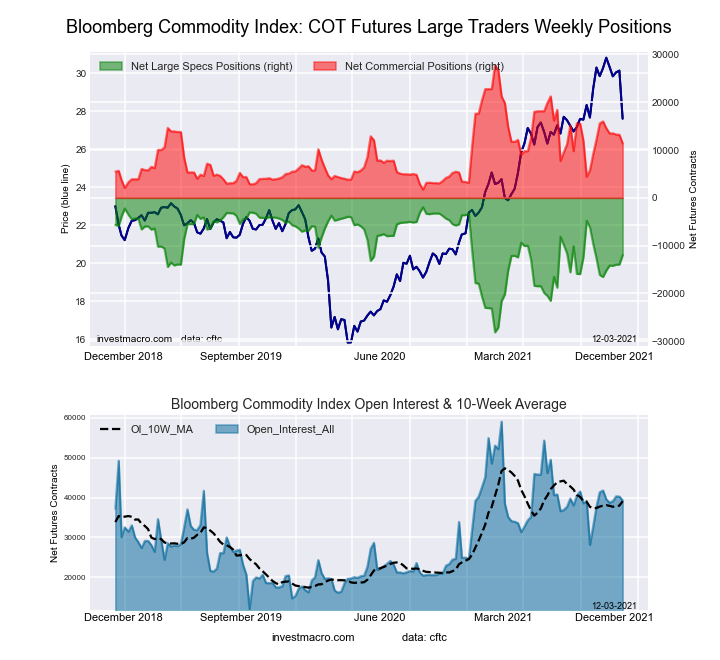
This week’s current strength score (the trader positioning range over the past three years, measured from 0 to 100) shows the speculators are currently Bullish with a score of 61.8 percent. The commercials are Bearish with a score of 37.1 percent and the small traders (not shown in chart) are Bearish with a score of 49.3 percent.
| Bloomberg Index Futures Statistics | SPECULATORS | COMMERCIALS | SMALL TRADERS |
| – Percent of Open Interest Longs: | 60.9 | 34.1 | 1.6 |
| – Percent of Open Interest Shorts: | 91.3 | 5.1 | 0.2 |
| – Net Position: | -11,948 | 11,380 | 568 |
| – Gross Longs: | 23,942 | 13,396 | 627 |
| – Gross Shorts: | 35,890 | 2,016 | 59 |
| – Long to Short Ratio: | 0.7 to 1 | 6.6 to 1 | 10.6 to 1 |
| NET POSITION TREND: | |||
| – COT Index Score (3 Year Range Pct): | 61.8 | 37.1 | 49.3 |
| – COT Index Reading (3 Year Range): | Bullish | Bearish | Bearish |
| NET POSITION MOVEMENT INDEX: | |||
| – 6-Week Change in Strength Index: | 17.5 | -17.7 | 1.5 |
Article By InvestMacro – Receive our weekly COT Reports by Email
*COT Report: The COT data, released weekly to the public each Friday, is updated through the most recent Tuesday (data is 3 days old) and shows a quick view of how large speculators or non-commercials (for-profit traders) were positioned in the futures markets.
The CFTC categorizes trader positions according to commercial hedgers (traders who use futures contracts for hedging as part of the business), non-commercials (large traders who speculate to realize trading profits) and nonreportable traders (usually small traders/speculators) as well as their open interest (contracts open in the market at time of reporting).See CFTC criteria here.
By InvestMacro Here are the latest charts and statistics for the Commitment of Traders (COT)…
By InvestMacro The latest update for the weekly Commitment of Traders (COT) report was released…
By InvestMacro Here are the latest charts and statistics for the Commitment of Traders (COT)…
By InvestMacro Here are the latest charts and statistics for the Commitment of Traders (COT)…
By InvestMacro Here are the latest charts and statistics for the Commitment of Traders (COT)…
By InvestMacro Here are the latest charts and statistics for the Commitment of Traders (COT)…
This website uses cookies.