By InvestMacro.com COT Home | Data Tables | Data Downloads | Newsletter
Here are the latest charts and statistics for the Commitment of Traders (COT) data published by the Commodities Futures Trading Commission (CFTC).
The latest COT data is updated through Tuesday October 12th 2021 and shows a quick view of how large traders (for-profit speculators and commercial entities) were positioned in the futures markets.
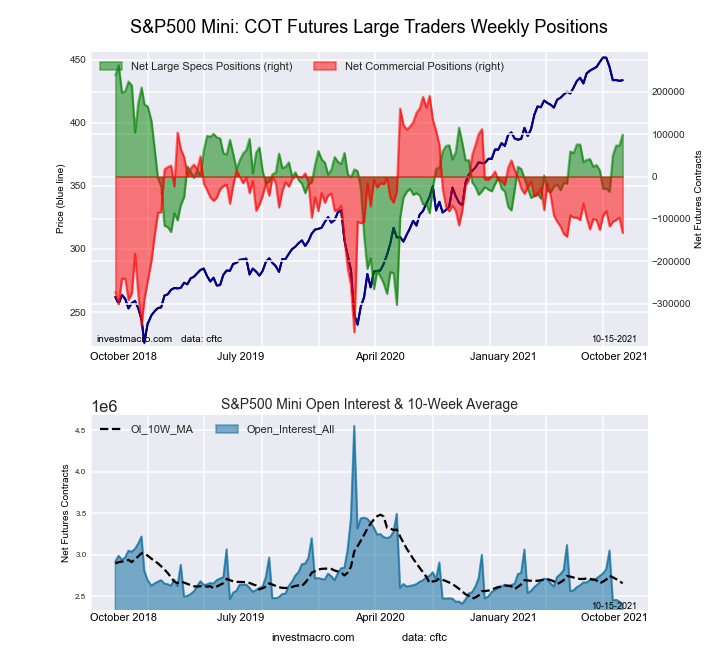
Highlighting this week’s stock market COT data is the S&P500 Mini contracts which rose sharply this week by 25,999 contracts. The S&P500 Mini bets have now gained for three out of the past four weeks and by a total of +134,625 contracts over that time-frame. This has brought the speculator level out of a negative position on September 14th to the current speculator position at a total of 98,783 contracts. The current standing marks the highest level since October 27th of 2020 when the total contracts reached 115,439 net positions.
| Oct-12-2021 | OI | OI-Index | Spec-Net | Spec-Index | Com-Net | COM-Index | Smalls-Net | Smalls-Index |
|---|---|---|---|---|---|---|---|---|
| S&P500-Mini | 2,403,163 | 0 | 98,783 | 71 | -133,167 | 42 | 34,384 | 34 |
| Nikkei 225 | 17,548 | 9 | 1,194 | 57 | -2,536 | 45 | 1,342 | 44 |
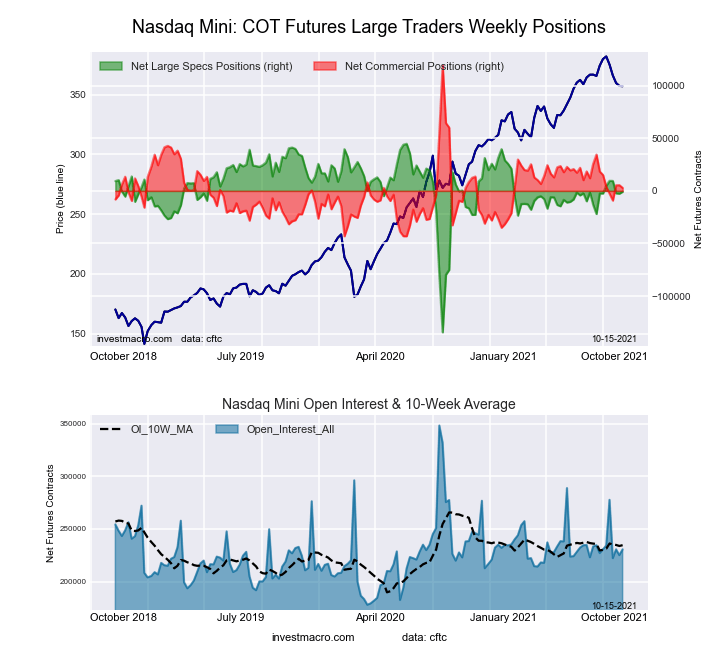
| Nasdaq-Mini | 230,615 | 31 | -818 | 75 | 2,876 | 28 | -2,058 | 39 |
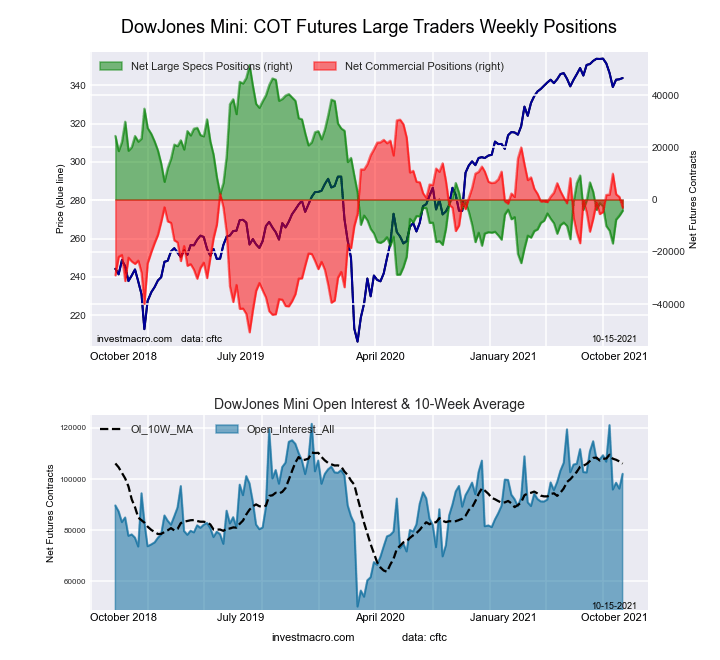
| DowJones-Mini | 102,040 | 73 | -4,283 | 31 | -3,119 | 59 | 7,402 | 78 |
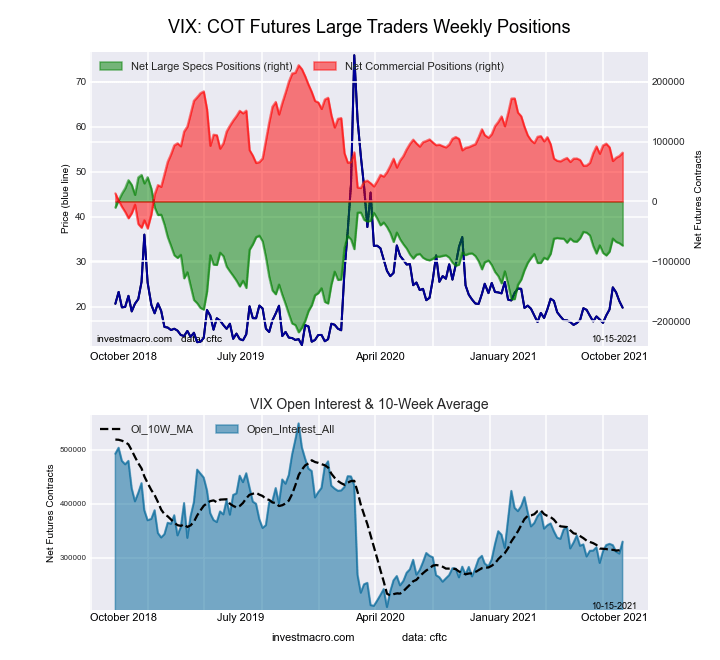
| VIX | 329,905 | 36 | -73,569 | 55 | 81,417 | 46 | -7,848 | 27 |
| Nikkei 225 Yen | 56,171 | 38 | 4,608 | 34 | 26,699 | 100 | -31,307 | 18 |
Free Reports:
This week’s current strength score (the trader positioning range over the past three years, measured from 0 to 100) shows the speculators are currently Bullish with a score of 55.1 percent. The commercials are Bearish with a score of 46.4 percent and the small traders (not shown in chart) are Bearish with a score of 26.6 percent.
| VIX Volatility Futures Statistics | SPECULATORS | COMMERCIALS | SMALL TRADERS |
| – Percent of Open Interest Longs: | 16.3 | 52.1 | 6.3 |
| – Percent of Open Interest Shorts: | 38.6 | 27.4 | 8.7 |
| – Net Position: | -73,569 | 81,417 | -7,848 |
| – Gross Longs: | 53,756 | 171,928 | 20,718 |
| – Gross Shorts: | 127,325 | 90,511 | 28,566 |
| – Long to Short Ratio: | 0.4 to 1 | 1.9 to 1 | 0.7 to 1 |
| NET POSITION TREND: | |||
| – COT Index Score (3 Year Range Pct): | 55.1 | 46.4 | 26.6 |
| – COT Index Reading (3 Year Range): | Bullish | Bearish | Bearish |
| NET POSITION MOVEMENT INDEX: | |||
| – 6-Week Change in Strength Index: | 4.7 | -4.4 | -0.6 |
This week’s current strength score (the trader positioning range over the past three years, measured from 0 to 100) shows the speculators are currently Bullish with a score of 71.0 percent. The commercials are Bearish with a score of 42.0 percent and the small traders (not shown in chart) are Bearish with a score of 33.6 percent.
| S&P500 Mini Futures Statistics | SPECULATORS | COMMERCIALS | SMALL TRADERS |
| – Percent of Open Interest Longs: | 15.8 | 70.9 | 10.9 |
| – Percent of Open Interest Shorts: | 11.7 | 76.4 | 9.5 |
| – Net Position: | 98,783 | -133,167 | 34,384 |
| – Gross Longs: | 379,901 | 1,704,039 | 262,461 |
| – Gross Shorts: | 281,118 | 1,837,206 | 228,077 |
| – Long to Short Ratio: | 1.4 to 1 | 0.9 to 1 | 1.2 to 1 |
| NET POSITION TREND: | |||
| – COT Index Score (3 Year Range Pct): | 71.0 | 42.0 | 33.6 |
| – COT Index Reading (3 Year Range): | Bullish | Bearish | Bearish |
| NET POSITION MOVEMENT INDEX: | |||
| – 6-Week Change in Strength Index: | 22.5 | -7.2 | -18.3 |
This week’s current strength score (the trader positioning range over the past three years, measured from 0 to 100) shows the speculators are currently Bearish with a score of 30.5 percent. The commercials are Bullish with a score of 58.6 percent and the small traders (not shown in chart) are Bullish with a score of 78.0 percent.
| Dow Jones Mini Futures Statistics | SPECULATORS | COMMERCIALS | SMALL TRADERS |
| – Percent of Open Interest Longs: | 31.5 | 48.6 | 18.0 |
| – Percent of Open Interest Shorts: | 35.7 | 51.6 | 10.8 |
| – Net Position: | -4,283 | -3,119 | 7,402 |
| – Gross Longs: | 32,183 | 49,542 | 18,417 |
| – Gross Shorts: | 36,466 | 52,661 | 11,015 |
| – Long to Short Ratio: | 0.9 to 1 | 0.9 to 1 | 1.7 to 1 |
| NET POSITION TREND: | |||
| – COT Index Score (3 Year Range Pct): | 30.5 | 58.6 | 78.0 |
| – COT Index Reading (3 Year Range): | Bearish | Bullish | Bullish |
| NET POSITION MOVEMENT INDEX: | |||
| – 6-Week Change in Strength Index: | -2.2 | 2.0 | 0.7 |
This week’s current strength score (the trader positioning range over the past three years, measured from 0 to 100) shows the speculators are currently Bullish with a score of 74.6 percent. The commercials are Bearish with a score of 28.3 percent and the small traders (not shown in chart) are Bearish with a score of 39.4 percent.
| Nasdaq Mini Futures Statistics | SPECULATORS | COMMERCIALS | SMALL TRADERS |
| – Percent of Open Interest Longs: | 26.3 | 55.2 | 16.8 |
| – Percent of Open Interest Shorts: | 26.7 | 54.0 | 17.7 |
| – Net Position: | -818 | 2,876 | -2,058 |
| – Gross Longs: | 60,671 | 127,302 | 38,670 |
| – Gross Shorts: | 61,489 | 124,426 | 40,728 |
| – Long to Short Ratio: | 1.0 to 1 | 1.0 to 1 | 0.9 to 1 |
| NET POSITION TREND: | |||
| – COT Index Score (3 Year Range Pct): | 74.6 | 28.3 | 39.4 |
| – COT Index Reading (3 Year Range): | Bullish | Bearish | Bearish |
| NET POSITION MOVEMENT INDEX: | |||
| – 6-Week Change in Strength Index: | 0.9 | -7.5 | 23.8 |
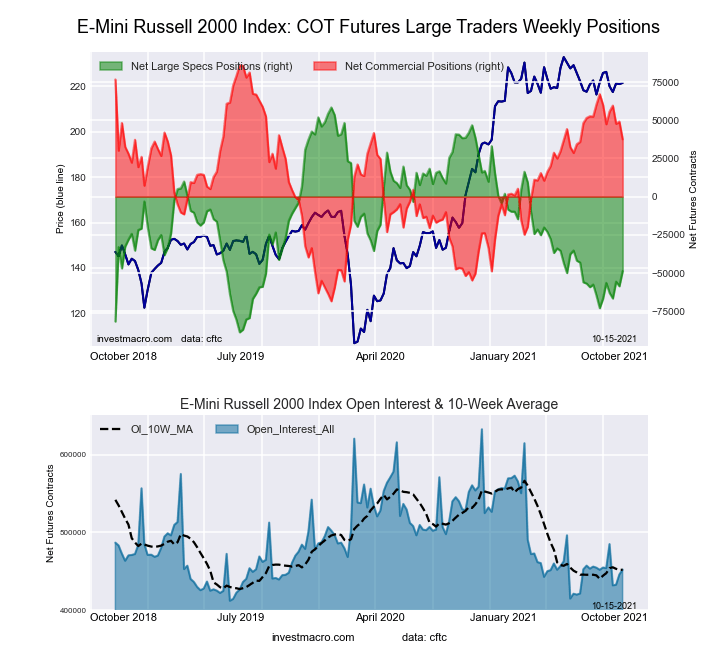
This week’s current strength score (the trader positioning range over the past three years, measured from 0 to 100) shows the speculators are currently Bearish with a score of 27.2 percent. The commercials are Bullish with a score of 68.6 percent and the small traders (not shown in chart) are Bullish with a score of 64.6 percent.
| Russell 2000 Mini Futures Statistics | SPECULATORS | COMMERCIALS | SMALL TRADERS |
| – Percent of Open Interest Longs: | 14.2 | 78.1 | 6.6 |
| – Percent of Open Interest Shorts: | 24.9 | 69.8 | 4.2 |
| – Net Position: | -48,706 | 37,536 | 11,170 |
| – Gross Longs: | 63,996 | 353,157 | 29,974 |
| – Gross Shorts: | 112,702 | 315,621 | 18,804 |
| – Long to Short Ratio: | 0.6 to 1 | 1.1 to 1 | 1.6 to 1 |
| NET POSITION TREND: | |||
| – COT Index Score (3 Year Range Pct): | 27.2 | 68.6 | 64.6 |
| – COT Index Reading (3 Year Range): | Bearish | Bullish | Bullish |
| NET POSITION MOVEMENT INDEX: | |||
| – 6-Week Change in Strength Index: | 12.3 | -14.6 | 12.6 |
This week’s current strength score (the trader positioning range over the past three years, measured from 0 to 100) shows the speculators are currently Bullish with a score of 57.3 percent. The commercials are Bearish with a score of 45.3 percent and the small traders (not shown in chart) are Bearish with a score of 44.0 percent.
| Nikkei Stock Average Futures Statistics | SPECULATORS | COMMERCIALS | SMALL TRADERS |
| – Percent of Open Interest Longs: | 12.3 | 61.5 | 26.0 |
| – Percent of Open Interest Shorts: | 5.5 | 76.0 | 18.3 |
| – Net Position: | 1,194 | -2,536 | 1,342 |
| – Gross Longs: | 2,167 | 10,796 | 4,558 |
| – Gross Shorts: | 973 | 13,332 | 3,216 |
| – Long to Short Ratio: | 2.2 to 1 | 0.8 to 1 | 1.4 to 1 |
| NET POSITION TREND: | |||
| – COT Index Score (3 Year Range Pct): | 57.3 | 45.3 | 44.0 |
| – COT Index Reading (3 Year Range): | Bullish | Bearish | Bearish |
| NET POSITION MOVEMENT INDEX: | |||
| – 6-Week Change in Strength Index: | 17.0 | -21.1 | 15.3 |
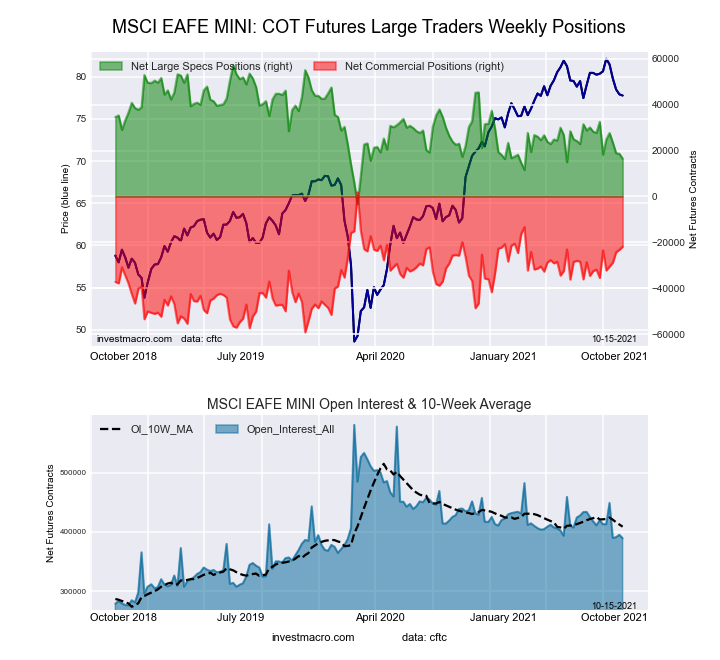
This week’s current strength score (the trader positioning range over the past three years, measured from 0 to 100) shows the speculators are currently Bearish with a score of 32.8 percent. The commercials are Bullish with a score of 61.1 percent and the small traders (not shown in chart) are Bullish with a score of 65.3 percent.
| MSCI EAFE Mini Futures Statistics | SPECULATORS | COMMERCIALS | SMALL TRADERS |
| – Percent of Open Interest Longs: | 7.0 | 89.7 | 2.7 |
| – Percent of Open Interest Shorts: | 2.8 | 95.3 | 1.3 |
| – Net Position: | 16,454 | -21,896 | 5,442 |
| – Gross Longs: | 27,317 | 349,336 | 10,335 |
| – Gross Shorts: | 10,863 | 371,232 | 4,893 |
| – Long to Short Ratio: | 2.5 to 1 | 0.9 to 1 | 2.1 to 1 |
| NET POSITION TREND: | |||
| – COT Index Score (3 Year Range Pct): | 32.8 | 61.1 | 65.3 |
| – COT Index Reading (3 Year Range): | Bearish | Bullish | Bullish |
| NET POSITION MOVEMENT INDEX: | |||
| – 6-Week Change in Strength Index: | -3.0 | 2.6 | 2.0 |
Article By InvestMacro.com – Receive our weekly COT Reports by Email
*COT Report: The COT data, released weekly to the public each Friday, is updated through the most recent Tuesday (data is 3 days old) and shows a quick view of how large speculators or non-commercials (for-profit traders) were positioned in the futures markets.
The CFTC categorizes trader positions according to commercial hedgers (traders who use futures contracts for hedging as part of the business), non-commercials (large traders who speculate to realize trading profits) and nonreportable traders (usually small traders/speculators).
Find CFTC criteria here: (http://www.cftc.gov/MarketReports/CommitmentsofTraders/ExplanatoryNotes/index.htm).
By InvestMacro Here are the latest charts and statistics for the Commitment of Traders (COT)…
By InvestMacro Here are the latest charts and statistics for the Commitment of Traders (COT)…
By ForexTime FXTM’s USDInd ↑ 2% MTD Dollar best performing G10 currency MTD Geopolitical risk…
By JustMarkets The US stock market concluded Thursday’s session in the red as the escalating…
By Analytical Department RoboForex EUR/USD is holding near 1.1620 on Friday, with the US dollar…
By JustMarkets The US stock market rose on Wednesday. By the end of the day,…
This website uses cookies.