By InvestMacro.com COT Home | Data Tables | Data Downloads | Newsletter
Here are the latest charts and statistics for the Commitment of Traders (COT) data published by the Commodities Futures Trading Commission (CFTC).
The latest COT data is updated through Tuesday October 12th 2021 and shows a quick view of how large traders (for-profit speculators and commercial entities) were positioned in the futures markets.
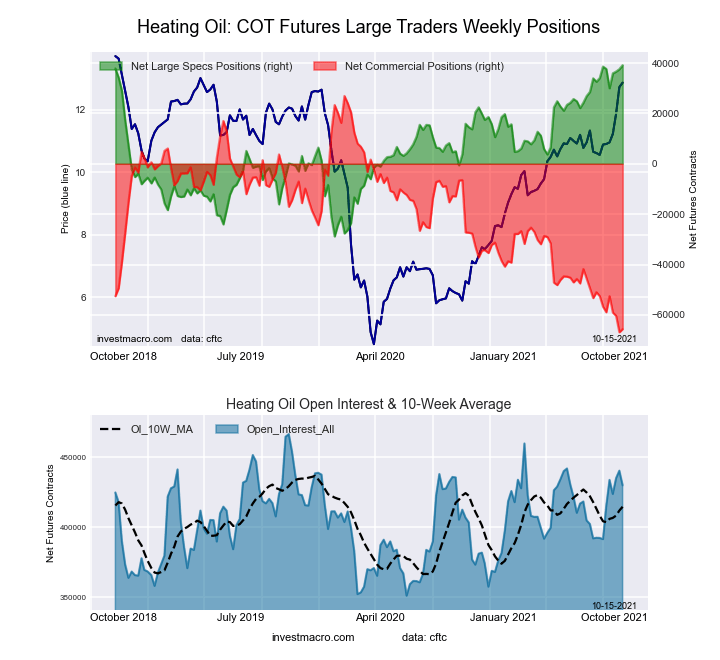
Highlighting this week’s data is the Heating Oil bullish speculator positions which rose to the highest level in the past 156 weeks at a total of 39,137 contracts. This is the most bullish level dating back to October 16th of 2018 when the net position totaled 43,385 contracts. Heating Oil speculative contracts have increased for four straight weeks and for ten out of the last thirteen weeks. The speculator strength score is currently at 100 percent showing that speculator sentiment is at a three-year high.
| Oct-12-2021 | OI | OI-Index | Spec-Net | Spec-Index | Com-Net | COM-Index | Smalls-Net | Smalls-Index |
|---|---|---|---|---|---|---|---|---|
| WTI Crude | 2,231,227 | 48 | 404,776 | 41 | -453,684 | 46 | 48,908 | 84 |
| Gold | 484,382 | 21 | 185,539 | 54 | -207,614 | 46 | 22,075 | 33 |
| Silver | 139,403 | 6 | 17,987 | 40 | -30,292 | 69 | 12,305 | 11 |
| Copper | 194,817 | 23 | 22,481 | 59 | -25,867 | 42 | 3,386 | 45 |
| Palladium | 9,296 | 13 | -2,496 | 4 | 2,625 | 95 | -129 | 37 |
| Platinum | 59,344 | 21 | 10,919 | 18 | -16,756 | 85 | 5,837 | 43 |
| Natural Gas | 1,314,022 | 40 | -130,902 | 39 | 91,201 | 60 | 39,701 | 79 |
| Brent | 205,521 | 44 | -34,924 | 57 | 29,563 | 37 | 5,361 | 82 |
| Heating Oil | 429,908 | 68 | 39,137 | 100 | -65,644 | 1 | 26,507 | 90 |
| Soybeans | 759,101 | 35 | 41,990 | 41 | -9,665 | 64 | -32,325 | 18 |
| Corn | 1,400,377 | 4 | 279,288 | 66 | -223,336 | 40 | -55,952 | 11 |
| Coffee | 305,141 | 62 | 69,085 | 99 | -73,808 | 2 | 4,723 | 21 |
| Sugar | 891,672 | 25 | 246,188 | 87 | -294,674 | 12 | 48,486 | 68 |
| Wheat | 385,204 | 23 | -4,534 | 43 | 12,969 | 53 | -8,435 | 61 |
Free Reports:
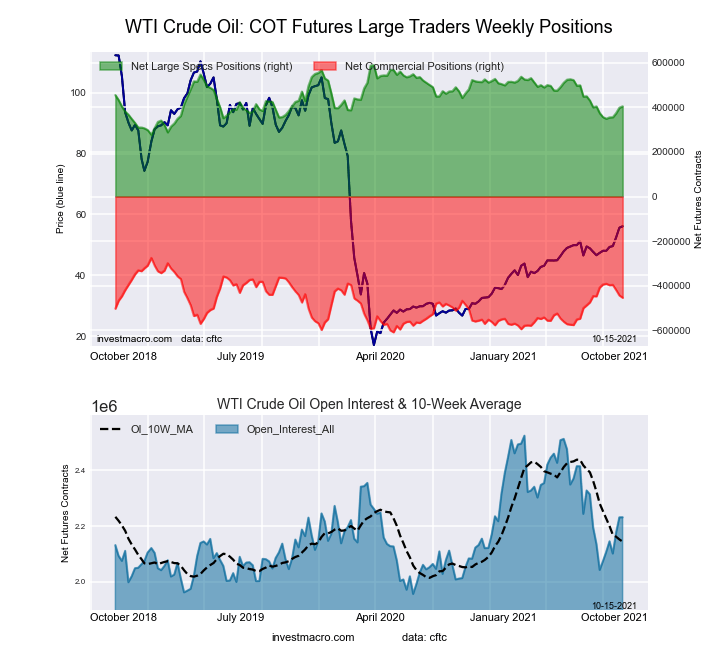
This week’s current strength score (the trader positioning range over the past three years, measured from 0 to 100) shows the speculators are currently Bearish with a score of 40.9 percent. The commercials are Bearish with a score of 46.5 percent and the small traders (not shown in chart) are Bullish-Extreme with a score of 83.9 percent.
| WTI Crude Oil Futures Statistics | SPECULATORS | COMMERCIALS | SMALL TRADERS |
| – Percent of Open Interest Longs: | 25.3 | 32.3 | 4.7 |
| – Percent of Open Interest Shorts: | 7.1 | 52.7 | 2.5 |
| – Net Position: | 404,776 | -453,684 | 48,908 |
| – Gross Longs: | 564,001 | 721,614 | 105,276 |
| – Gross Shorts: | 159,225 | 1,175,298 | 56,368 |
| – Long to Short Ratio: | 3.5 to 1 | 0.6 to 1 | 1.9 to 1 |
| NET POSITION TREND: | |||
| – COT Index Score (3 Year Range Pct): | 40.9 | 46.5 | 83.9 |
| – COT Index Reading (3 Year Range): | Bearish | Bearish | Bullish-Extreme |
| NET POSITION MOVEMENT INDEX: | |||
| – 6-Week Change in Strength Index: | 15.5 | -17.8 | 15.7 |
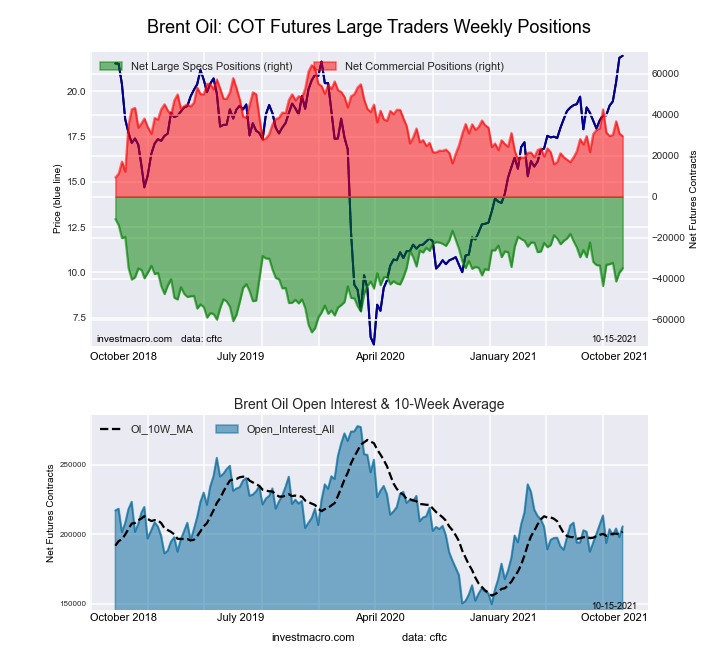
This week’s current strength score (the trader positioning range over the past three years, measured from 0 to 100) shows the speculators are currently Bullish with a score of 56.6 percent. The commercials are Bearish with a score of 36.8 percent and the small traders (not shown in chart) are Bullish-Extreme with a score of 82.4 percent.
| Brent Crude Oil Futures Statistics | SPECULATORS | COMMERCIALS | SMALL TRADERS |
| – Percent of Open Interest Longs: | 15.9 | 49.6 | 4.9 |
| – Percent of Open Interest Shorts: | 32.9 | 35.2 | 2.3 |
| – Net Position: | -34,924 | 29,563 | 5,361 |
| – Gross Longs: | 32,761 | 101,894 | 10,063 |
| – Gross Shorts: | 67,685 | 72,331 | 4,702 |
| – Long to Short Ratio: | 0.5 to 1 | 1.4 to 1 | 2.1 to 1 |
| NET POSITION TREND: | |||
| – COT Index Score (3 Year Range Pct): | 56.6 | 36.8 | 82.4 |
| – COT Index Reading (3 Year Range): | Bullish | Bearish | Bullish-Extreme |
| NET POSITION MOVEMENT INDEX: | |||
| – 6-Week Change in Strength Index: | 15.6 | -23.8 | 38.5 |
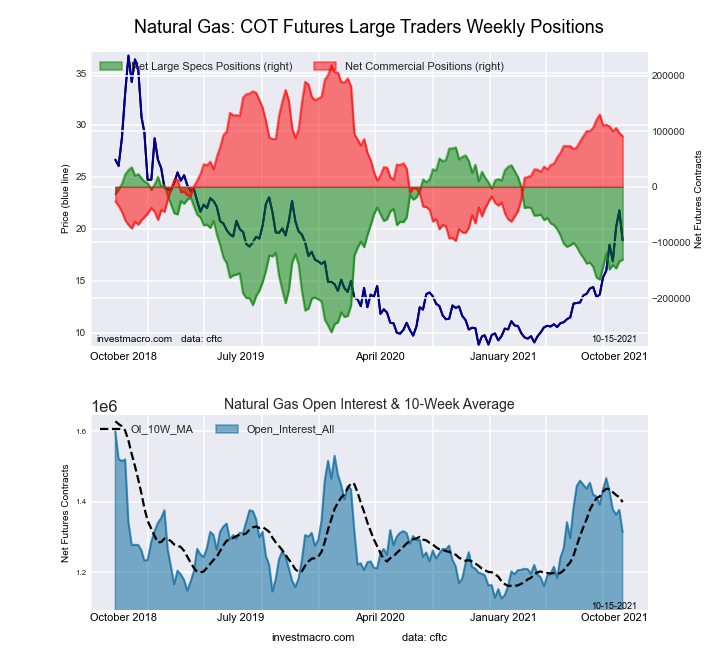
This week’s current strength score (the trader positioning range over the past three years, measured from 0 to 100) shows the speculators are currently Bearish with a score of 39.3 percent. The commercials are Bullish with a score of 59.6 percent and the small traders (not shown in chart) are Bullish with a score of 79.5 percent.
| Natural Gas Futures Statistics | SPECULATORS | COMMERCIALS | SMALL TRADERS |
| – Percent of Open Interest Longs: | 20.7 | 44.3 | 5.0 |
| – Percent of Open Interest Shorts: | 30.7 | 37.4 | 2.0 |
| – Net Position: | -130,902 | 91,201 | 39,701 |
| – Gross Longs: | 272,106 | 582,327 | 65,639 |
| – Gross Shorts: | 403,008 | 491,126 | 25,938 |
| – Long to Short Ratio: | 0.7 to 1 | 1.2 to 1 | 2.5 to 1 |
| NET POSITION TREND: | |||
| – COT Index Score (3 Year Range Pct): | 39.3 | 59.6 | 79.5 |
| – COT Index Reading (3 Year Range): | Bearish | Bullish | Bullish |
| NET POSITION MOVEMENT INDEX: | |||
| – 6-Week Change in Strength Index: | 4.1 | -6.0 | 13.4 |
This week’s current strength score (the trader positioning range over the past three years, measured from 0 to 100) shows the speculators are currently Bearish-Extreme with a score of 18.1 percent. The commercials are Bullish with a score of 79.3 percent and the small traders (not shown in chart) are Bullish with a score of 74.7 percent.
| Nasdaq Mini Futures Statistics | SPECULATORS | COMMERCIALS | SMALL TRADERS |
| – Percent of Open Interest Longs: | 28.7 | 45.7 | 7.6 |
| – Percent of Open Interest Shorts: | 14.5 | 63.1 | 4.4 |
| – Net Position: | 47,193 | -57,753 | 10,560 |
| – Gross Longs: | 95,137 | 151,406 | 25,077 |
| – Gross Shorts: | 47,944 | 209,159 | 14,517 |
| – Long to Short Ratio: | 2.0 to 1 | 0.7 to 1 | 1.7 to 1 |
| NET POSITION TREND: | |||
| – COT Index Score (3 Year Range Pct): | 18.1 | 79.3 | 74.7 |
| – COT Index Reading (3 Year Range): | Bearish-Extreme | Bullish | Bullish |
| NET POSITION MOVEMENT INDEX: | |||
| – 6-Week Change in Strength Index: | 5.1 | -6.4 | 8.2 |
This week’s current strength score (the trader positioning range over the past three years, measured from 0 to 100) shows the speculators are currently Bullish-Extreme with a score of 100.0 percent. The commercials are Bearish-Extreme with a score of 1.3 percent and the small traders (not shown in chart) are Bullish-Extreme with a score of 90.2 percent.
| Heating Oil Futures Statistics | SPECULATORS | COMMERCIALS | SMALL TRADERS |
| – Percent of Open Interest Longs: | 16.9 | 49.7 | 11.6 |
| – Percent of Open Interest Shorts: | 7.8 | 65.0 | 5.4 |
| – Net Position: | 39,137 | -65,644 | 26,507 |
| – Gross Longs: | 72,833 | 213,808 | 49,877 |
| – Gross Shorts: | 33,696 | 279,452 | 23,370 |
| – Long to Short Ratio: | 2.2 to 1 | 0.8 to 1 | 2.1 to 1 |
| NET POSITION TREND: | |||
| – COT Index Score (3 Year Range Pct): | 100.0 | 1.3 | 90.2 |
| – COT Index Reading (3 Year Range): | Bullish-Extreme | Bearish-Extreme | Bullish-Extreme |
| NET POSITION MOVEMENT INDEX: | |||
| – 6-Week Change in Strength Index: | 0.8 | -9.5 | 29.1 |
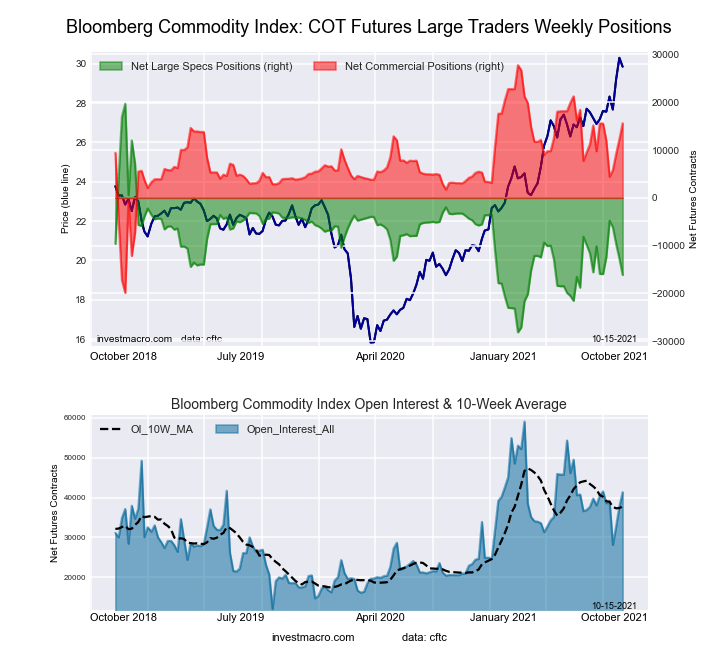
This week’s current strength score (the trader positioning range over the past three years, measured from 0 to 100) shows the speculators are currently Bearish with a score of 25.1 percent. The commercials are Bullish with a score of 74.5 percent and the small traders (not shown in chart) are Bearish with a score of 47.3 percent.
| Bloomberg Index Futures Statistics | SPECULATORS | COMMERCIALS | SMALL TRADERS |
| – Percent of Open Interest Longs: | 51.2 | 42.6 | 1.5 |
| – Percent of Open Interest Shorts: | 90.2 | 4.9 | 0.2 |
| – Net Position: | -16,117 | 15,593 | 524 |
| – Gross Longs: | 21,178 | 17,609 | 621 |
| – Gross Shorts: | 37,295 | 2,016 | 97 |
| – Long to Short Ratio: | 0.6 to 1 | 8.7 to 1 | 6.4 to 1 |
| NET POSITION TREND: | |||
| – COT Index Score (3 Year Range Pct): | 25.1 | 74.5 | 47.3 |
| – COT Index Reading (3 Year Range): | Bearish | Bullish | Bearish |
| NET POSITION MOVEMENT INDEX: | |||
| – 6-Week Change in Strength Index: | -0.4 | 0.1 | 7.1 |
Article By InvestMacro.com – Receive our weekly COT Reports by Email
*COT Report: The COT data, released weekly to the public each Friday, is updated through the most recent Tuesday (data is 3 days old) and shows a quick view of how large speculators or non-commercials (for-profit traders) were positioned in the futures markets.
The CFTC categorizes trader positions according to commercial hedgers (traders who use futures contracts for hedging as part of the business), non-commercials (large traders who speculate to realize trading profits) and nonreportable traders (usually small traders/speculators).
Find CFTC criteria here: (http://www.cftc.gov/MarketReports/CommitmentsofTraders/ExplanatoryNotes/index.htm).
By JustMarkets The US stock indices started the week on a downbeat note. By the…
By Analytical Department RoboForex GBP/USD fell to 1.3437 on Tuesday as investors assessed the appointment…
By JustMarkets The US stock indices ended Friday’s session in the red. By the end…
By Analytical Department RoboForex USD/JPY opens the week at 162.36 on Monday. The Japanese yen…
By InvestMacro Here are the latest charts and statistics for the Commitment of Traders (COT)…
By InvestMacro The latest update for the weekly Commitment of Traders (COT) report was released…
This website uses cookies.