By CountingPips.com COT Home | Data Tables | Data Downloads | Newsletter
Here are the latest charts and statistics for the Commitment of Traders (COT) data published by the Commodities Futures Trading Commission (CFTC).
The latest COT data is updated through Tuesday June 08 2021 and shows a quick view of how large traders (for-profit speculators and commercial entities) were positioned in the futures markets.
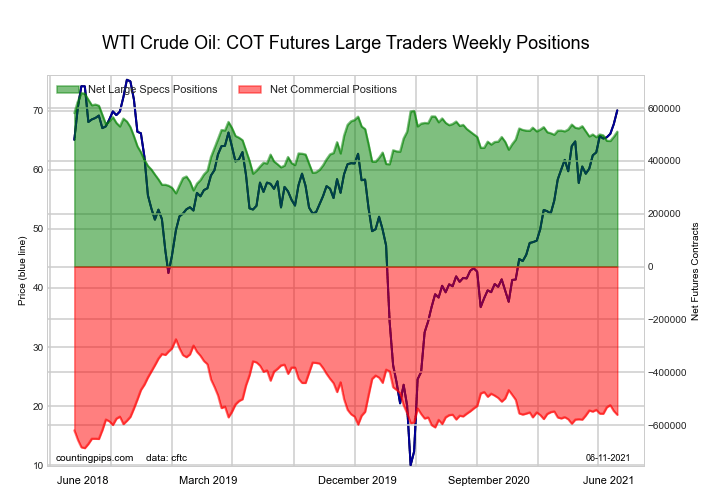
The WTI Crude Oil Futures large speculator standing this week reached a net position of 510,499 contracts in the data reported through Tuesday. This was a weekly boost of 19,202 contracts from the previous week which had a total of 491,297 net contracts.
This week’s current strength score (the trader positioning range over the past three years, measured from 0 to 100) shows the speculators are currently Bullish with a score of 61.5 percent. The commercials are Bearish with a score of 30.6 percent and the small traders (not shown in chart) are Bullish-Extreme with a score of 86.1 percent.
| WTI Crude Oil Futures Statistics | SPECULATORS | COMMERCIALS | SMALL TRADERS |
| – Percent of Open Interest Longs: | 26.2 | 34.3 | 4.7 |
| – Percent of Open Interest Shorts: | 5.8 | 56.7 | 2.6 |
| – Net Position: | 510,499 | -560,953 | 50,454 |
| – Gross Longs: | 657,352 | 862,588 | 116,939 |
| – Gross Shorts: | 146,853 | 1,423,541 | 66,485 |
| – Long to Short Ratio: | 4.5 to 1 | 0.6 to 1 | 1.8 to 1 |
| NET POSITION TREND: | |||
| – COT Index Score (3 Year Range Pct): | 61.5 | 30.6 | 86.1 |
| – COT Index Reading (3 Year Range): | Bullish | Bearish | Bullish-Extreme |
| NET POSITION MOVEMENT INDEX: | |||
| – 6-Week Change in Strength Index: | 5.5 | -4.6 | -2.8 |
Free Reports:
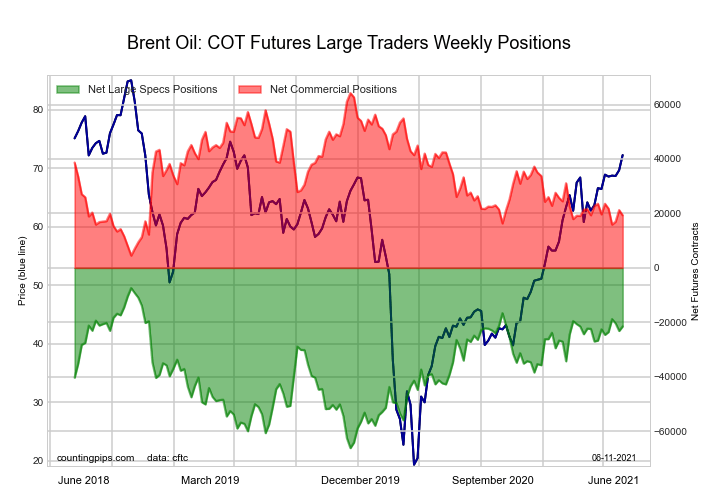
The Brent Crude Oil Futures large speculator standing this week reached a net position of -21,507 contracts in the data reported through Tuesday. This was a weekly advance of 1,671 contracts from the previous week which had a total of -23,178 net contracts.
This week’s current strength score (the trader positioning range over the past three years, measured from 0 to 100) shows the speculators are currently Bullish with a score of 76.0 percent. The commercials are Bearish with a score of 24.8 percent and the small traders (not shown in chart) are Bullish with a score of 54.8 percent.
| Brent Crude Oil Futures Statistics | SPECULATORS | COMMERCIALS | SMALL TRADERS |
| – Percent of Open Interest Longs: | 20.8 | 50.1 | 5.0 |
| – Percent of Open Interest Shorts: | 32.2 | 39.8 | 3.8 |
| – Net Position: | -21,507 | 19,301 | 2,206 |
| – Gross Longs: | 39,269 | 94,467 | 9,407 |
| – Gross Shorts: | 60,776 | 75,166 | 7,201 |
| – Long to Short Ratio: | 0.6 to 1 | 1.3 to 1 | 1.3 to 1 |
| NET POSITION TREND: | |||
| – COT Index Score (3 Year Range Pct): | 76.0 | 24.8 | 54.8 |
| – COT Index Reading (3 Year Range): | Bullish | Bearish | Bullish |
| NET POSITION MOVEMENT INDEX: | |||
| – 6-Week Change in Strength Index: | 1.8 | -0.6 | -6.3 |
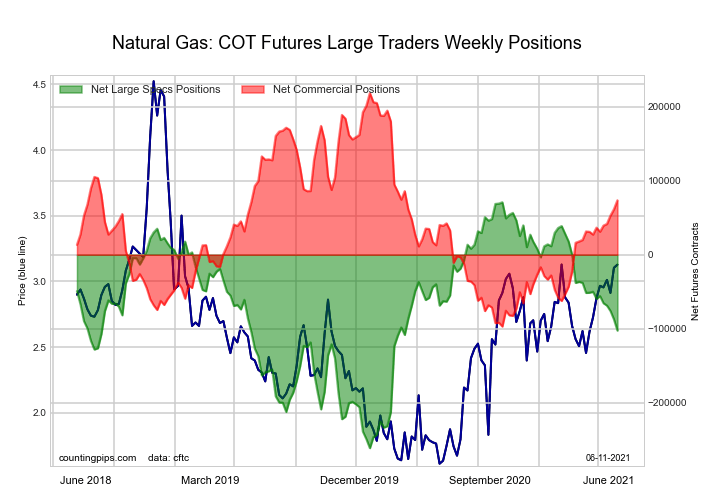
The Natural Gas Futures large speculator standing this week reached a net position of -102,508 contracts in the data reported through Tuesday. This was a weekly fall of -15,077 contracts from the previous week which had a total of -87,431 net contracts.
This week’s current strength score (the trader positioning range over the past three years, measured from 0 to 100) shows the speculators are currently Bearish with a score of 47.8 percent. The commercials are Bullish with a score of 54.0 percent and the small traders (not shown in chart) are Bearish with a score of 39.8 percent.
| Natural Gas Futures Statistics | SPECULATORS | COMMERCIALS | SMALL TRADERS |
| – Percent of Open Interest Longs: | 25.0 | 42.7 | 4.7 |
| – Percent of Open Interest Shorts: | 33.1 | 36.9 | 2.4 |
| – Net Position: | -102,508 | 73,601 | 28,907 |
| – Gross Longs: | 317,452 | 540,919 | 59,751 |
| – Gross Shorts: | 419,960 | 467,318 | 30,844 |
| – Long to Short Ratio: | 0.8 to 1 | 1.2 to 1 | 1.9 to 1 |
| NET POSITION TREND: | |||
| – COT Index Score (3 Year Range Pct): | 47.8 | 54.0 | 39.8 |
| – COT Index Reading (3 Year Range): | Bearish | Bullish | Bearish |
| NET POSITION MOVEMENT INDEX: | |||
| – 6-Week Change in Strength Index: | -12.9 | 11.7 | 18.8 |
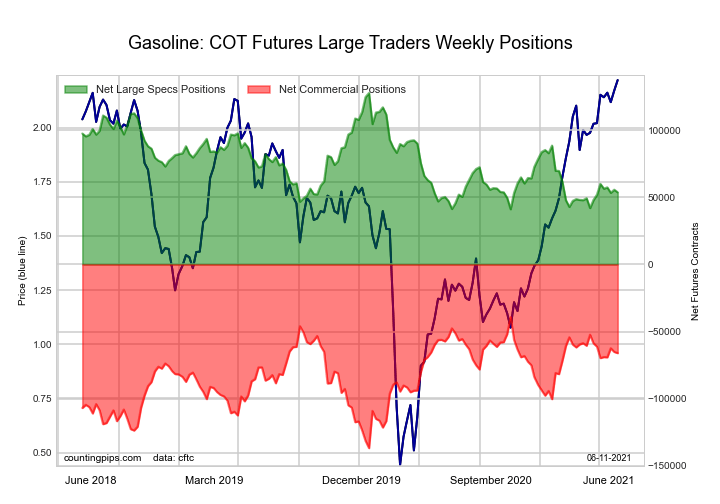
The Gasoline Blendstock Futures large speculator standing this week reached a net position of 53,752 contracts in the data reported through Tuesday. This was a weekly fall of -1,923 contracts from the previous week which had a total of 55,675 net contracts.
This week’s current strength score (the trader positioning range over the past three years, measured from 0 to 100) shows the speculators are currently Bearish-Extreme with a score of 14.6 percent. The commercials are Bullish with a score of 72.5 percent and the small traders (not shown in chart) are Bullish-Extreme with a score of 85.4 percent.
| Nasdaq Mini Futures Statistics | SPECULATORS | COMMERCIALS | SMALL TRADERS |
| – Percent of Open Interest Longs: | 23.0 | 51.3 | 6.1 |
| – Percent of Open Interest Shorts: | 10.4 | 66.7 | 3.2 |
| – Net Position: | 53,752 | -66,099 | 12,347 |
| – Gross Longs: | 98,156 | 219,259 | 26,033 |
| – Gross Shorts: | 44,404 | 285,358 | 13,686 |
| – Long to Short Ratio: | 2.2 to 1 | 0.8 to 1 | 1.9 to 1 |
| NET POSITION TREND: | |||
| – COT Index Score (3 Year Range Pct): | 14.6 | 72.5 | 85.4 |
| – COT Index Reading (3 Year Range): | Bearish-Extreme | Bullish | Bullish-Extreme |
| NET POSITION MOVEMENT INDEX: | |||
| – 6-Week Change in Strength Index: | 2.1 | -5.0 | 18.2 |
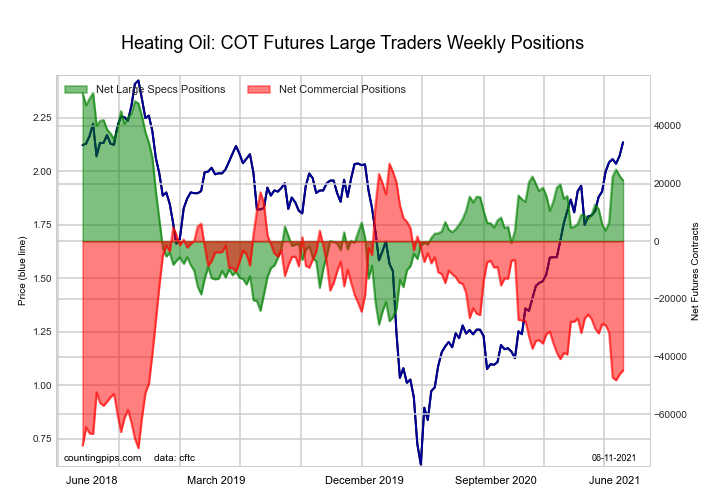
The #2 Heating Oil NY-Harbor Futures large speculator standing this week reached a net position of 21,087 contracts in the data reported through Tuesday. This was a weekly decrease of -1,617 contracts from the previous week which had a total of 22,704 net contracts.
This week’s current strength score (the trader positioning range over the past three years, measured from 0 to 100) shows the speculators are currently Bullish with a score of 62.2 percent. The commercials are Bearish with a score of 27.4 percent and the small traders (not shown in chart) are Bullish-Extreme with a score of 93.0 percent.
| Heating Oil Futures Statistics | SPECULATORS | COMMERCIALS | SMALL TRADERS |
| – Percent of Open Interest Longs: | 15.4 | 49.9 | 11.7 |
| – Percent of Open Interest Shorts: | 10.6 | 60.1 | 6.4 |
| – Net Position: | 21,087 | -44,687 | 23,600 |
| – Gross Longs: | 67,767 | 219,698 | 51,609 |
| – Gross Shorts: | 46,680 | 264,385 | 28,009 |
| – Long to Short Ratio: | 1.5 to 1 | 0.8 to 1 | 1.8 to 1 |
| NET POSITION TREND: | |||
| – COT Index Score (3 Year Range Pct): | 62.2 | 27.4 | 93.0 |
| – COT Index Reading (3 Year Range): | Bullish | Bearish | Bullish-Extreme |
| NET POSITION MOVEMENT INDEX: | |||
| – 6-Week Change in Strength Index: | 19.0 | -16.3 | 3.1 |
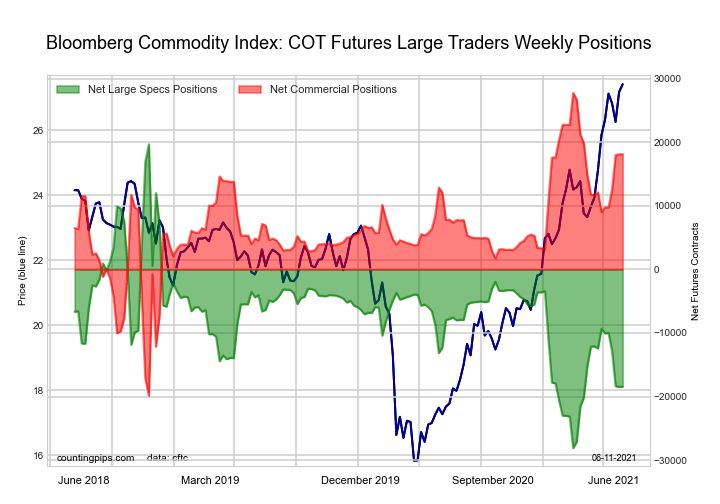
The Bloomberg Commodity Index Futures large speculator standing this week reached a net position of -18,451 contracts in the data reported through Tuesday. This was a weekly lift of 7 contracts from the previous week which had a total of -18,458 net contracts.
This week’s current strength score (the trader positioning range over the past three years, measured from 0 to 100) shows the speculators are currently Bearish with a score of 20.2 percent. The commercials are Bullish with a score of 79.8 percent and the small traders (not shown in chart) are Bullish with a score of 65.8 percent.
| Bloomberg Index Futures Statistics | SPECULATORS | COMMERCIALS | SMALL TRADERS |
| – Percent of Open Interest Longs: | 50.6 | 48.4 | 0.9 |
| – Percent of Open Interest Shorts: | 90.9 | 8.8 | 0.2 |
| – Net Position: | -18,451 | 18,129 | 322 |
| – Gross Longs: | 23,155 | 22,169 | 430 |
| – Gross Shorts: | 41,606 | 4,040 | 108 |
| – Long to Short Ratio: | 0.6 to 1 | 5.5 to 1 | 4.0 to 1 |
| NET POSITION TREND: | |||
| – COT Index Score (3 Year Range Pct): | 20.2 | 79.8 | 65.8 |
| – COT Index Reading (3 Year Range): | Bearish | Bullish | Bullish |
| NET POSITION MOVEMENT INDEX: | |||
| – 6-Week Change in Strength Index: | -19.1 | 19.2 | -1.4 |
Article By CountingPips.com – Receive our weekly COT Reports by Email
*COT Report: The COT data, released weekly to the public each Friday, is updated through the most recent Tuesday (data is 3 days old) and shows a quick view of how large speculators or non-commercials (for-profit traders) were positioned in the futures markets.
The CFTC categorizes trader positions according to commercial hedgers (traders who use futures contracts for hedging as part of the business), non-commercials (large traders who speculate to realize trading profits) and nonreportable traders (usually small traders/speculators).
Find CFTC criteria here: (http://www.cftc.gov/MarketReports/CommitmentsofTraders/ExplanatoryNotes/index.htm).
By Analytical Department RoboForex GBP/USD continued to consolidate at 1.3283 on Wednesday. The British pound…
By JustMarkets The US equity indices showed mixed performance on Tuesday. The Dow Jones (US30)…
By Pawan Jain, University of Michigan Flint Finding good financial advice can be stressful –…
Source: Stephen McBride (7/27/26) Stephen McBride of RiskHedge shares his thoughts on the potential for…
By JustMarkets The US equity indices showed mixed performance on Monday ahead of the Federal…
By Analytical Department RoboForex Gold fell to 4,047 USD per ounce on Tuesday, erasing gains…
This website uses cookies.