By CountingPips.com COT Home | Data Tables | Data Downloads | Newsletter
Here are the latest charts and statistics for the Commitment of Traders (COT) data published by the Commodities Futures Trading Commission (CFTC).
The latest COT data is updated through Tuesday June 08 2021 and shows a quick view of how large traders (for-profit speculators and commercial entities) were positioned in the futures markets.
The Gold Comex Futures large speculator standing this week came in at a net position of 209,387 contracts in the data reported through Tuesday. This was a weekly decrease of -4,314 contracts from the previous week which had a total of 213,701 net contracts.
This week’s current strength score (the trader positioning range over the past three years, measured from 0 to 100) shows the speculators are currently Bullish with a score of 63.2 percent. The commercials are Bearish with a score of 34.2 percent and the small traders (not shown in chart) are Bullish with a score of 69.6 percent.
| Gold Futures Statistics | SPECULATORS | COMMERCIALS | SMALL TRADERS |
| – Percent of Open Interest Longs: | 58.7 | 21.0 | 10.9 |
| – Percent of Open Interest Shorts: | 16.1 | 70.8 | 3.7 |
| – Net Position: | 209,387 | -244,806 | 35,419 |
| – Gross Longs: | 288,781 | 103,496 | 53,829 |
| – Gross Shorts: | 79,394 | 348,302 | 18,410 |
| – Long to Short Ratio: | 3.6 to 1 | 0.3 to 1 | 2.9 to 1 |
| NET POSITION TREND: | |||
| – COT Index Score (3 Year Range Pct): | 63.2 | 34.2 | 69.6 |
| – COT Index Reading (3 Year Range): | Bullish | Bearish | Bullish |
| NET POSITION MOVEMENT INDEX: | |||
| – 6-Week Change in Strength Index: | 9.9 | -9.1 | -2.8 |
Free Reports:
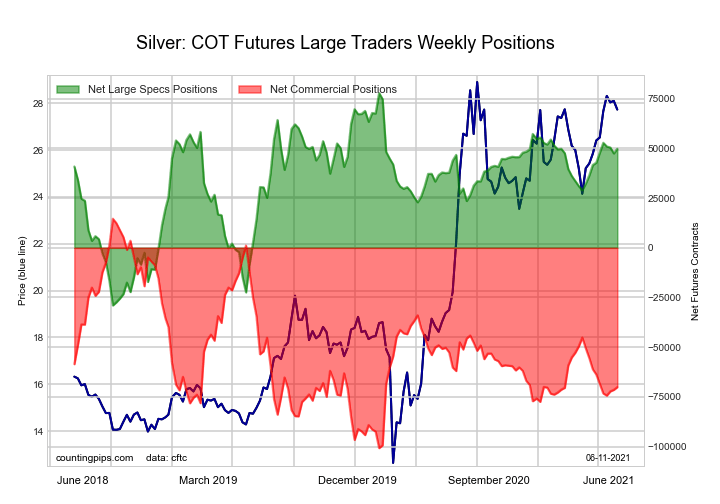
The Silver Comex Futures large speculator standing this week came in at a net position of 49,806 contracts in the data reported through Tuesday. This was a weekly boost of 2,289 contracts from the previous week which had a total of 47,517 net contracts.
This week’s current strength score (the trader positioning range over the past three years, measured from 0 to 100) shows the speculators are currently Bullish with a score of 73.7 percent. The commercials are Bearish with a score of 26.6 percent and the small traders (not shown in chart) are Bullish with a score of 59.7 percent.
| Silver Futures Statistics | SPECULATORS | COMMERCIALS | SMALL TRADERS |
| – Percent of Open Interest Longs: | 45.1 | 29.7 | 18.2 |
| – Percent of Open Interest Shorts: | 18.2 | 67.6 | 7.2 |
| – Net Position: | 49,806 | -70,113 | 20,307 |
| – Gross Longs: | 83,378 | 54,818 | 33,582 |
| – Gross Shorts: | 33,572 | 124,931 | 13,275 |
| – Long to Short Ratio: | 2.5 to 1 | 0.4 to 1 | 2.5 to 1 |
| NET POSITION TREND: | |||
| – COT Index Score (3 Year Range Pct): | 73.7 | 26.6 | 59.7 |
| – COT Index Reading (3 Year Range): | Bullish | Bearish | Bullish |
| NET POSITION MOVEMENT INDEX: | |||
| – 6-Week Change in Strength Index: | 6.5 | -5.5 | -3.6 |
The Copper Grade #1 Futures large speculator standing this week came in at a net position of 14,635 contracts in the data reported through Tuesday. This was a weekly fall of -3,888 contracts from the previous week which had a total of 18,523 net contracts.
This week’s current strength score (the trader positioning range over the past three years, measured from 0 to 100) shows the speculators are currently Bullish with a score of 52.9 percent. The commercials are Bearish with a score of 41.5 percent and the small traders (not shown in chart) are Bullish-Extreme with a score of 91.6 percent.
| Copper Futures Statistics | SPECULATORS | COMMERCIALS | SMALL TRADERS |
| – Percent of Open Interest Longs: | 38.9 | 33.5 | 10.8 |
| – Percent of Open Interest Shorts: | 32.7 | 44.6 | 5.9 |
| – Net Position: | 14,635 | -26,103 | 11,468 |
| – Gross Longs: | 91,156 | 78,359 | 25,257 |
| – Gross Shorts: | 76,521 | 104,462 | 13,789 |
| – Long to Short Ratio: | 1.2 to 1 | 0.8 to 1 | 1.8 to 1 |
| NET POSITION TREND: | |||
| – COT Index Score (3 Year Range Pct): | 52.9 | 41.5 | 91.6 |
| – COT Index Reading (3 Year Range): | Bullish | Bearish | Bullish-Extreme |
| NET POSITION MOVEMENT INDEX: | |||
| – 6-Week Change in Strength Index: | -24.9 | 24.3 | -4.4 |
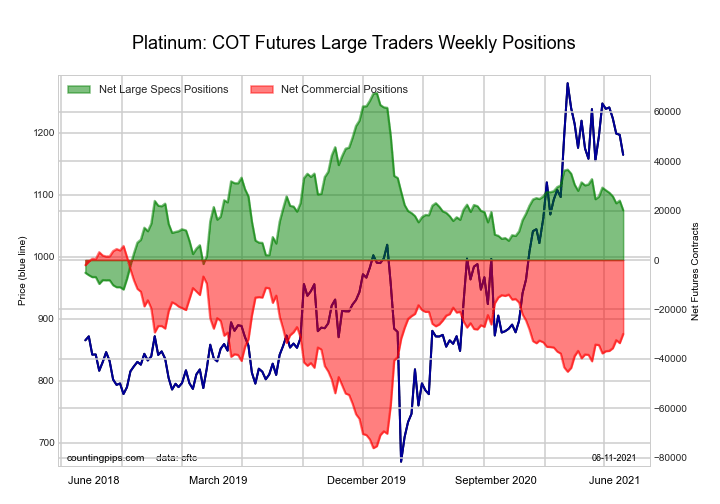
The Platinum Futures large speculator standing this week came in at a net position of 20,164 contracts in the data reported through Tuesday. This was a weekly fall of -3,881 contracts from the previous week which had a total of 24,045 net contracts.
This week’s current strength score (the trader positioning range over the past three years, measured from 0 to 100) shows the speculators are currently Bearish with a score of 40.3 percent. The commercials are Bullish with a score of 56.5 percent and the small traders (not shown in chart) are Bullish-Extreme with a score of 98.4 percent.
| Platinum Futures Statistics | SPECULATORS | COMMERCIALS | SMALL TRADERS |
| – Percent of Open Interest Longs: | 56.6 | 21.0 | 18.2 |
| – Percent of Open Interest Shorts: | 26.3 | 65.9 | 3.6 |
| – Net Position: | 20,164 | -29,929 | 9,765 |
| – Gross Longs: | 37,717 | 13,975 | 12,154 |
| – Gross Shorts: | 17,553 | 43,904 | 2,389 |
| – Long to Short Ratio: | 2.1 to 1 | 0.3 to 1 | 5.1 to 1 |
| NET POSITION TREND: | |||
| – COT Index Score (3 Year Range Pct): | 40.3 | 56.5 | 98.4 |
| – COT Index Reading (3 Year Range): | Bearish | Bullish | Bullish-Extreme |
| NET POSITION MOVEMENT INDEX: | |||
| – 6-Week Change in Strength Index: | -11.5 | 9.6 | 17.9 |
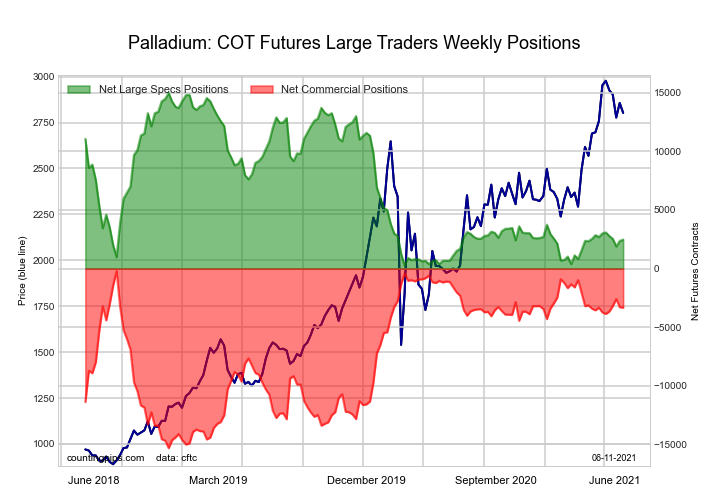
The Palladium Futures large speculator standing this week came in at a net position of 2,475 contracts in the data reported through Tuesday. This was a weekly rise of 113 contracts from the previous week which had a total of 2,362 net contracts.
This week’s current strength score (the trader positioning range over the past three years, measured from 0 to 100) shows the speculators are currently Bearish-Extreme with a score of 14.9 percent. The commercials are Bullish with a score of 79.3 percent and the small traders (not shown in chart) are Bullish-Extreme with a score of 95.0 percent.
| Palladium Futures Statistics | SPECULATORS | COMMERCIALS | SMALL TRADERS |
| – Percent of Open Interest Longs: | 56.9 | 25.6 | 14.8 |
| – Percent of Open Interest Shorts: | 33.9 | 56.6 | 6.9 |
| – Net Position: | 2,475 | -3,329 | 854 |
| – Gross Longs: | 6,127 | 2,760 | 1,595 |
| – Gross Shorts: | 3,652 | 6,089 | 741 |
| – Long to Short Ratio: | 1.7 to 1 | 0.5 to 1 | 2.2 to 1 |
| NET POSITION TREND: | |||
| – COT Index Score (3 Year Range Pct): | 14.9 | 79.3 | 95.0 |
| – COT Index Reading (3 Year Range): | Bearish-Extreme | Bullish | Bullish-Extreme |
| NET POSITION MOVEMENT INDEX: | |||
| – 6-Week Change in Strength Index: | -3.6 | 2.7 | 7.3 |
Article By CountingPips.com – Receive our weekly COT Reports by Email
*COT Report: The COT data, released weekly to the public each Friday, is updated through the most recent Tuesday (data is 3 days old) and shows a quick view of how large speculators or non-commercials (for-profit traders) were positioned in the futures markets.
The CFTC categorizes trader positions according to commercial hedgers (traders who use futures contracts for hedging as part of the business), non-commercials (large traders who speculate to realize trading profits) and nonreportable traders (usually small traders/speculators).
Find CFTC criteria here: (http://www.cftc.gov/MarketReports/CommitmentsofTraders/ExplanatoryNotes/index.htm).
By Analytical Department RoboForex GBP/USD continued to consolidate at 1.3283 on Wednesday. The British pound…
By JustMarkets The US equity indices showed mixed performance on Tuesday. The Dow Jones (US30)…
By Pawan Jain, University of Michigan Flint Finding good financial advice can be stressful –…
Source: Stephen McBride (7/27/26) Stephen McBride of RiskHedge shares his thoughts on the potential for…
By JustMarkets The US equity indices showed mixed performance on Monday ahead of the Federal…
By Analytical Department RoboForex Gold fell to 4,047 USD per ounce on Tuesday, erasing gains…
This website uses cookies.