By CountingPips.com COT Home | Data Tables | Data Downloads | Newsletter
Here are the latest charts and statistics for the Commitment of Traders (COT) data published by the Commodities Futures Trading Commission (CFTC).
The latest COT data is updated through Tuesday May 25 2021 and shows a quick view of how large traders (for-profit speculators and commercial entities) were positioned in the futures markets.
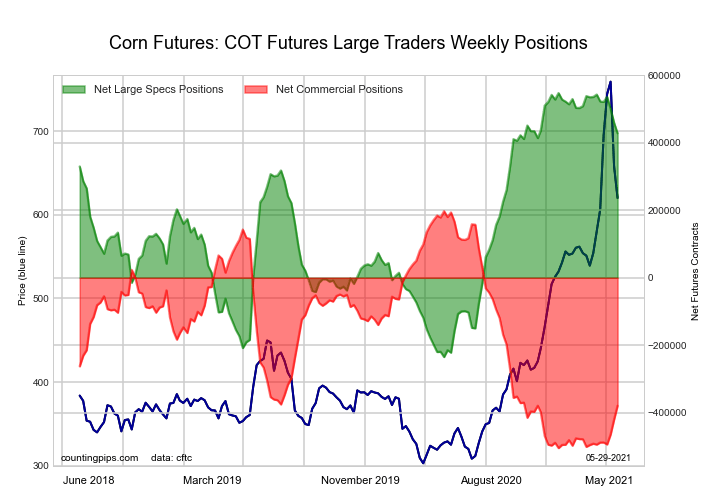
The CORN large speculator standing this week recorded a net position of 428,426 contracts in the data reported through Tuesday. This was a weekly lowering of -31,052 contracts from the previous week which had a total of 459,478 net contracts.
This week’s current strength score (the trader positioning range over the past three years, measured from 0 to 100) shows the speculators are currently Bullish-Extreme with a score of 84.8 percent. The commercials are Bearish-Extreme with a score of 17.9 percent and the small traders (not shown in chart) are Bearish-Extreme with a score of 11.1 percent.
| CORN Futures Statistics | SPECULATORS | COMMERCIALS | SMALL TRADERS |
| – Percent of Open Interest Longs: | 30.1 | 49.2 | 8.1 |
| – Percent of Open Interest Shorts: | 5.2 | 71.3 | 10.9 |
| – Net Position: | 428,426 | -379,469 | -48,957 |
| – Gross Longs: | 518,145 | 846,602 | 138,713 |
| – Gross Shorts: | 89,719 | 1,226,071 | 187,670 |
| – Long to Short Ratio: | 5.8 to 1 | 0.7 to 1 | 0.7 to 1 |
| NET POSITION TREND: | |||
| – COT Index Score (3 Year Range Pct): | 84.8 | 17.9 | 11.1 |
| – COT Index Reading (3 Year Range): | Bullish-Extreme | Bearish-Extreme | Bearish-Extreme |
| NET POSITION MOVEMENT INDEX: | |||
| – 6-Week Change in Strength Index: | -14.7 | 16.4 | -0.2 |
Free Reports:
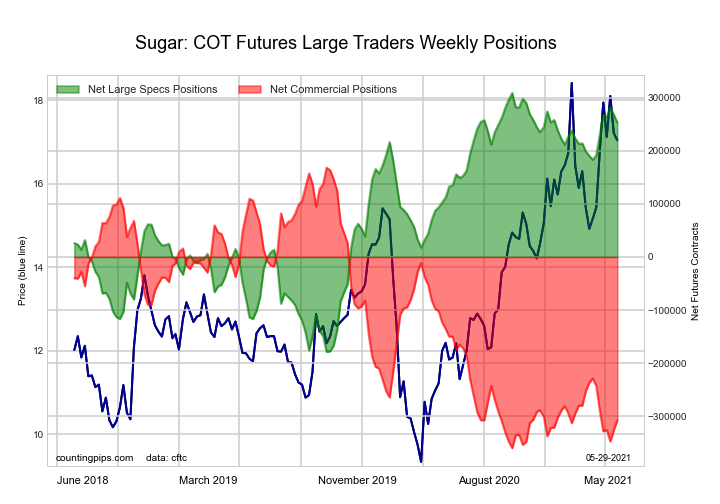
The SUGAR large speculator standing this week recorded a net position of 252,991 contracts in the data reported through Tuesday. This was a weekly decline of -14,843 contracts from the previous week which had a total of 267,834 net contracts.
This week’s current strength score (the trader positioning range over the past three years, measured from 0 to 100) shows the speculators are currently Bullish-Extreme with a score of 88.6 percent. The commercials are Bearish-Extreme with a score of 9.9 percent and the small traders (not shown in chart) are Bullish with a score of 74.7 percent.
| SUGAR Futures Statistics | SPECULATORS | COMMERCIALS | SMALL TRADERS |
| – Percent of Open Interest Longs: | 29.0 | 46.0 | 9.1 |
| – Percent of Open Interest Shorts: | 4.2 | 76.1 | 3.8 |
| – Net Position: | 252,991 | -307,075 | 54,084 |
| – Gross Longs: | 296,225 | 470,088 | 92,683 |
| – Gross Shorts: | 43,234 | 777,163 | 38,599 |
| – Long to Short Ratio: | 6.9 to 1 | 0.6 to 1 | 2.4 to 1 |
| NET POSITION TREND: | |||
| – COT Index Score (3 Year Range Pct): | 88.6 | 9.9 | 74.7 |
| – COT Index Reading (3 Year Range): | Bullish-Extreme | Bearish-Extreme | Bullish |
| NET POSITION MOVEMENT INDEX: | |||
| – 6-Week Change in Strength Index: | 12.6 | -12.2 | 3.8 |
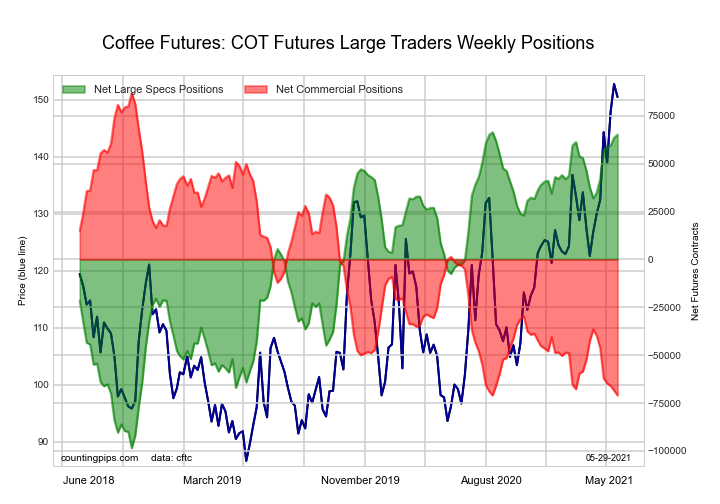
The COFFEE large speculator standing this week recorded a net position of 65,114 contracts in the data reported through Tuesday. This was a weekly lift of 1,641 contracts from the previous week which had a total of 63,473 net contracts.
This week’s current strength score (the trader positioning range over the past three years, measured from 0 to 100) shows the speculators are currently Bullish-Extreme with a score of 99.3 percent. The commercials are Bearish-Extreme with a score of 0.0 percent and the small traders (not shown in chart) are Bearish with a score of 28.5 percent.
| COFFEE Futures Statistics | SPECULATORS | COMMERCIALS | SMALL TRADERS |
| – Percent of Open Interest Longs: | 30.2 | 45.3 | 4.6 |
| – Percent of Open Interest Shorts: | 7.7 | 69.7 | 2.6 |
| – Net Position: | 65,114 | -70,912 | 5,798 |
| – Gross Longs: | 87,383 | 131,127 | 13,194 |
| – Gross Shorts: | 22,269 | 202,039 | 7,396 |
| – Long to Short Ratio: | 3.9 to 1 | 0.6 to 1 | 1.8 to 1 |
| NET POSITION TREND: | |||
| – COT Index Score (3 Year Range Pct): | 99.3 | 0.0 | 28.5 |
| – COT Index Reading (3 Year Range): | Bullish-Extreme | Bearish-Extreme | Bearish |
| NET POSITION MOVEMENT INDEX: | |||
| – 6-Week Change in Strength Index: | 18.4 | -19.6 | 5.2 |
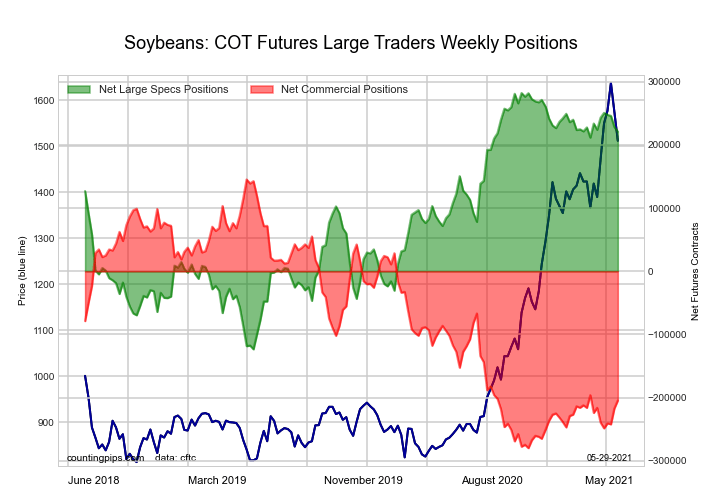
The SOYBEANS large speculator standing this week recorded a net position of 221,055 contracts in the data reported through Tuesday. This was a weekly decline of -7,286 contracts from the previous week which had a total of 228,341 net contracts.
This week’s current strength score (the trader positioning range over the past three years, measured from 0 to 100) shows the speculators are currently Bullish-Extreme with a score of 85.0 percent. The commercials are Bearish-Extreme with a score of 17.7 percent and the small traders (not shown in chart) are Bearish with a score of 48.5 percent.
| SOYBEANS Futures Statistics | SPECULATORS | COMMERCIALS | SMALL TRADERS |
| – Percent of Open Interest Longs: | 34.2 | 46.1 | 6.5 |
| – Percent of Open Interest Shorts: | 6.8 | 71.5 | 8.6 |
| – Net Position: | 221,055 | -204,446 | -16,609 |
| – Gross Longs: | 275,409 | 370,661 | 52,519 |
| – Gross Shorts: | 54,354 | 575,107 | 69,128 |
| – Long to Short Ratio: | 5.1 to 1 | 0.6 to 1 | 0.8 to 1 |
| NET POSITION TREND: | |||
| – COT Index Score (3 Year Range Pct): | 85.0 | 17.7 | 48.5 |
| – COT Index Reading (3 Year Range): | Bullish-Extreme | Bearish-Extreme | Bearish |
| NET POSITION MOVEMENT INDEX: | |||
| – 6-Week Change in Strength Index: | -0.7 | 2.7 | -13.3 |
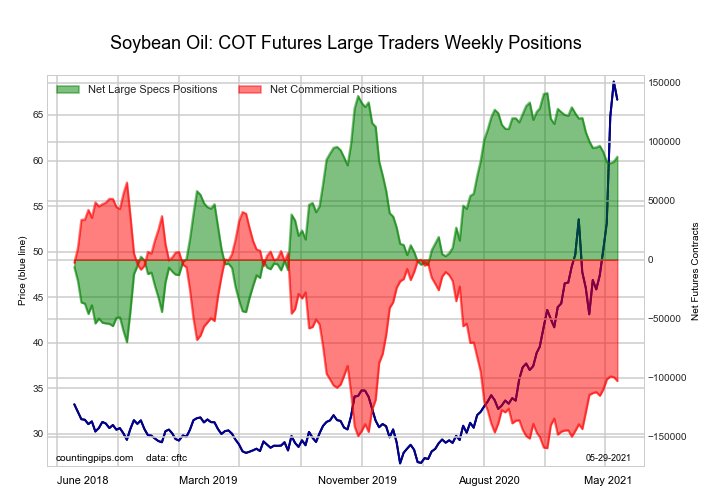
The SOYBEAN OIL large speculator standing this week recorded a net position of 87,203 contracts in the data reported through Tuesday. This was a weekly advance of 4,237 contracts from the previous week which had a total of 82,966 net contracts.
This week’s current strength score (the trader positioning range over the past three years, measured from 0 to 100) shows the speculators are currently Bullish with a score of 74.4 percent. The commercials are Bearish with a score of 25.3 percent and the small traders (not shown in chart) are Bullish with a score of 71.2 percent.
| SOYBEAN OIL Futures Statistics | SPECULATORS | COMMERCIALS | SMALL TRADERS |
| – Percent of Open Interest Longs: | 24.4 | 47.4 | 8.3 |
| – Percent of Open Interest Shorts: | 7.4 | 67.5 | 5.2 |
| – Net Position: | 87,203 | -102,673 | 15,470 |
| – Gross Longs: | 124,858 | 242,001 | 42,190 |
| – Gross Shorts: | 37,655 | 344,674 | 26,720 |
| – Long to Short Ratio: | 3.3 to 1 | 0.7 to 1 | 1.6 to 1 |
| NET POSITION TREND: | |||
| – COT Index Score (3 Year Range Pct): | 74.4 | 25.3 | 71.2 |
| – COT Index Reading (3 Year Range): | Bullish | Bearish | Bullish |
| NET POSITION MOVEMENT INDEX: | |||
| – 6-Week Change in Strength Index: | -3.7 | 4.2 | -5.6 |
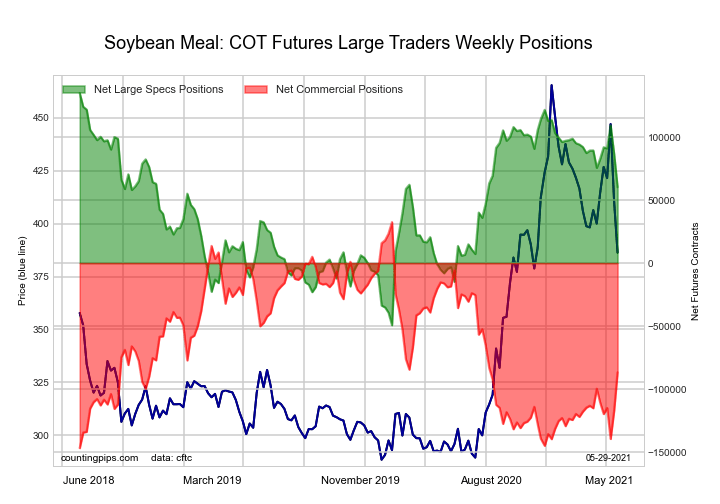
The SOYBEAN MEAL large speculator standing this week recorded a net position of 60,294 contracts in the data reported through Tuesday. This was a weekly reduction of -26,510 contracts from the previous week which had a total of 86,804 net contracts.
This week’s current strength score (the trader positioning range over the past three years, measured from 0 to 100) shows the speculators are currently Bullish with a score of 59.5 percent. The commercials are Bearish with a score of 33.5 percent and the small traders (not shown in chart) are Bullish with a score of 76.5 percent.
| SOYBEAN MEAL Futures Statistics | SPECULATORS | COMMERCIALS | SMALL TRADERS |
| – Percent of Open Interest Longs: | 22.9 | 50.5 | 12.7 |
| – Percent of Open Interest Shorts: | 7.9 | 72.0 | 6.1 |
| – Net Position: | 60,294 | -86,704 | 26,410 |
| – Gross Longs: | 92,334 | 203,528 | 51,206 |
| – Gross Shorts: | 32,040 | 290,232 | 24,796 |
| – Long to Short Ratio: | 2.9 to 1 | 0.7 to 1 | 2.1 to 1 |
| NET POSITION TREND: | |||
| – COT Index Score (3 Year Range Pct): | 59.5 | 33.5 | 76.5 |
| – COT Index Reading (3 Year Range): | Bullish | Bearish | Bullish |
| NET POSITION MOVEMENT INDEX: | |||
| – 6-Week Change in Strength Index: | -8.3 | 7.3 | 9.4 |
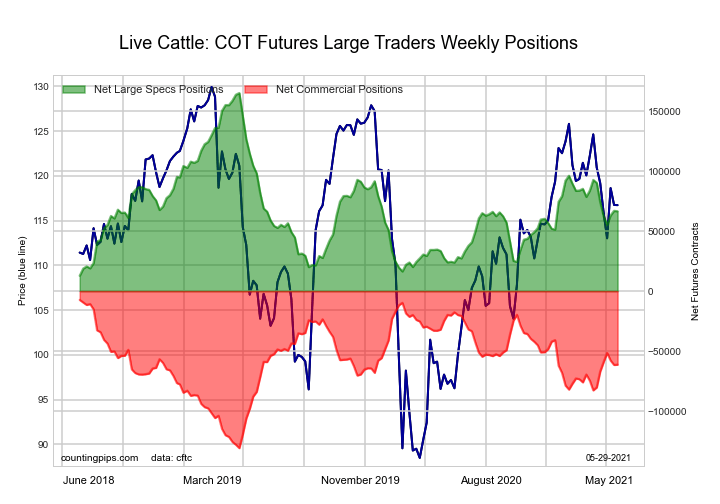
The LIVE CATTLE large speculator standing this week recorded a net position of 66,591 contracts in the data reported through Tuesday. This was a weekly fall of -364 contracts from the previous week which had a total of 66,955 net contracts.
This week’s current strength score (the trader positioning range over the past three years, measured from 0 to 100) shows the speculators are currently Bearish with a score of 35.3 percent. The commercials are Bullish with a score of 56.3 percent and the small traders (not shown in chart) are Bullish with a score of 74.2 percent.
| LIVE CATTLE Futures Statistics | SPECULATORS | COMMERCIALS | SMALL TRADERS |
| – Percent of Open Interest Longs: | 37.3 | 37.6 | 10.0 |
| – Percent of Open Interest Shorts: | 16.2 | 57.1 | 11.6 |
| – Net Position: | 66,591 | -61,294 | -5,297 |
| – Gross Longs: | 117,538 | 118,506 | 31,340 |
| – Gross Shorts: | 50,947 | 179,800 | 36,637 |
| – Long to Short Ratio: | 2.3 to 1 | 0.7 to 1 | 0.9 to 1 |
| NET POSITION TREND: | |||
| – COT Index Score (3 Year Range Pct): | 35.3 | 56.3 | 74.2 |
| – COT Index Reading (3 Year Range): | Bearish | Bullish | Bullish |
| NET POSITION MOVEMENT INDEX: | |||
| – 6-Week Change in Strength Index: | -15.6 | 15.3 | 11.6 |
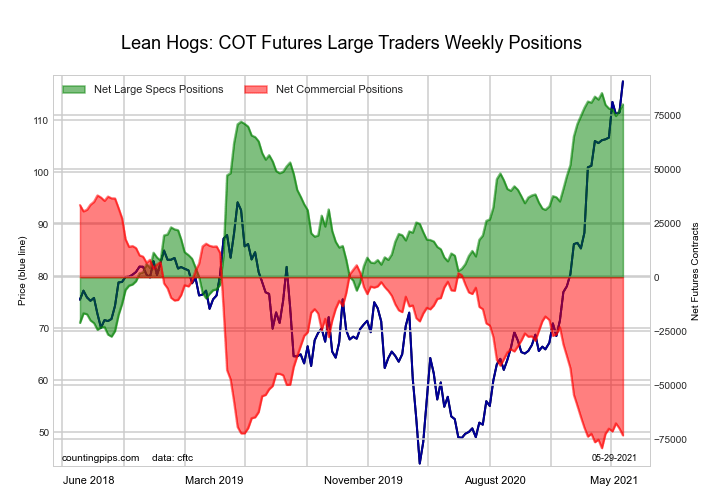
The LEAN HOGS large speculator standing this week recorded a net position of 79,975 contracts in the data reported through Tuesday. This was a weekly boost of 2,861 contracts from the previous week which had a total of 77,114 net contracts.
This week’s current strength score (the trader positioning range over the past three years, measured from 0 to 100) shows the speculators are currently Bullish-Extreme with a score of 95.4 percent. The commercials are Bearish-Extreme with a score of 5.0 percent and the small traders (not shown in chart) are Bearish with a score of 45.6 percent.
| LEAN HOGS Futures Statistics | SPECULATORS | COMMERCIALS | SMALL TRADERS |
| – Percent of Open Interest Longs: | 39.6 | 29.0 | 9.1 |
| – Percent of Open Interest Shorts: | 12.6 | 53.8 | 11.4 |
| – Net Position: | 79,975 | -73,196 | -6,779 |
| – Gross Longs: | 117,159 | 85,891 | 26,967 |
| – Gross Shorts: | 37,184 | 159,087 | 33,746 |
| – Long to Short Ratio: | 3.2 to 1 | 0.5 to 1 | 0.8 to 1 |
| NET POSITION TREND: | |||
| – COT Index Score (3 Year Range Pct): | 95.4 | 5.0 | 45.6 |
| – COT Index Reading (3 Year Range): | Bullish-Extreme | Bearish-Extreme | Bearish |
| NET POSITION MOVEMENT INDEX: | |||
| – 6-Week Change in Strength Index: | -4.6 | 5.0 | -3.2 |
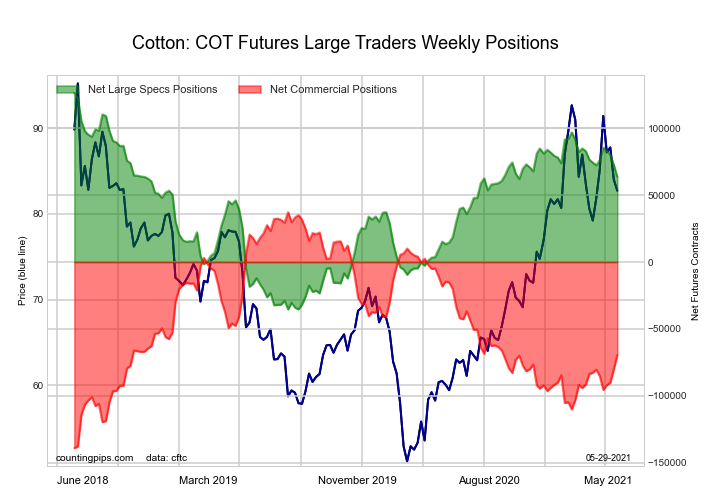
The COTTON large speculator standing this week recorded a net position of 63,653 contracts in the data reported through Tuesday. This was a weekly reduction of -9,000 contracts from the previous week which had a total of 72,653 net contracts.
This week’s current strength score (the trader positioning range over the past three years, measured from 0 to 100) shows the speculators are currently Bullish with a score of 61.2 percent. The commercials are Bearish with a score of 39.5 percent and the small traders (not shown in chart) are Bearish with a score of 46.7 percent.
| COTTON Futures Statistics | SPECULATORS | COMMERCIALS | SMALL TRADERS |
| – Percent of Open Interest Longs: | 34.8 | 46.3 | 6.3 |
| – Percent of Open Interest Shorts: | 6.2 | 77.5 | 3.7 |
| – Net Position: | 63,653 | -69,480 | 5,827 |
| – Gross Longs: | 77,472 | 103,023 | 14,033 |
| – Gross Shorts: | 13,819 | 172,503 | 8,206 |
| – Long to Short Ratio: | 5.6 to 1 | 0.6 to 1 | 1.7 to 1 |
| NET POSITION TREND: | |||
| – COT Index Score (3 Year Range Pct): | 61.2 | 39.5 | 46.7 |
| – COT Index Reading (3 Year Range): | Bullish | Bearish | Bearish |
| NET POSITION MOVEMENT INDEX: | |||
| – 6-Week Change in Strength Index: | -5.4 | 6.2 | -13.1 |
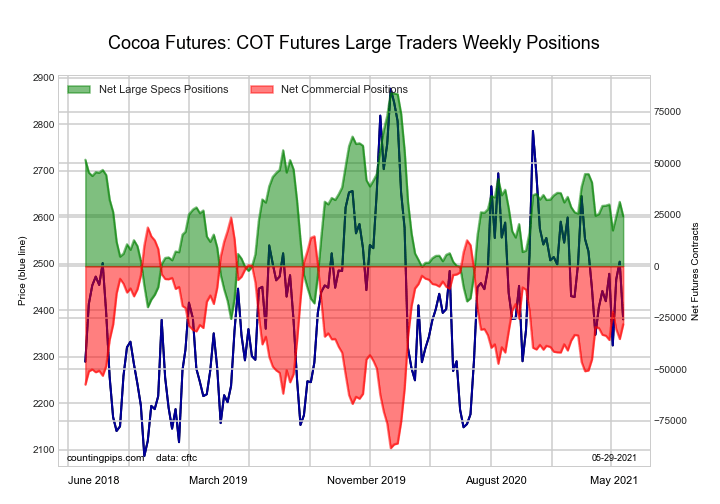
The COCOA large speculator standing this week recorded a net position of 24,303 contracts in the data reported through Tuesday. This was a weekly decrease of -6,936 contracts from the previous week which had a total of 31,239 net contracts.
This week’s current strength score (the trader positioning range over the past three years, measured from 0 to 100) shows the speculators are currently Bearish with a score of 45.5 percent. The commercials are Bullish with a score of 53.7 percent and the small traders (not shown in chart) are Bullish with a score of 52.7 percent.
| COCOA Futures Statistics | SPECULATORS | COMMERCIALS | SMALL TRADERS |
| – Percent of Open Interest Longs: | 27.7 | 45.0 | 5.4 |
| – Percent of Open Interest Shorts: | 15.9 | 58.8 | 3.5 |
| – Net Position: | 24,303 | -28,187 | 3,884 |
| – Gross Longs: | 56,891 | 92,424 | 11,036 |
| – Gross Shorts: | 32,588 | 120,611 | 7,152 |
| – Long to Short Ratio: | 1.7 to 1 | 0.8 to 1 | 1.5 to 1 |
| NET POSITION TREND: | |||
| – COT Index Score (3 Year Range Pct): | 45.5 | 53.7 | 52.7 |
| – COT Index Reading (3 Year Range): | Bearish | Bullish | Bullish |
| NET POSITION MOVEMENT INDEX: | |||
| – 6-Week Change in Strength Index: | -4.5 | 4.5 | -1.6 |
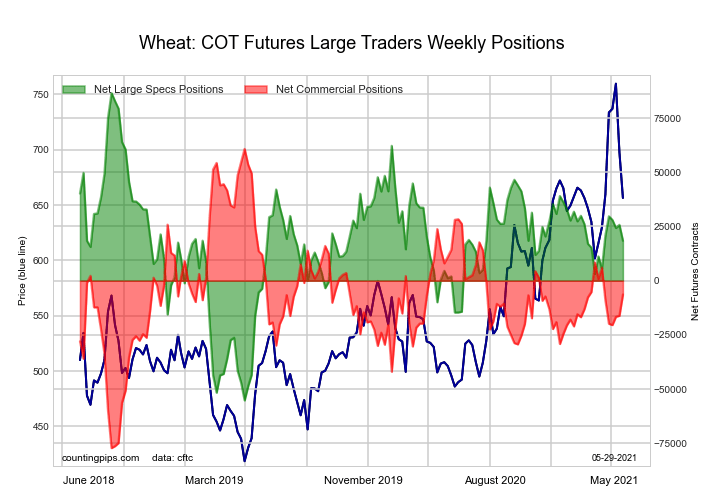
The WHEAT large speculator standing this week recorded a net position of 18,411 contracts in the data reported through Tuesday. This was a weekly decline of -7,337 contracts from the previous week which had a total of 25,748 net contracts.
This week’s current strength score (the trader positioning range over the past three years, measured from 0 to 100) shows the speculators are currently Bullish with a score of 51.9 percent. The commercials are Bullish with a score of 51.3 percent and the small traders (not shown in chart) are Bearish with a score of 44.0 percent.
| WHEAT Futures Statistics | SPECULATORS | COMMERCIALS | SMALL TRADERS |
| – Percent of Open Interest Longs: | 28.9 | 35.4 | 6.7 |
| – Percent of Open Interest Shorts: | 24.3 | 37.0 | 9.6 |
| – Net Position: | 18,411 | -6,359 | -12,052 |
| – Gross Longs: | 117,162 | 143,788 | 27,050 |
| – Gross Shorts: | 98,751 | 150,147 | 39,102 |
| – Long to Short Ratio: | 1.2 to 1 | 1.0 to 1 | 0.7 to 1 |
| NET POSITION TREND: | |||
| – COT Index Score (3 Year Range Pct): | 51.9 | 51.3 | 44.0 |
| – COT Index Reading (3 Year Range): | Bullish | Bullish | Bearish |
| NET POSITION MOVEMENT INDEX: | |||
| – 6-Week Change in Strength Index: | 9.1 | -9.0 | -2.5 |
Article By CountingPips.com – Receive our weekly COT Reports by Email
*COT Report: The COT data, released weekly to the public each Friday, is updated through the most recent Tuesday (data is 3 days old) and shows a quick view of how large speculators or non-commercials (for-profit traders) were positioned in the futures markets.
The CFTC categorizes trader positions according to commercial hedgers (traders who use futures contracts for hedging as part of the business), non-commercials (large traders who speculate to realize trading profits) and nonreportable traders (usually small traders/speculators).
Find CFTC criteria here: (http://www.cftc.gov/MarketReports/CommitmentsofTraders/ExplanatoryNotes/index.htm).
By Analytical Department RoboForex Gold fell to 4,033 USD per ounce on Thursday, extending its…
By JustMarkets By the end of the day, the Dow Jones Index (US30) rose by…
By JustMarkets On Tuesday, the US stock indices finished the session in the green, supported…
By Analytical Department RoboForex GBP/USD rose to 1.3403 on Wednesday, with British politics taking centre…
By Analytical Department RoboForex USD/JPY ended Tuesday at 162.27, with the Japanese yen remaining near…
By JustMarkets On Friday, the Dow Jones Index (US30) rose by 0.29% (weekly: -0.36%). The…
This website uses cookies.