By Dmitriy Gurkovskiy, Chief Analyst at RoboForex
On Monday, March 29th, the Japanese Yen is slightly correcting against the USD after updating its 12-month lows earlier. At the moment, the pair is mostly trading at 109.53.
Prior to that, the Japanese government approved the country’s budget for the next fiscal year, which starts on April 1st. The budget is $1 trillion and rumored that the coronavirus pandemic constantly requires increases in expenses.
The Japanese economy is still suffering from internal problems coming from restricted consumption, deflation, and the coronavirus crisis. Capital markets are still waiting for the Bank of Japan and the country’s government to announce additional expenditures and stimulus programs because it will be difficult to revive the domestic demand without them.
The Japanese Ministry of Finance makes a serious stand against increases in state expenses because the institution is also planning to replenish its reserves.
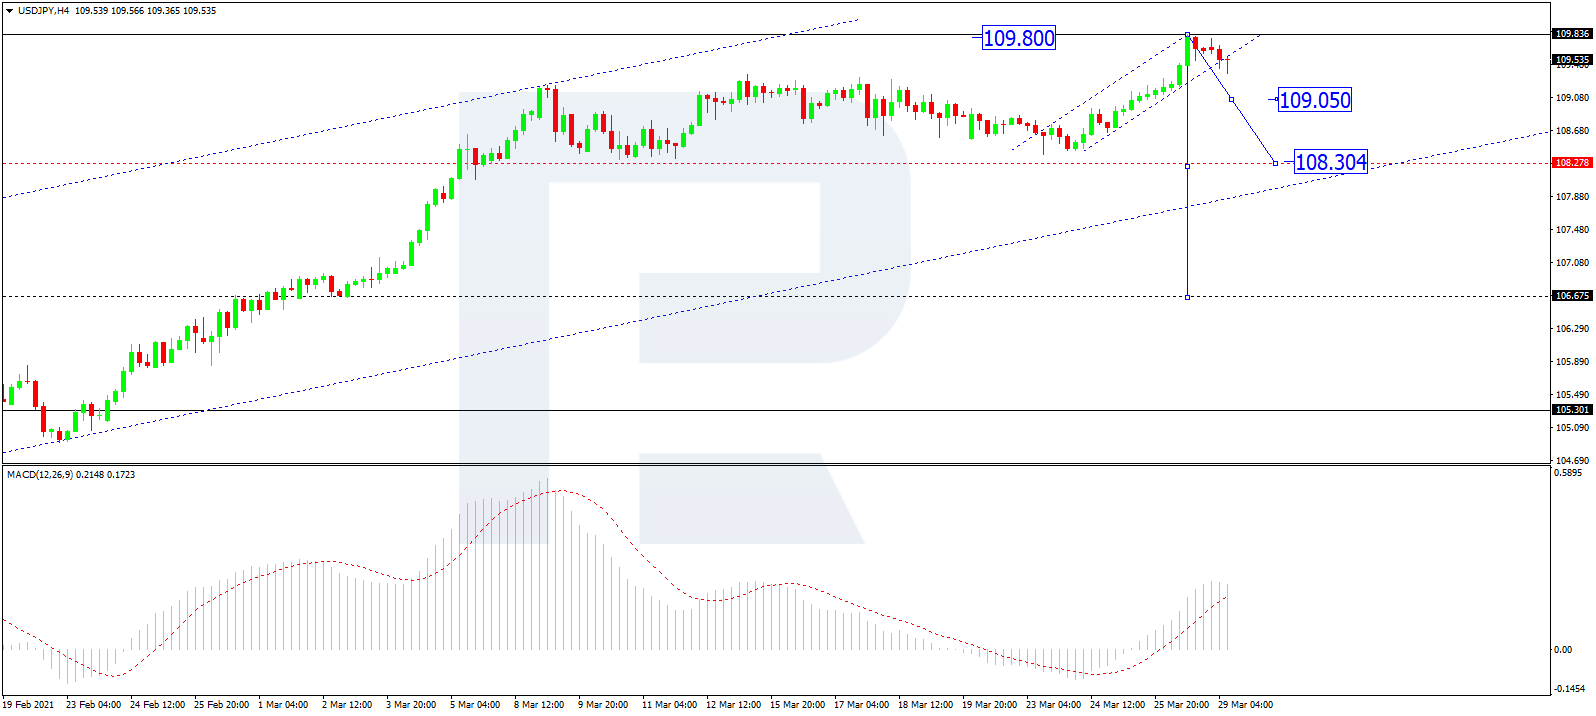
As we can see in the H4 chart, after completing the ascending wave at 109.80, USD/JPY has formed a new consolidation range below this level. Possibly, the pair may reach 109.90 and then start a new decline to break 109.05. After that, the instrument may continue trading downwards with the first target at 108.30. From the technical point of view, this scenario is confirmed by MACD Oscillator: after breaking 0 to the upside, its signal line is moving within the histogram area so far, thus implying that the asset may update its highs on the price chart. After the line leaves the area, it may continue falling to break 0 and the pair may boost its decline.
Free Reports:
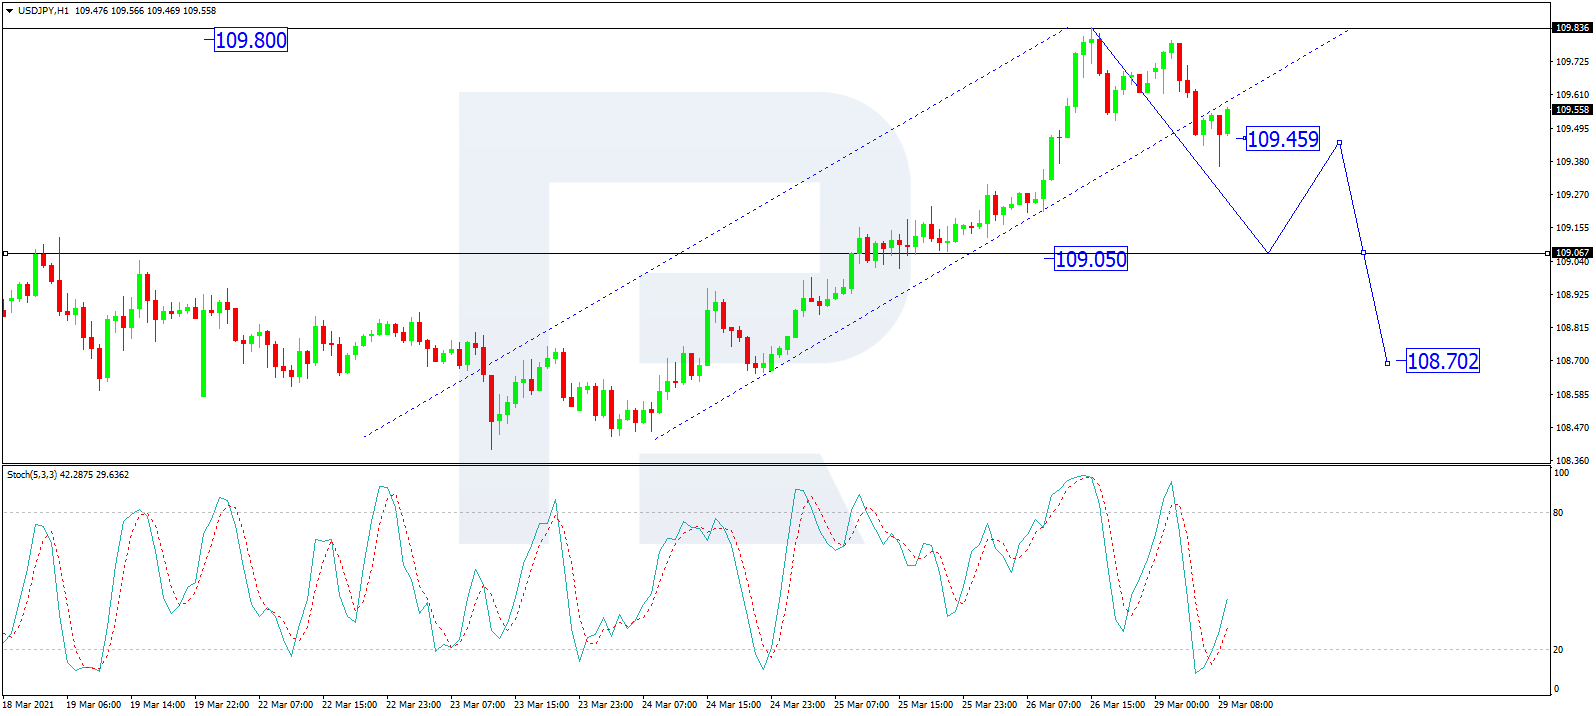
In the H1 chart, after completing the first descending structure at 109.63 along with the correction towards 109.74, USD/JPY is moving downwards. Possibly, the asset may break the downside border or this range to continue the correction towards 109.05 and then start a new growth to reach 109.45. If later the price breaks this level, the market may continue growing with the target at 109.90. On the other hand, if the asset rebounds from 109.45 and then breaks 109.05, the instrument may continue trading downwards with the short-term target at 108.70. From the technical point of view, this scenario is confirmed by the Stochastic Oscillator: its signal line is moving not far from 20 and may grow to break 50. Later, the line may continue growing towards 80. However, if the line rebounds from 50, it may resume falling to reach 20.
Disclaimer
Any forecasts contained herein are based on the author’s particular opinion. This analysis may not be treated as trading advice. RoboForex bears no responsibility for trading results based on trading recommendations and reviews contained herein.
By InvestMacro Here are the latest charts and statistics for the Commitment of Traders (COT)…
By InvestMacro The latest update for the weekly Commitment of Traders (COT) report was released…
By InvestMacro Here are the latest charts and statistics for the Commitment of Traders (COT)…
By InvestMacro Here are the latest charts and statistics for the Commitment of Traders (COT)…
By InvestMacro Here are the latest charts and statistics for the Commitment of Traders (COT)…
By InvestMacro Here are the latest charts and statistics for the Commitment of Traders (COT)…
This website uses cookies.