By CountingPips.com – Receive our weekly COT Reports by Email
Here are the latest charts and statistics for the Commitment of Traders (COT) data published by the Commodities Futures Trading Commission (CFTC).
The latest COT data is updated through Tuesday March 09 2021 and shows a quick view of how large traders (for-profit speculators and commercial entities) were positioned in the futures markets. All currency positions are in direct relation to the US dollar where, for example, a bet for the euro is a bet that the euro will rise versus the dollar while a bet against the euro will be a bet that the euro will decline versus the dollar.
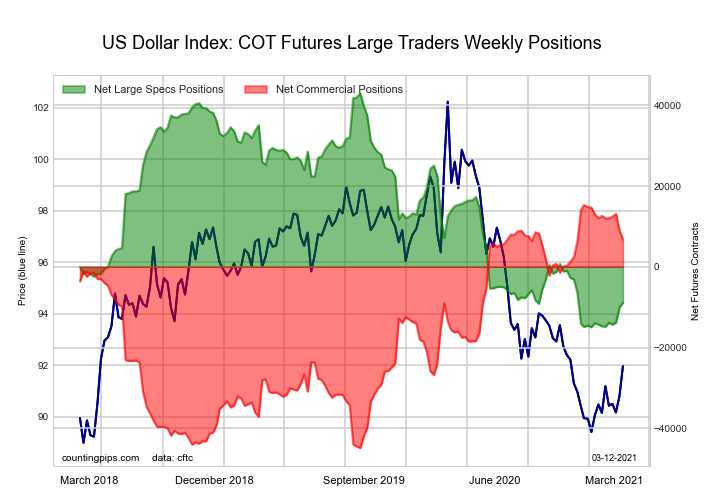
| US DOLLAR INDEX Statistics | SPECULATORS | COMMERCIALS | SMALL TRADERS |
| – Percent of Open Interest Longs: | 57.5 | 25.1 | 11.7 |
| – Percent of Open Interest Shorts: | 79.0 | 8.9 | 6.4 |
| – Net Position: | -8,887 | 6,706 | 2,181 |
| – Gross Longs: | 23,759 | 10,365 | 4,812 |
| – Gross Shorts: | 32,646 | 3,659 | 2,631 |
| – Long to Short Ratio: | 0.7 to 1 | 2.8 to 1 | 1.8 to 1 |
| NET POSITION TREND: | |||
| – COT Index Score (3 Year Range Pct): | 10.5 | 85.7 | 47.7 |
| – COT Index Reading (3 Year Range): | Bearish-Extreme | Bullish-Extreme | Bearish |
| NET POSITION MOVEMENT INDEX: | |||
| – 6-Week Change in Strength Index: | 10.1 | -9.8 | 1.1 |
Free Reports:
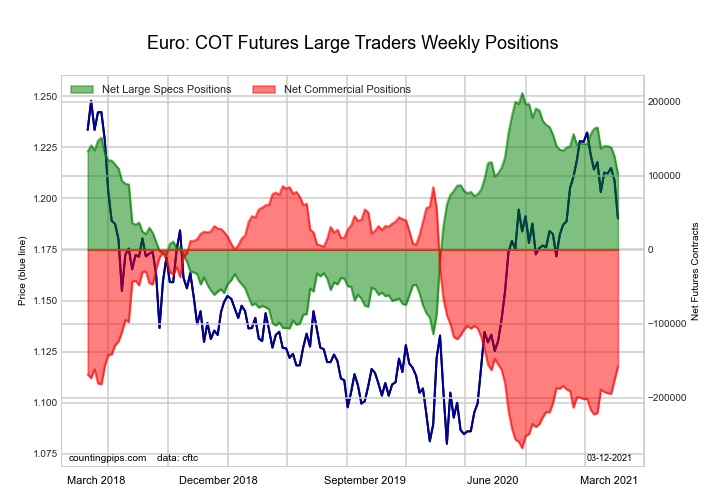
| EURO Currency Statistics | SPECULATORS | COMMERCIALS | SMALL TRADERS |
| – Percent of Open Interest Longs: | 28.7 | 55.7 | 13.4 |
| – Percent of Open Interest Shorts: | 14.6 | 77.5 | 5.7 |
| – Net Position: | 101,964 | -157,442 | 55,478 |
| – Gross Longs: | 207,588 | 402,394 | 96,525 |
| – Gross Shorts: | 105,624 | 559,836 | 41,047 |
| – Long to Short Ratio: | 2.0 to 1 | 0.7 to 1 | 2.4 to 1 |
| NET POSITION TREND: | |||
| – COT Index Score (3 Year Range Pct): | 66.3 | 31.2 | 87.8 |
| – COT Index Reading (3 Year Range): | Bullish | Bearish | Bullish-Extreme |
| NET POSITION MOVEMENT INDEX: | |||
| – 6-Week Change in Strength Index: | -19.5 | 17.9 | 0.3 |
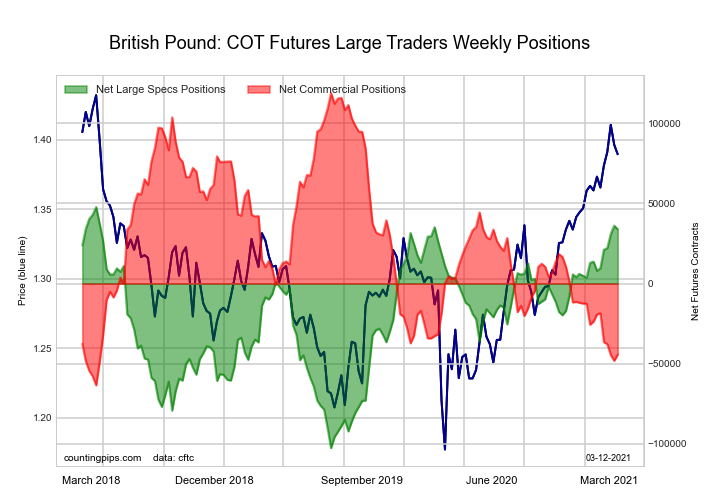
| BRITISH POUND Statistics | SPECULATORS | COMMERCIALS | SMALL TRADERS |
| – Percent of Open Interest Longs: | 33.8 | 43.5 | 20.0 |
| – Percent of Open Interest Shorts: | 15.1 | 68.0 | 14.2 |
| – Net Position: | 33,911 | -44,354 | 10,443 |
| – Gross Longs: | 61,271 | 78,946 | 36,212 |
| – Gross Shorts: | 27,360 | 123,300 | 25,769 |
| – Long to Short Ratio: | 2.2 to 1 | 0.6 to 1 | 1.4 to 1 |
| NET POSITION TREND: | |||
| – COT Index Score (3 Year Range Pct): | 90.8 | 10.5 | 87.4 |
| – COT Index Reading (3 Year Range): | Bullish-Extreme | Bearish-Extreme | Bullish-Extreme |
| NET POSITION MOVEMENT INDEX: | |||
| – 6-Week Change in Strength Index: | 17.3 | -13.8 | -1.9 |
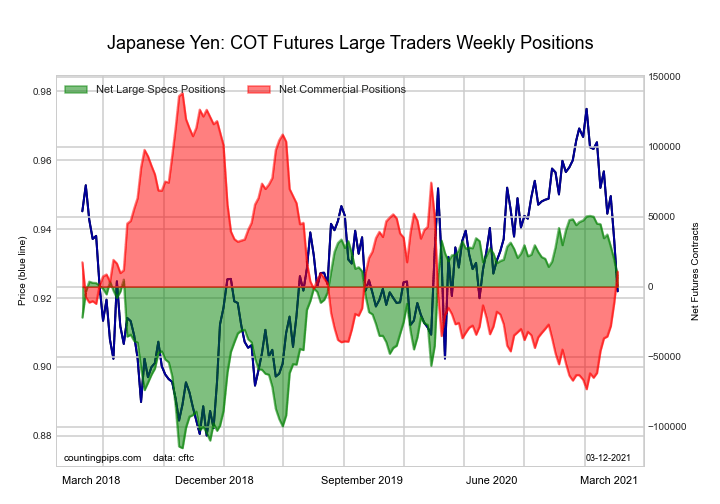
| JAPANESE YEN Statistics | SPECULATORS | COMMERCIALS | SMALL TRADERS |
| – Percent of Open Interest Longs: | 30.3 | 57.8 | 9.5 |
| – Percent of Open Interest Shorts: | 27.2 | 52.7 | 17.7 |
| – Net Position: | 6,514 | 10,816 | -17,330 |
| – Gross Longs: | 64,027 | 122,099 | 20,013 |
| – Gross Shorts: | 57,513 | 111,283 | 37,343 |
| – Long to Short Ratio: | 1.1 to 1 | 1.1 to 1 | 0.5 to 1 |
| NET POSITION TREND: | |||
| – COT Index Score (3 Year Range Pct): | 73.4 | 39.7 | 23.1 |
| – COT Index Reading (3 Year Range): | Bullish | Bearish | Bearish |
| NET POSITION MOVEMENT INDEX: | |||
| – 6-Week Change in Strength Index: | -23.2 | 34.2 | -64.8 |
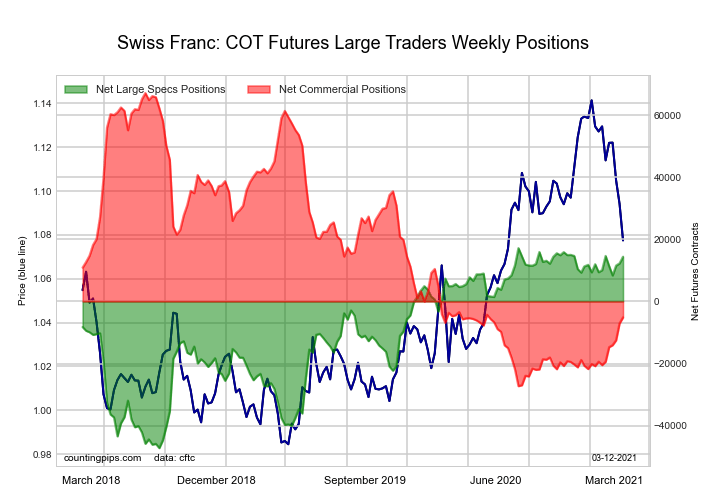
| SWISS FRANC Statistics | SPECULATORS | COMMERCIALS | SMALL TRADERS |
| – Percent of Open Interest Longs: | 41.2 | 38.1 | 17.4 |
| – Percent of Open Interest Shorts: | 16.1 | 47.0 | 33.6 |
| – Net Position: | 14,393 | -5,138 | -9,255 |
| – Gross Longs: | 23,614 | 21,844 | 9,994 |
| – Gross Shorts: | 9,221 | 26,982 | 19,249 |
| – Long to Short Ratio: | 2.6 to 1 | 0.8 to 1 | 0.5 to 1 |
| NET POSITION TREND: | |||
| – COT Index Score (3 Year Range Pct): | 95.7 | 23.5 | 40.5 |
| – COT Index Reading (3 Year Range): | Bullish-Extreme | Bearish | Bearish |
| NET POSITION MOVEMENT INDEX: | |||
| – 6-Week Change in Strength Index: | 6.7 | 16.3 | -53.7 |
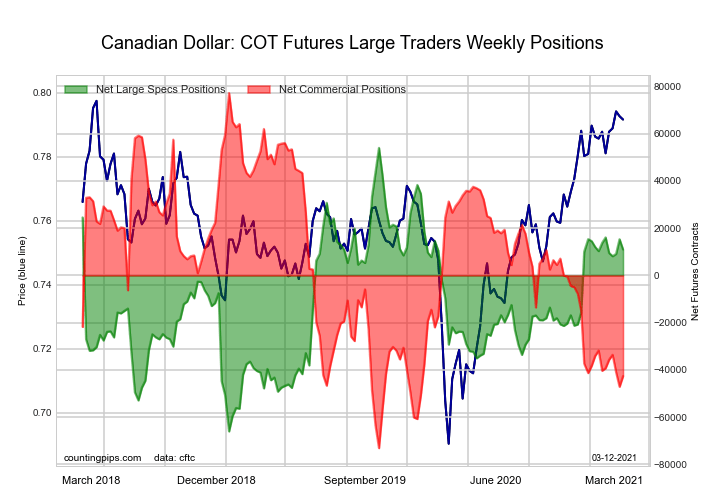
| CANADIAN DOLLAR Statistics | SPECULATORS | COMMERCIALS | SMALL TRADERS |
| – Percent of Open Interest Longs: | 28.9 | 40.7 | 28.2 |
| – Percent of Open Interest Shorts: | 22.6 | 65.4 | 10.0 |
| – Net Position: | 10,981 | -42,617 | 31,636 |
| – Gross Longs: | 50,022 | 70,529 | 48,876 |
| – Gross Shorts: | 39,041 | 113,146 | 17,240 |
| – Long to Short Ratio: | 1.3 to 1 | 0.6 to 1 | 2.8 to 1 |
| NET POSITION TREND: | |||
| – COT Index Score (3 Year Range Pct): | 64.2 | 20.3 | 94.5 |
| – COT Index Reading (3 Year Range): | Bullish | Bearish | Bullish-Extreme |
| NET POSITION MOVEMENT INDEX: | |||
| – 6-Week Change in Strength Index: | -2.3 | -1.5 | 7.6 |
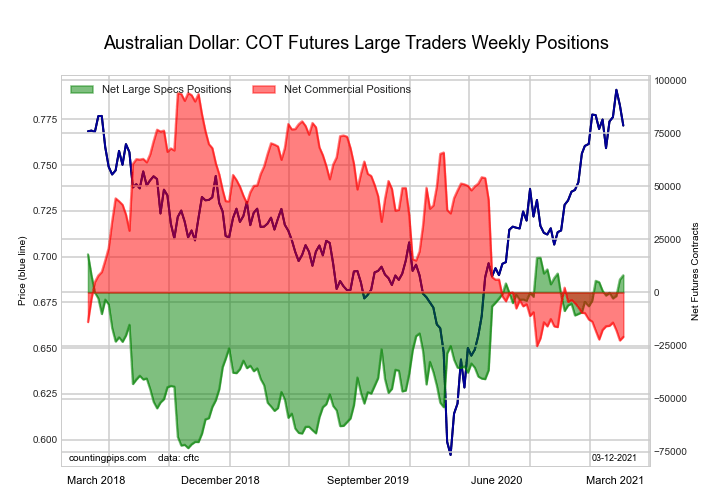
| AUSTRALIAN DOLLAR Statistics | SPECULATORS | COMMERCIALS | SMALL TRADERS |
| – Percent of Open Interest Longs: | 41.1 | 31.5 | 24.5 |
| – Percent of Open Interest Shorts: | 35.8 | 45.4 | 15.9 |
| – Net Position: | 8,075 | -20,909 | 12,834 |
| – Gross Longs: | 61,848 | 47,413 | 36,787 |
| – Gross Shorts: | 53,773 | 68,322 | 23,953 |
| – Long to Short Ratio: | 1.2 to 1 | 0.7 to 1 | 1.5 to 1 |
| NET POSITION TREND: | |||
| – COT Index Score (3 Year Range Pct): | 89.2 | 3.6 | 85.3 |
| – COT Index Reading (3 Year Range): | Bullish-Extreme | Bearish-Extreme | Bullish-Extreme |
| NET POSITION MOVEMENT INDEX: | |||
| – 6-Week Change in Strength Index: | 8.0 | -2.7 | -8.9 |
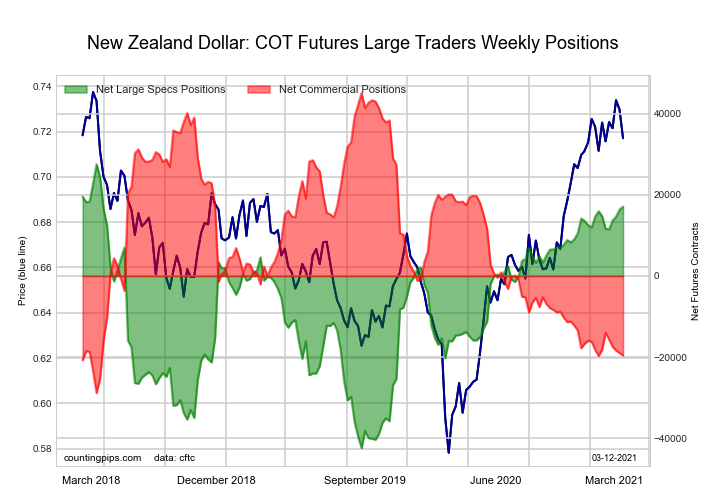
| NEW ZEALAND DOLLAR Statistics | SPECULATORS | COMMERCIALS | SMALL TRADERS |
| – Percent of Open Interest Longs: | 63.6 | 16.6 | 11.0 |
| – Percent of Open Interest Shorts: | 30.2 | 54.7 | 6.1 |
| – Net Position: | 17,126 | -19,607 | 2,481 |
| – Gross Longs: | 32,664 | 8,520 | 5,639 |
| – Gross Shorts: | 15,538 | 28,127 | 3,158 |
| – Long to Short Ratio: | 2.1 to 1 | 0.3 to 1 | 1.8 to 1 |
| NET POSITION TREND: | |||
| – COT Index Score (3 Year Range Pct): | 85.0 | 12.5 | 80.9 |
| – COT Index Reading (3 Year Range): | Bullish-Extreme | Bearish-Extreme | Bullish-Extreme |
| NET POSITION MOVEMENT INDEX: | |||
| – 6-Week Change in Strength Index: | 3.4 | -2.0 | -9.9 |
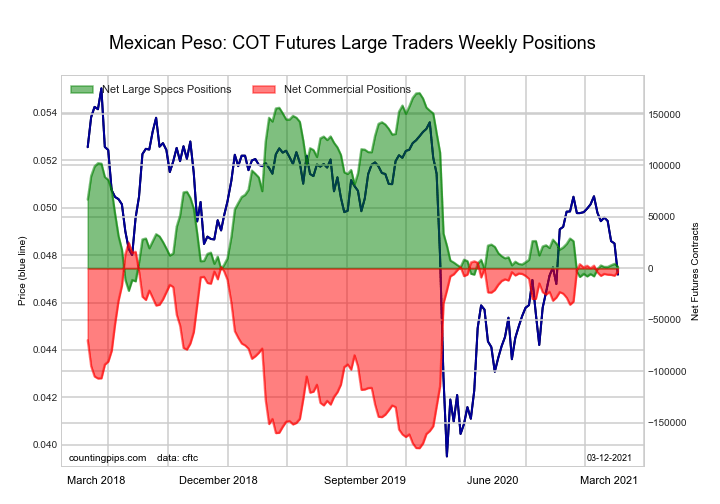
| MEXICAN PESO Statistics | SPECULATORS | COMMERCIALS | SMALL TRADERS |
| – Percent of Open Interest Longs: | 30.1 | 54.6 | 3.2 |
| – Percent of Open Interest Shorts: | 29.0 | 56.6 | 2.4 |
| – Net Position: | 1,852 | -3,298 | 1,446 |
| – Gross Longs: | 50,349 | 91,409 | 5,402 |
| – Gross Shorts: | 48,497 | 94,707 | 3,956 |
| – Long to Short Ratio: | 1.0 to 1 | 1.0 to 1 | 1.4 to 1 |
| NET POSITION TREND: | |||
| – COT Index Score (3 Year Range Pct): | 12.3 | 85.8 | 49.2 |
| – COT Index Reading (3 Year Range): | Bearish-Extreme | Bullish-Extreme | Bearish |
| NET POSITION MOVEMENT INDEX: | |||
| – 6-Week Change in Strength Index: | 1.5 | 0.2 | -13.6 |
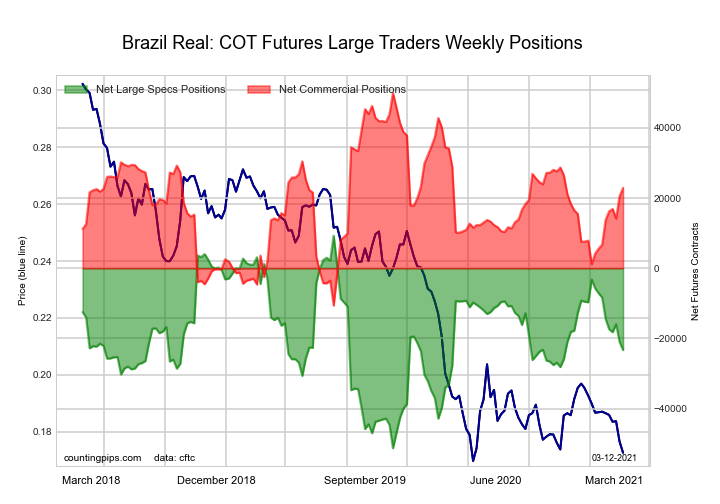
| BRAZIL REAL Statistics | SPECULATORS | COMMERCIALS | SMALL TRADERS |
| – Percent of Open Interest Longs: | 34.0 | 58.6 | 6.6 |
| – Percent of Open Interest Shorts: | 83.2 | 10.1 | 5.8 |
| – Net Position: | -23,314 | 22,926 | 388 |
| – Gross Longs: | 16,084 | 27,724 | 3,141 |
| – Gross Shorts: | 39,398 | 4,798 | 2,753 |
| – Long to Short Ratio: | 0.4 to 1 | 5.8 to 1 | 1.1 to 1 |
| NET POSITION TREND: | |||
| – COT Index Score (3 Year Range Pct): | 46.2 | 55.4 | 76.2 |
| – COT Index Reading (3 Year Range): | Bearish | Bullish | Bullish |
| NET POSITION MOVEMENT INDEX: | |||
| – 6-Week Change in Strength Index: | -24.7 | 26.7 | -15.6 |
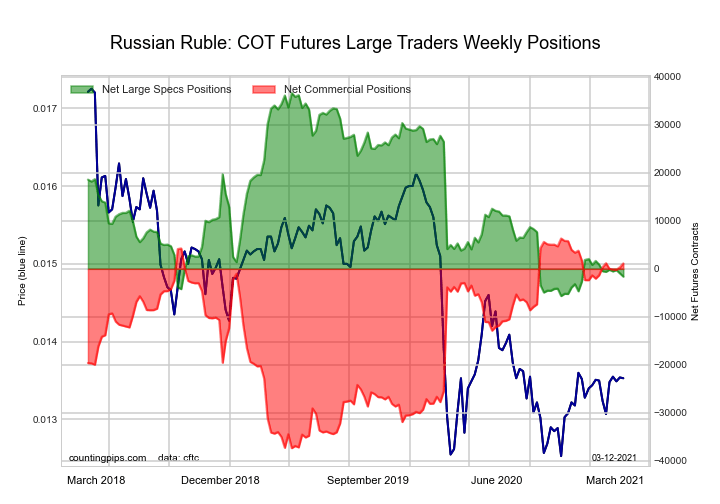
| RUSSIAN RUBLE Statistics | SPECULATORS | COMMERCIALS | SMALL TRADERS |
| – Percent of Open Interest Longs: | 30.9 | 61.1 | 7.0 |
| – Percent of Open Interest Shorts: | 36.5 | 57.3 | 5.4 |
| – Net Position: | -1,609 | 1,118 | 491 |
| – Gross Longs: | 8,999 | 17,794 | 2,050 |
| – Gross Shorts: | 10,608 | 16,676 | 1,559 |
| – Long to Short Ratio: | 0.8 to 1 | 1.1 to 1 | 1.3 to 1 |
| NET POSITION TREND: | |||
| – COT Index Score (3 Year Range Pct): | 9.6 | 88.1 | 59.0 |
| – COT Index Reading (3 Year Range): | Bearish-Extreme | Bullish-Extreme | Bullish |
| NET POSITION MOVEMENT INDEX: | |||
| – 6-Week Change in Strength Index: | -2.7 | 1.8 | 11.9 |
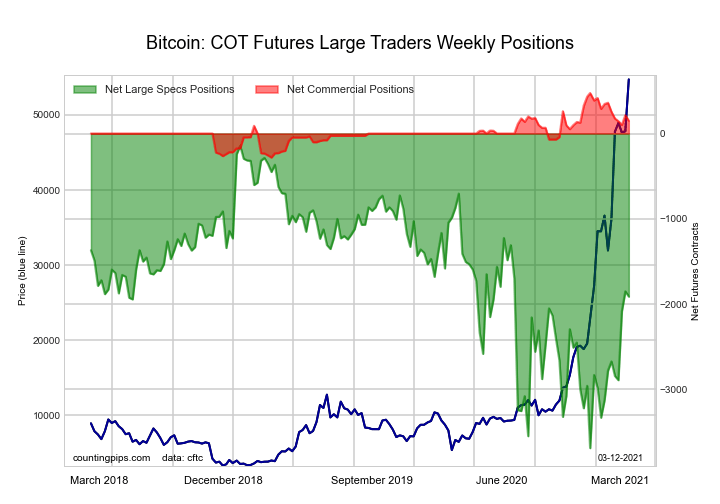
| BITCOIN Statistics | SPECULATORS | COMMERCIALS | SMALL TRADERS |
| – Percent of Open Interest Longs: | 56.3 | 4.7 | 30.0 |
| – Percent of Open Interest Shorts: | 78.1 | 3.0 | 9.9 |
| – Net Position: | -1,913 | 150 | 1,763 |
| – Gross Longs: | 4,944 | 410 | 2,635 |
| – Gross Shorts: | 6,857 | 260 | 872 |
| – Long to Short Ratio: | 0.7 to 1 | 1.6 to 1 | 3.0 to 1 |
| NET POSITION TREND: | |||
| – COT Index Score (3 Year Range Pct): | 50.1 | 57.0 | 47.7 |
| – COT Index Reading (3 Year Range): | Bullish | Bullish | Bearish |
| NET POSITION MOVEMENT INDEX: | |||
| – 6-Week Change in Strength Index: | 24.5 | -27.9 | -21.6 |
Article By CountingPips.com – Receive our weekly COT Reports by Email
*COT Report: The COT data, released weekly to the public each Friday, is updated through the most recent Tuesday (data is 3 days old) and shows a quick view of how large speculators or non-commercials (for-profit traders) were positioned in the futures markets.
The CFTC categorizes trader positions according to commercial hedgers (traders who use futures contracts for hedging as part of the business), non-commercials (large traders who speculate to realize trading profits) and nonreportable traders (usually small traders/speculators).
Don’t know which is a good broker? Check brokertested.com out. They test brokers by depositing real money and making real trades.
Find CFTC criteria here: (http://www.cftc.gov/MarketReports/CommitmentsofTraders/ExplanatoryNotes/index.htm).
By JustMarkets The US equity indices ended Friday’s session mixed. The Dow Jones (US30) gained…
By Analytical Department RoboForex EUR/USD enters the final week of July at 1.1369. Friday's modest…
By InvestMacro Here are the latest charts and statistics for the Commitment of Traders (COT)…
By InvestMacro The latest update for the weekly Commitment of Traders (COT) report was released…
By InvestMacro Here are the latest charts and statistics for the Commitment of Traders (COT)…
By InvestMacro Here are the latest charts and statistics for the Commitment of Traders (COT)…
This website uses cookies.